Systems Overview

Brief Overview
Systems Overview provides a high-level usage status of all the systems and desktop apps across a company. Management can view every application their employees use and quickly identify which ones have a lower adoption rate or are being underutilized from a single location, helping you make high-level decisions regarding the processes and systems used throughout an organization.
Systems Overview is the main Insights dashboard and the default home page for all accounts in Insights at insights.walkme.com.
Use Cases
- CIOs/CEOs methodology tool to measure software adoption based on high-level data to support strategic decisions
- Software adoption processes being utilized and prioritized across the organization according to high-level data
- Builders using adoption data to analyze end users' activity and create WalkMe content to target them accurately
How It Works
Systems Overview is our portal for the person or team in the company that owns the subject of Digital Adoption in an organization and/or a department. By configuring an account that successfully meets all the requirements, the main screen of the Enterprise Insights account will become the Systems Overview. Providing the high-level usage status and overview of all the systems and Desktop apps used across the organization or a department.
Prerequisites
- Account has at least two systems configured
- WalkMe User Identifier
- Desktop apps overview is only available for customers with WalkMe Workstation implemented and requires setup
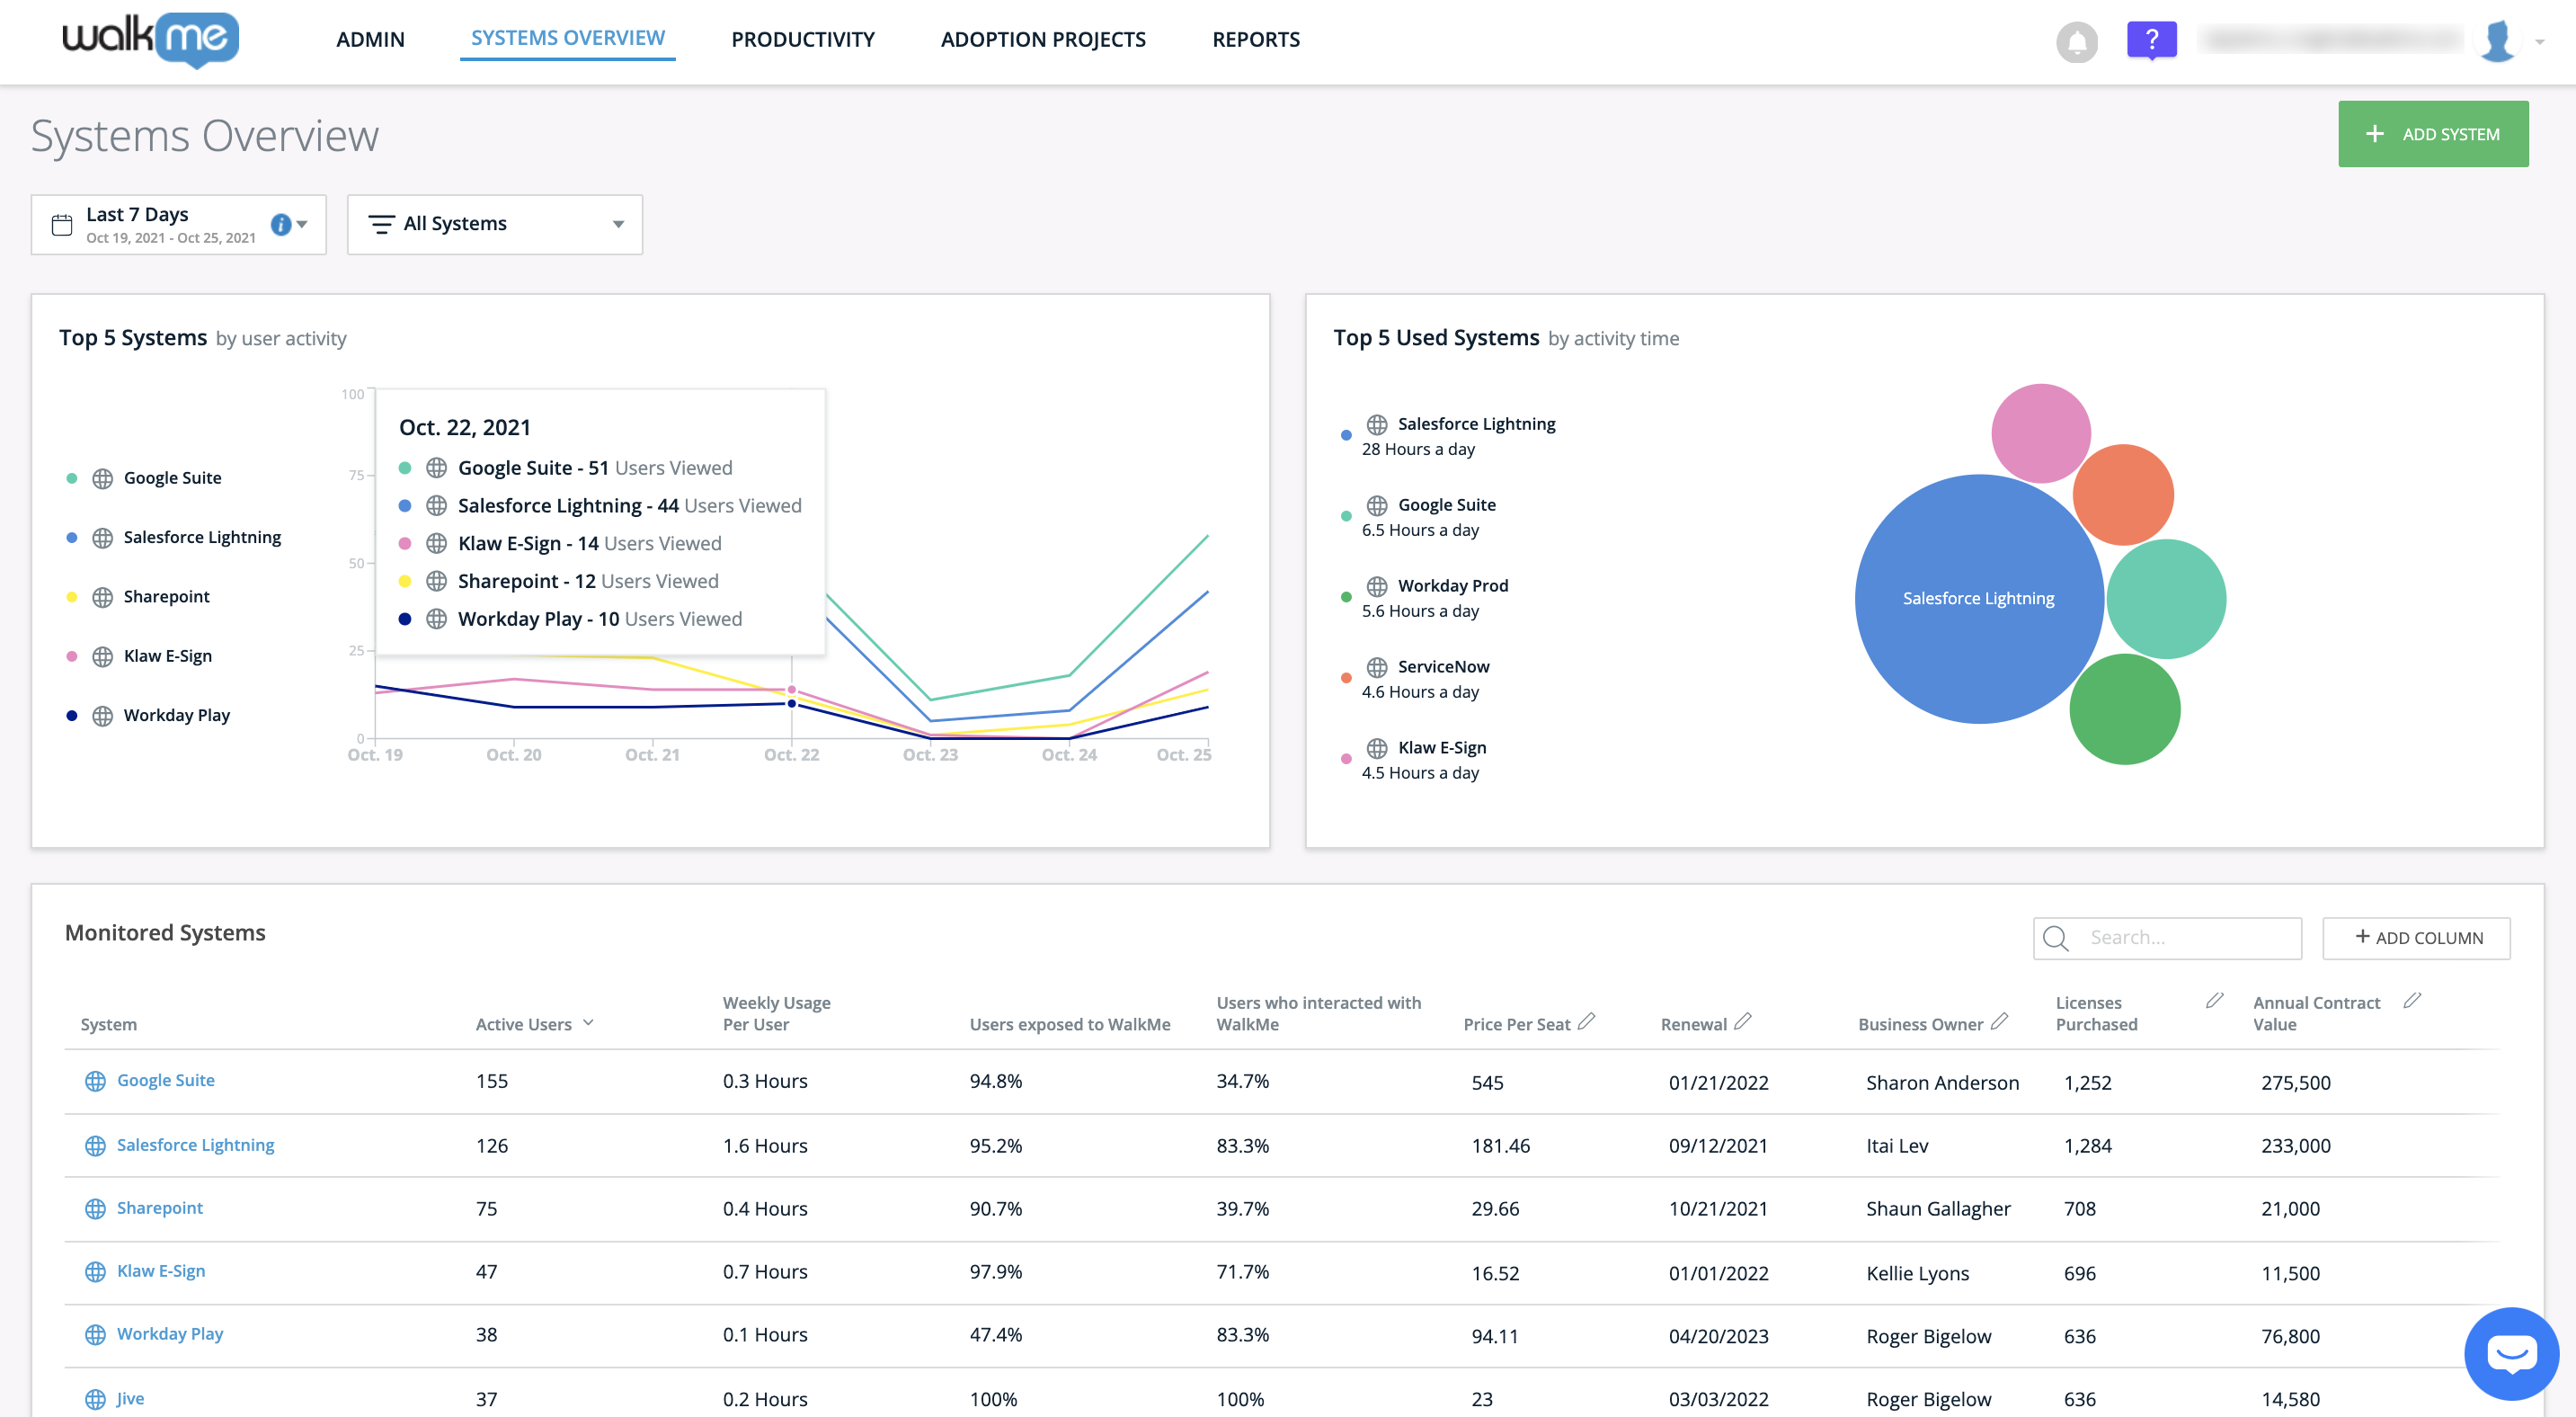
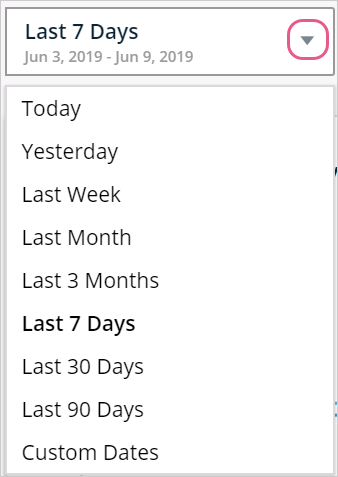
Selecting a Date Range
Using the drop-down on the top left of the Systems Overview you can select a new date range for the data values, by default it will display data from the previous week:
Filtering by System Type
Using the All System filter drop-down on the top left of the Systems Overview you can select whether you want to display All Systems, Web Systems, or Desktop Apps.

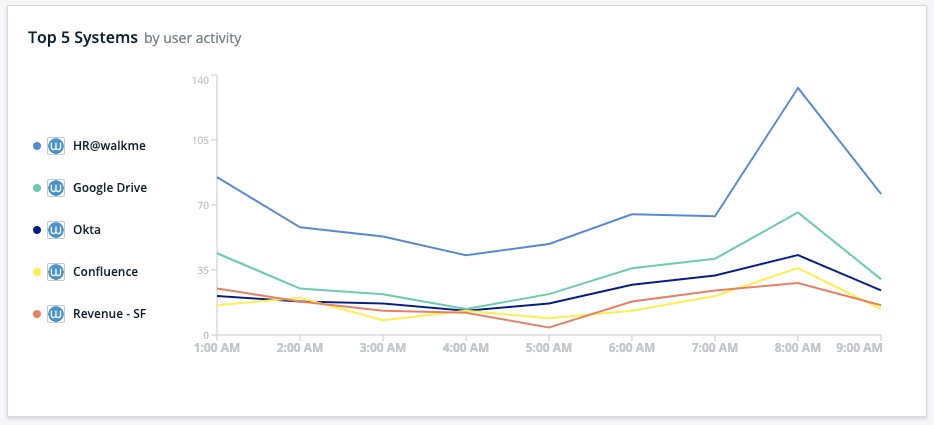
Top 5 Systems by User Activity
On the top left of the page, you can see the user activity trend for the 5 web systems and Desktop apps with the highest number of active users.
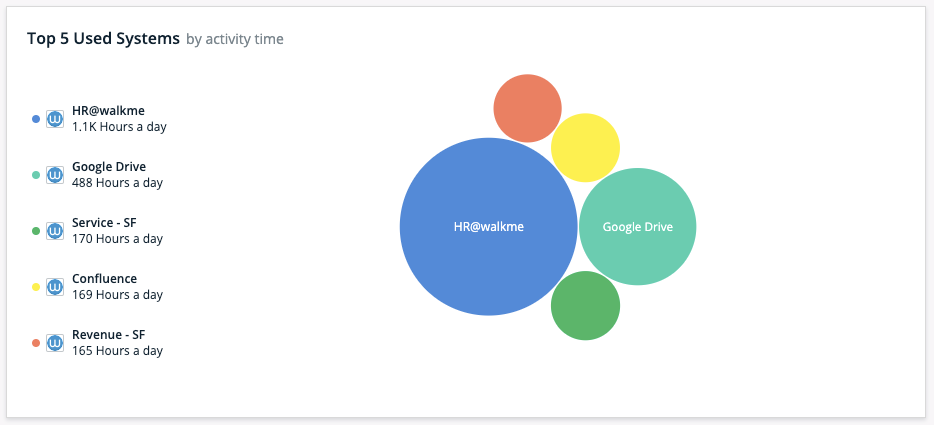
Top 5 Used Systems by Activity Time
On the top right of the Systems Overview, you can see the 5 systems and Desktop apps with the greatest aggregates session time per day across all users.
The longer the time, the bigger the circle per system will appear:
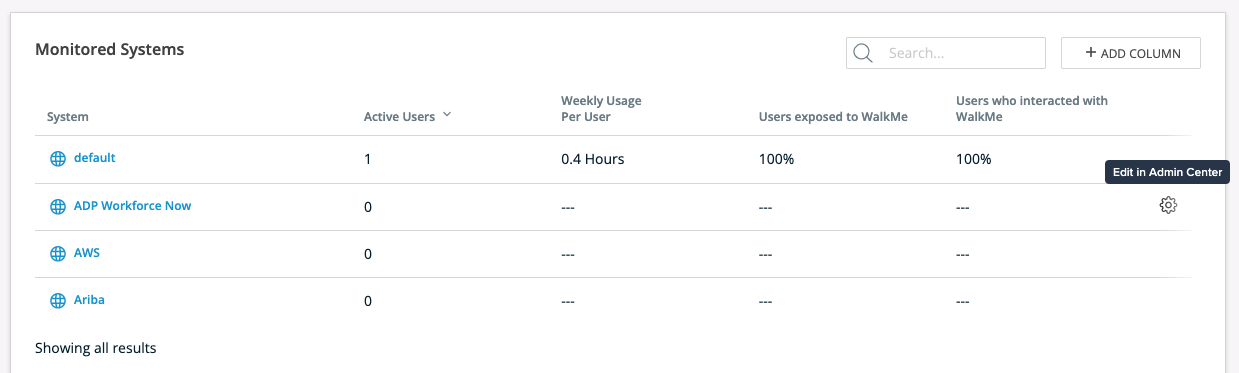
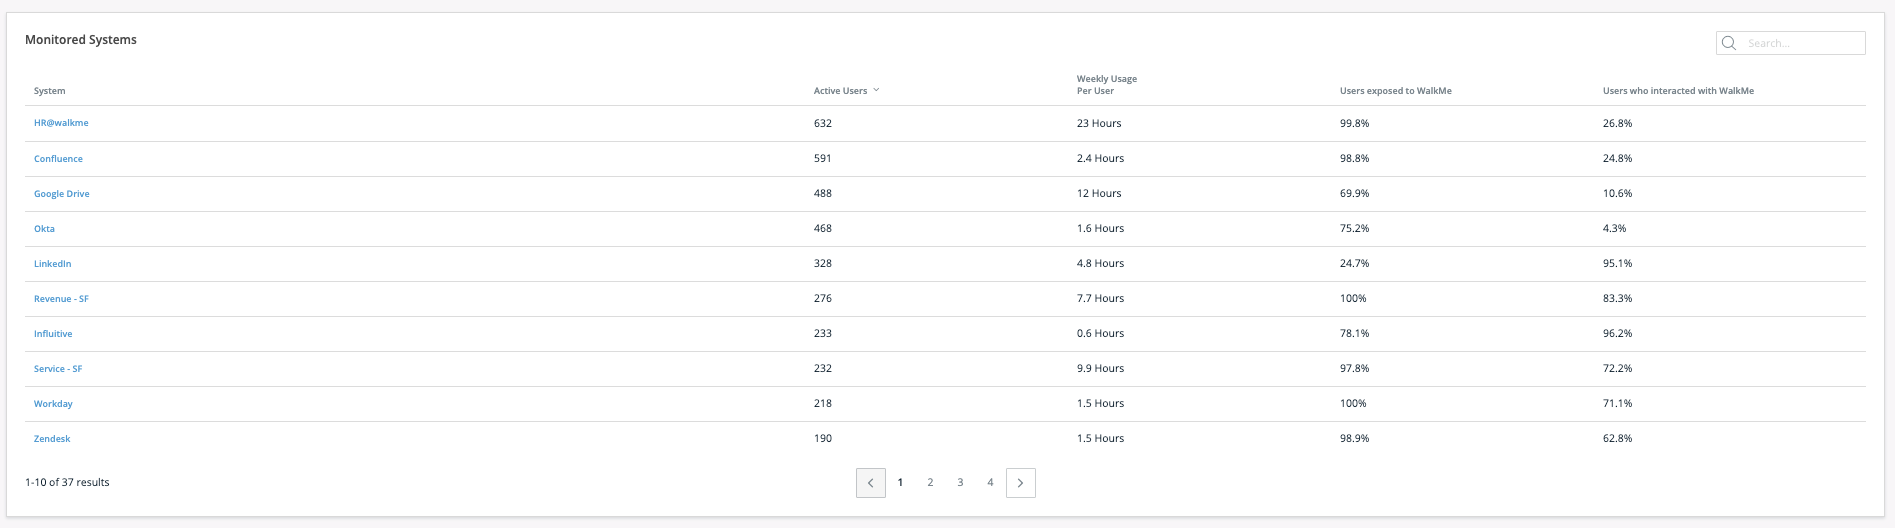
Monitored Systems
Each system row represents a WalkMe account under the Multi-System Administration account.
"Active Users" are users that had at least one session in the chosen date range.
"Weekly Usage Per User" is the average number of hours users are active in the system in a week (the total duration of all sessions divided by the number of all active users and number of weeks).
"Users Exposed to WalkMe" is the percentage of users exposed to WalkMe content, out of the total number of active users - this metric will not be populated for Desktop apps since WalkMe content cannot be created for them.
"Users who interacted with WalkMe" is the percentage of users who interacted with a WalkMe item, out of the users who were exposed to WalkMe content.
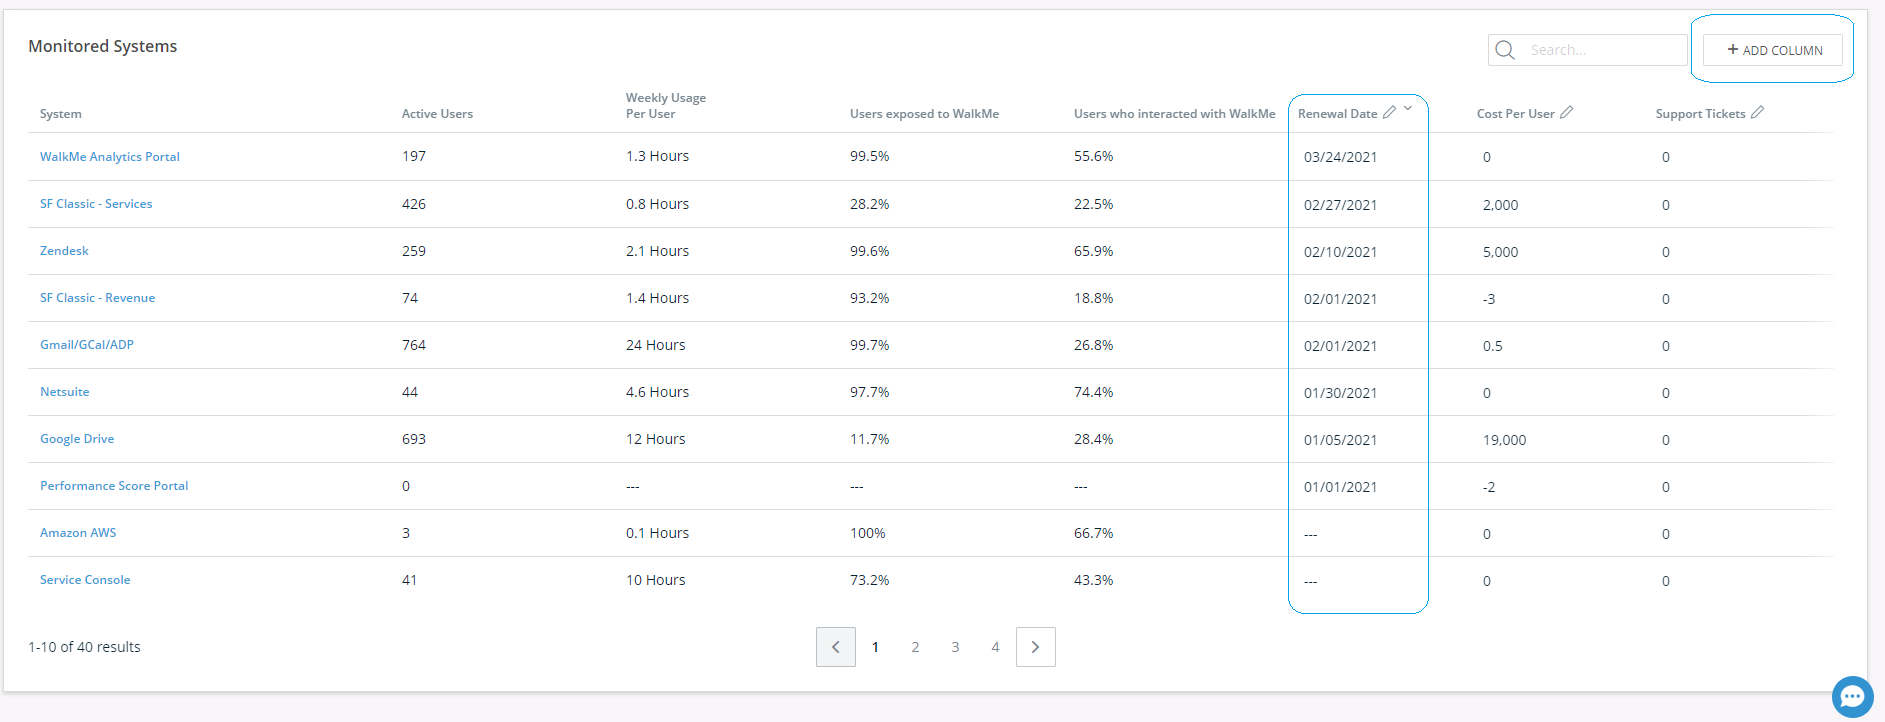
Adding Custom Columns
In addition to the four out of the box columns in the Monitored Systems table, it is possible to add "custom" columns, to enrich the dashboard with data that is meaningful for your specific use case. To add a custom column
- Click on the "ADD COLUMN" button
- Define the column name and type
- Add the values to each of the systems in the list
Once saved the column will appear in the Monitored systems table.
To edit the column data - either click on the edit button at the top of the column or edit the value inline.
Examples of columns that may be useful to add - number of licenses purchased, department, owner, cost center, date.
Drill Down to System Analytics
Clicking a system row navigates to the Insights view for that specific system.
Edit System
You can use the settings icon to navigate to the Admin Center to edit a system.