Brief Overview
With custom widgets, you have the power to create your personalized data views tailored to your unique needs. They're located in the widget gallery of Custom Dashboards, enabling users to craft personalized data views.
Users can specify the system and data type (Elements/Content/Pages) they wish to display, along with the desired format. Display options include a singular metric widget, pie chart, or table. Additionally, the feature offers widget-level filtering for precise data display.
Access
Custom widgets are created from within a dashboard. See Access in the Custom Dashboards article to open Custom Dashboards, then follow the steps below.
-
Click Add Widget
-
Click Create Custom Widget
-
Enter a name for your widget
-
Enter a description for your widget
-
Select a system from the system dropdown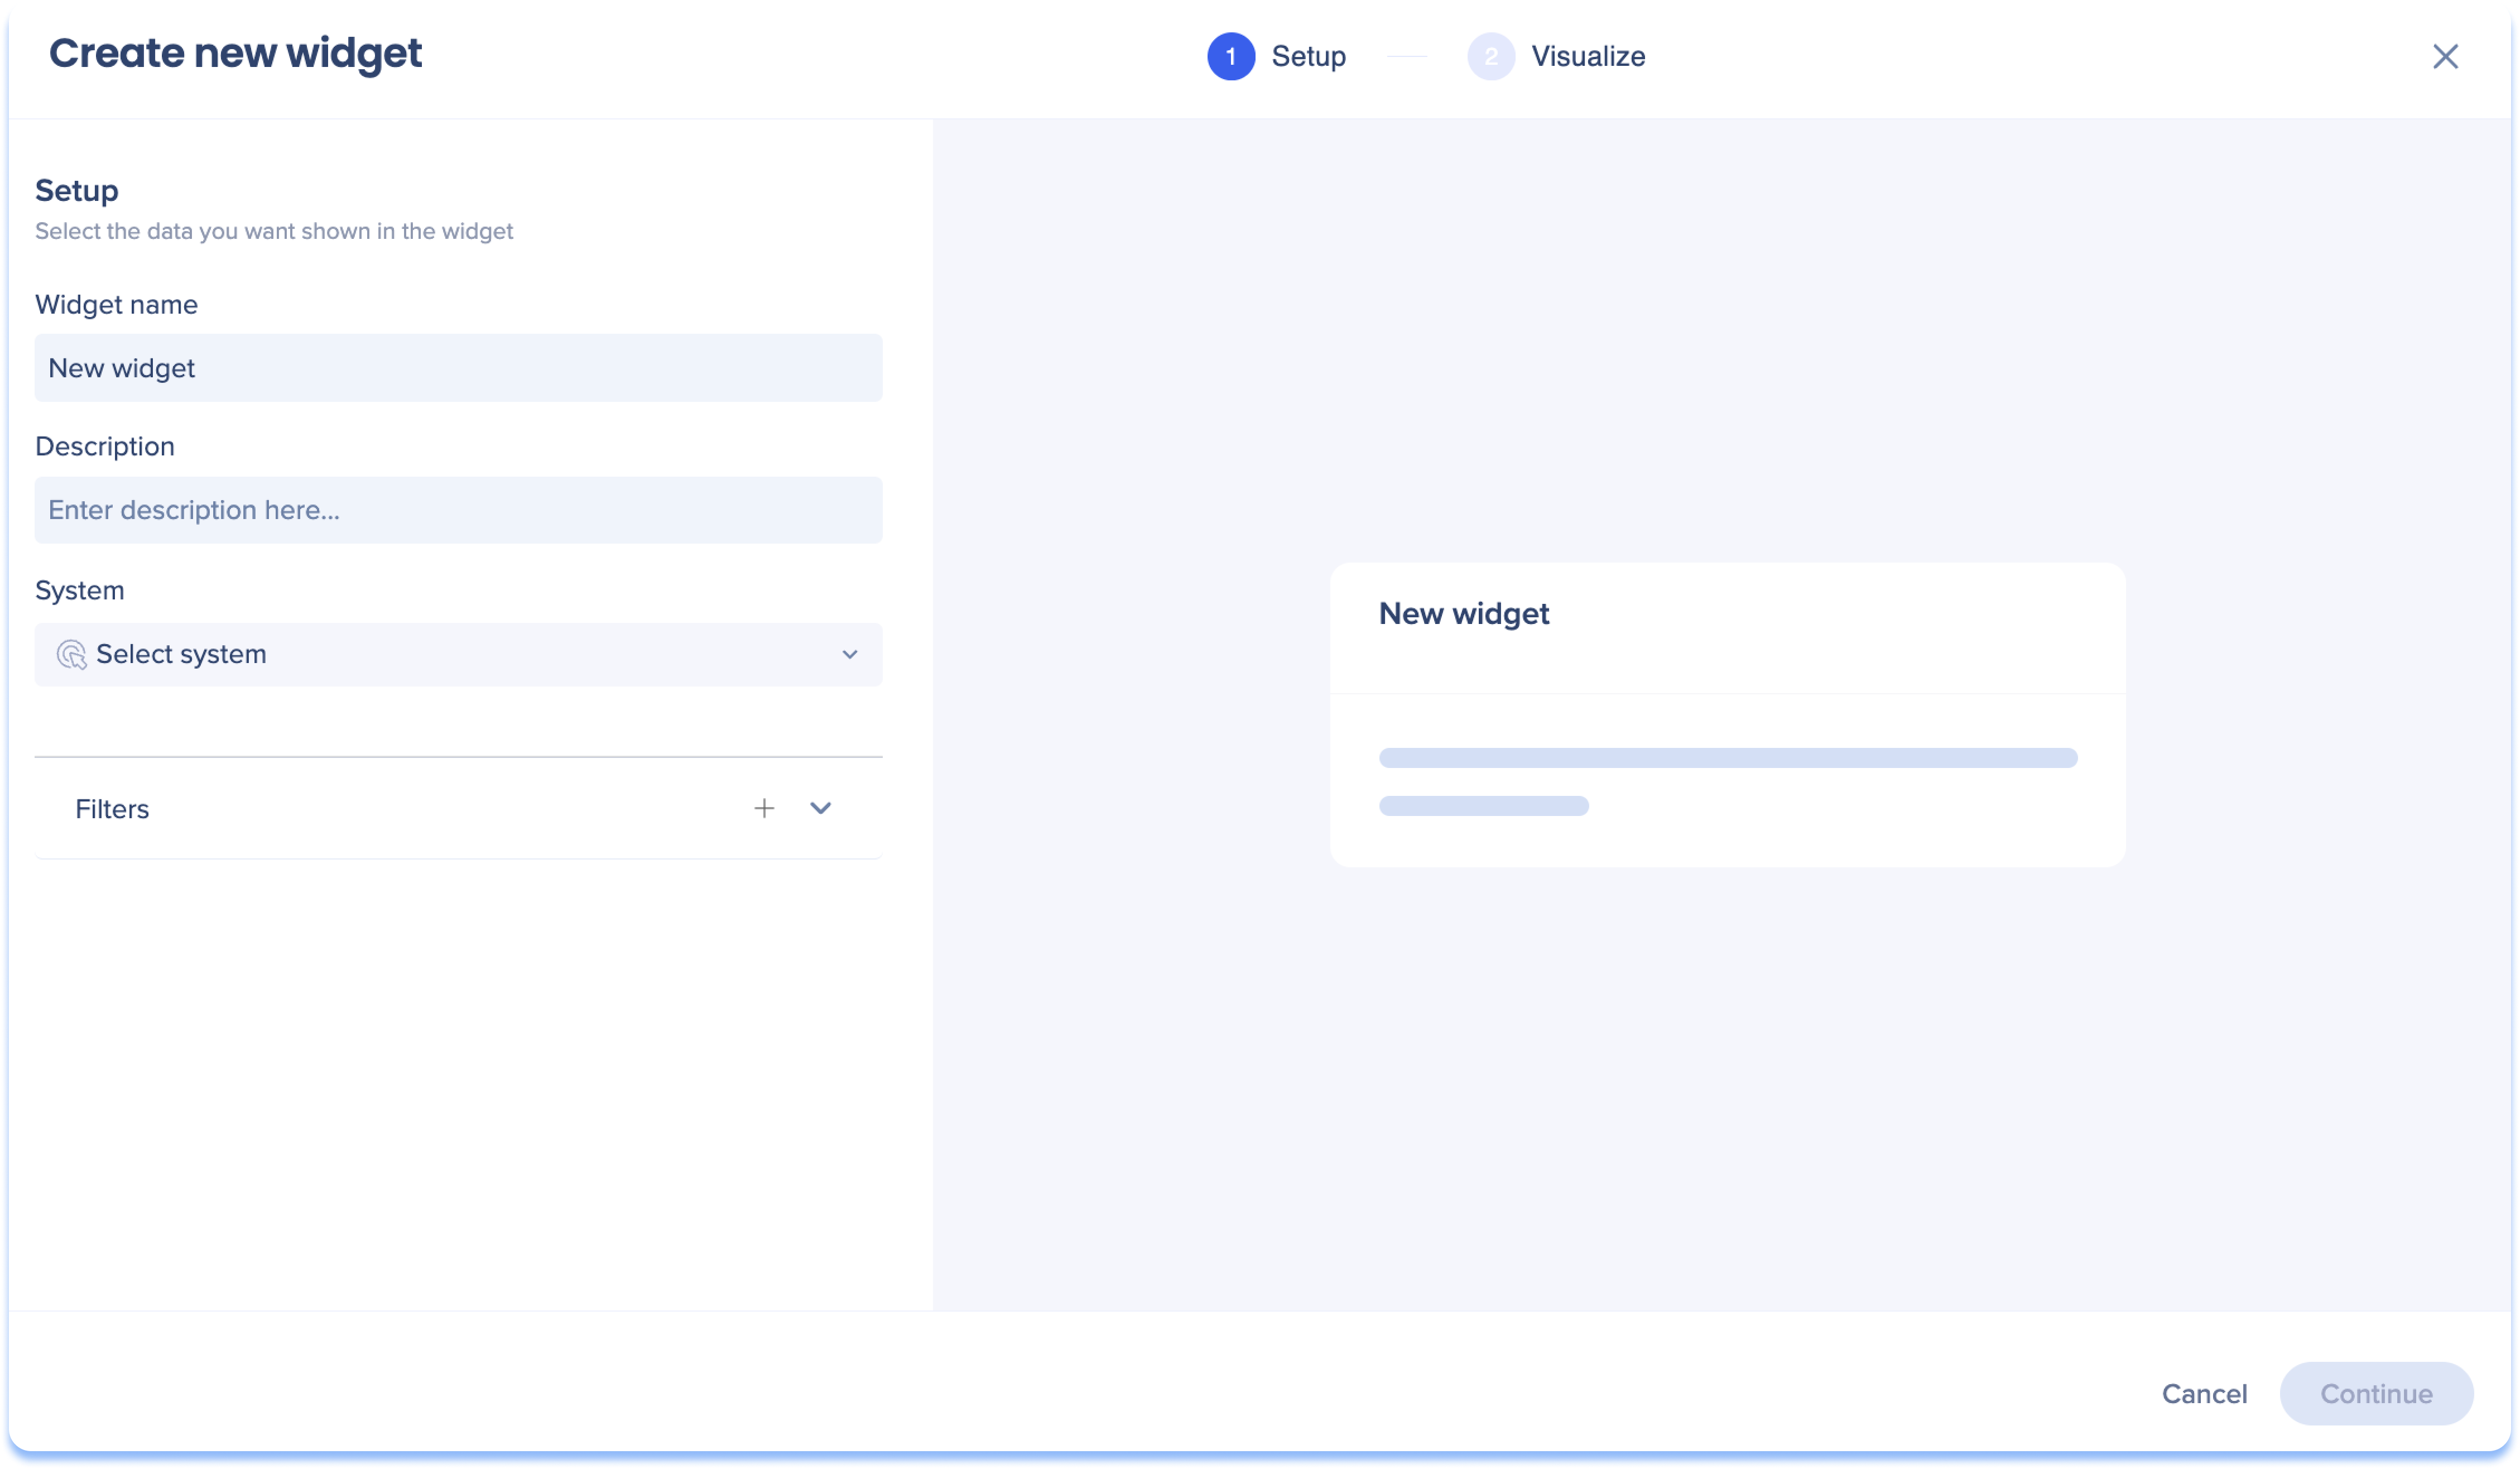
-
Select the data you want to show in the widget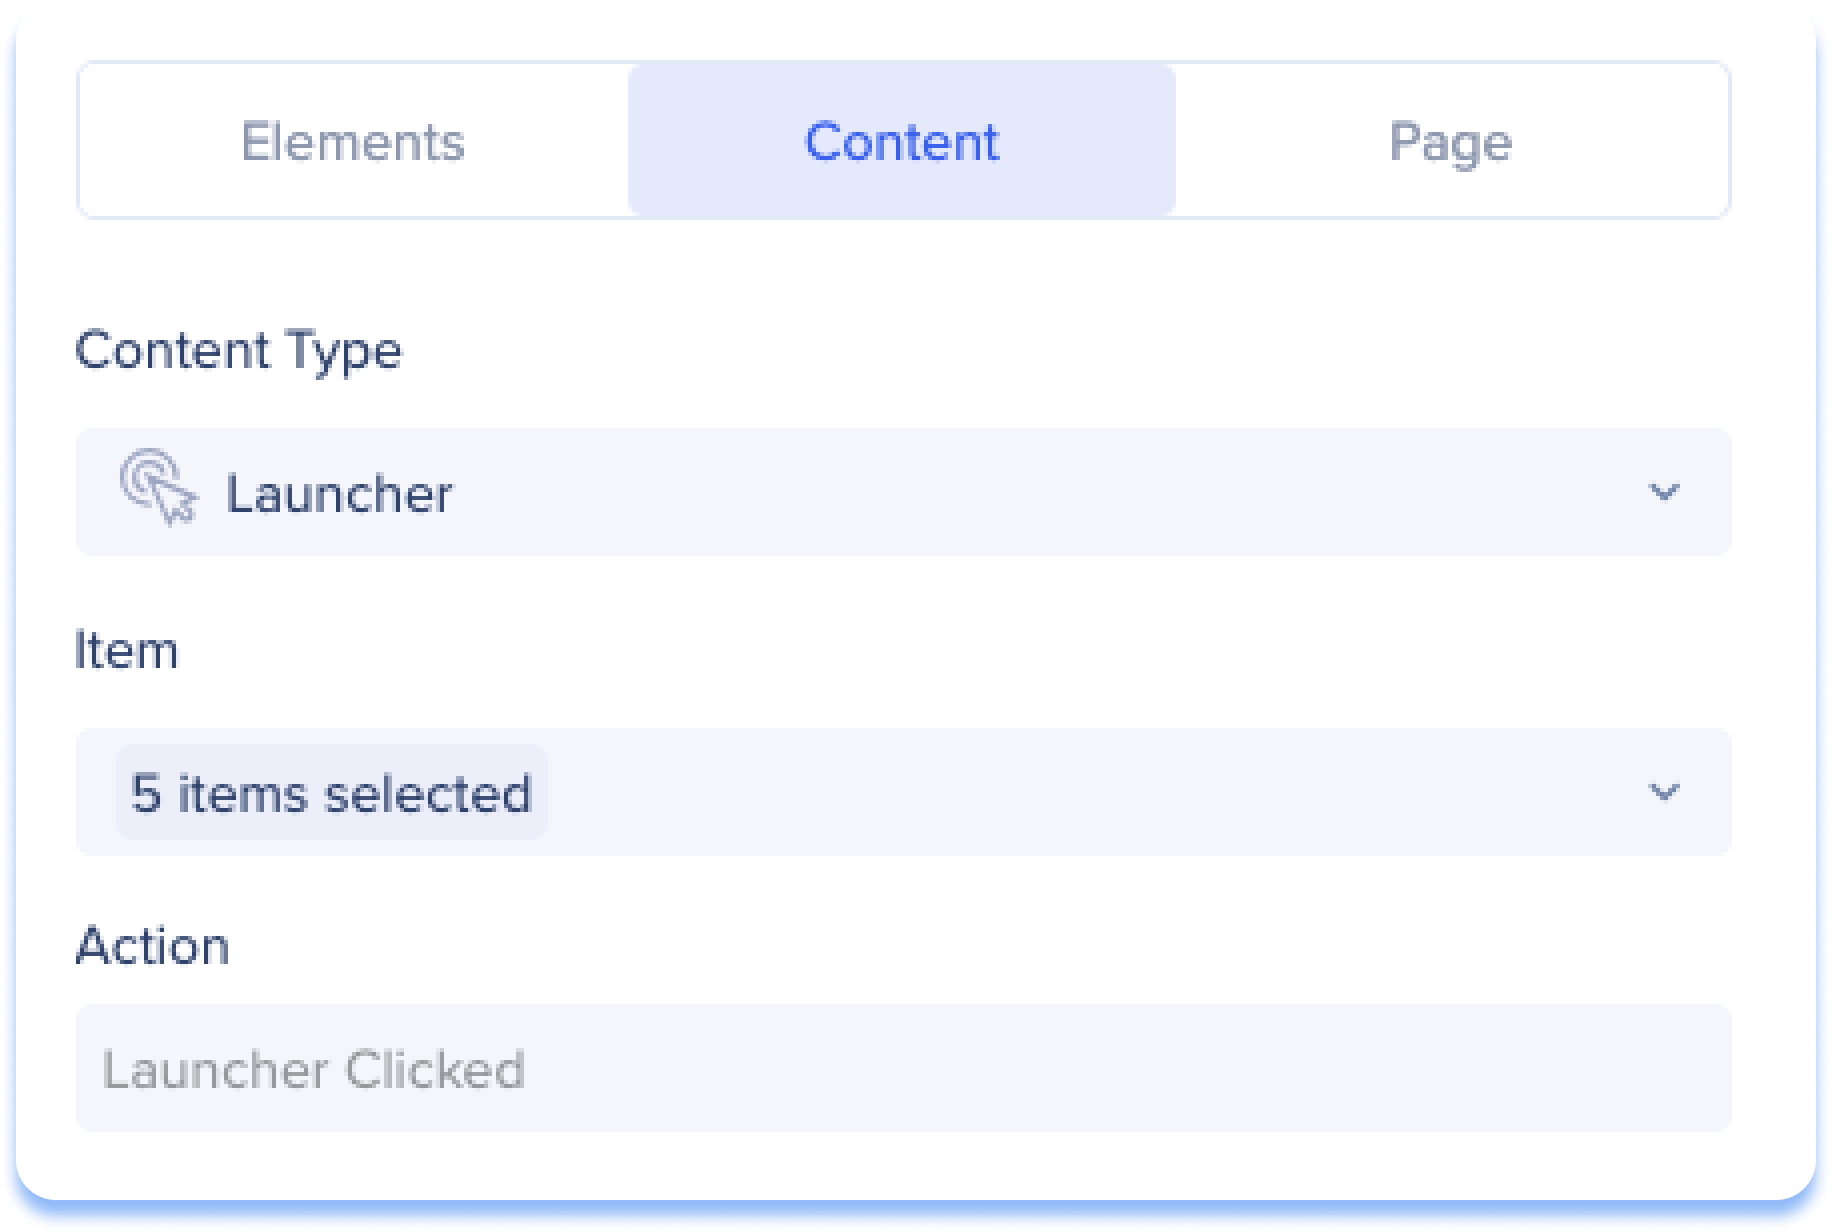
-
Element: Engaged elements that have been created from the Events page for this specific system (Tracked Events will be supported soon)
-
Select the elements from the Element dropdown
-
Content: WalkMe items created within the selected system
-
Select a content type from the Content type dropdown
-
Select specific WalkMe items within that content type from the Item dropdown
-
Page: Specific webpages to track user visits
-
Select a url from the list, any url, or type a new url in the search field
-
Optional: Click Filters to display a smaller part of the data set. Learn more.
- Click Continue
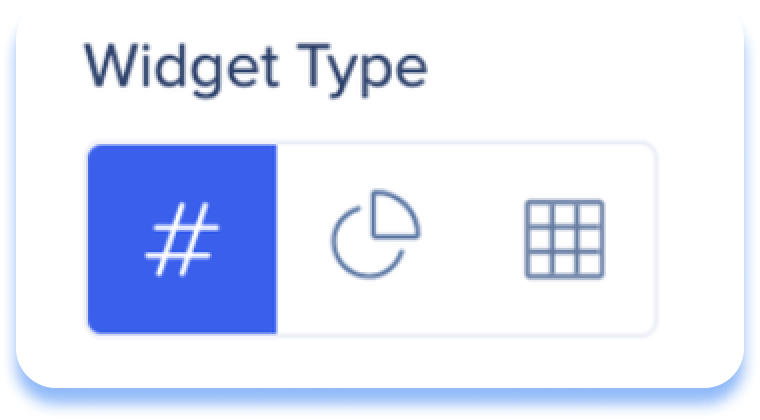
- Select a widget type to visualize your data (See Widget type section)
- Click Add to Dashboard
Singular Metric
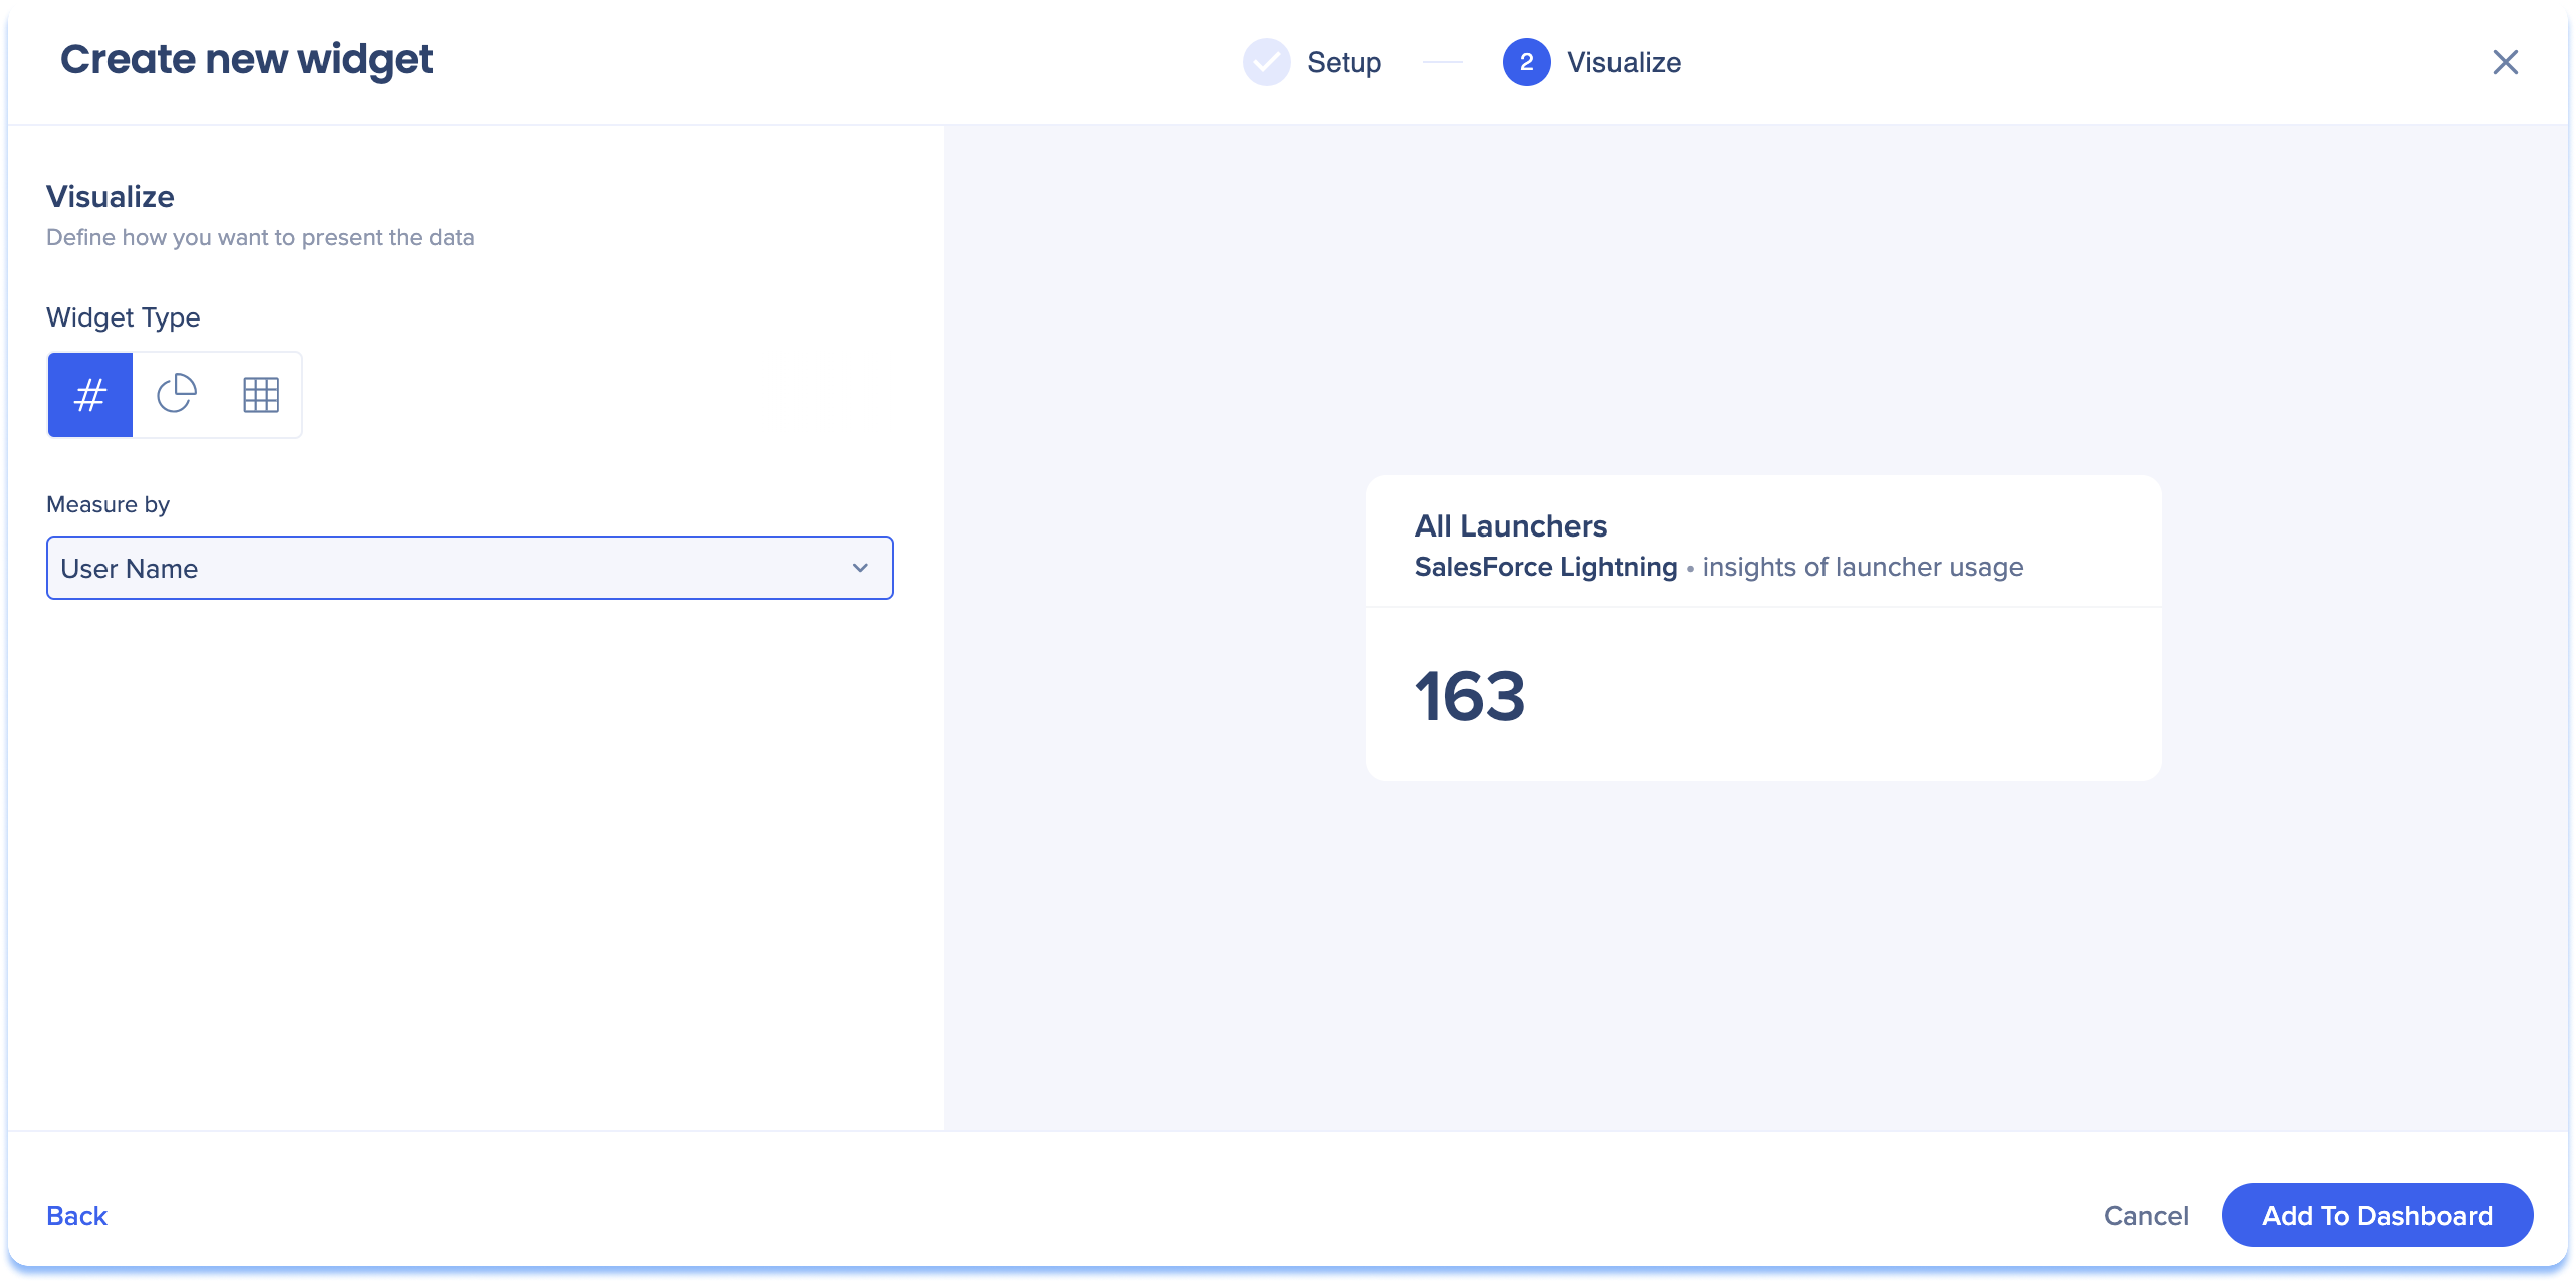
Choose the singular metric visualization method if you want to quickly display single metric as a number, making it easy to understand information on your chosen data type.
Singular Metric Example Scenario
Setup
Visualize
Interpretation
There were 163 unique users who clicked on a launcher from all of the available launchers in SalesForce Lightning.
Pie Chart
Choose the pie chart visualization method to display a whole dataset divided into individual parts.
-
Select from the Show data as dropdown what the featured dataset will be in the chart (this will be the text)
-
Select from the Measure by dropdown how you want to measure the data type (the will be the numbers)
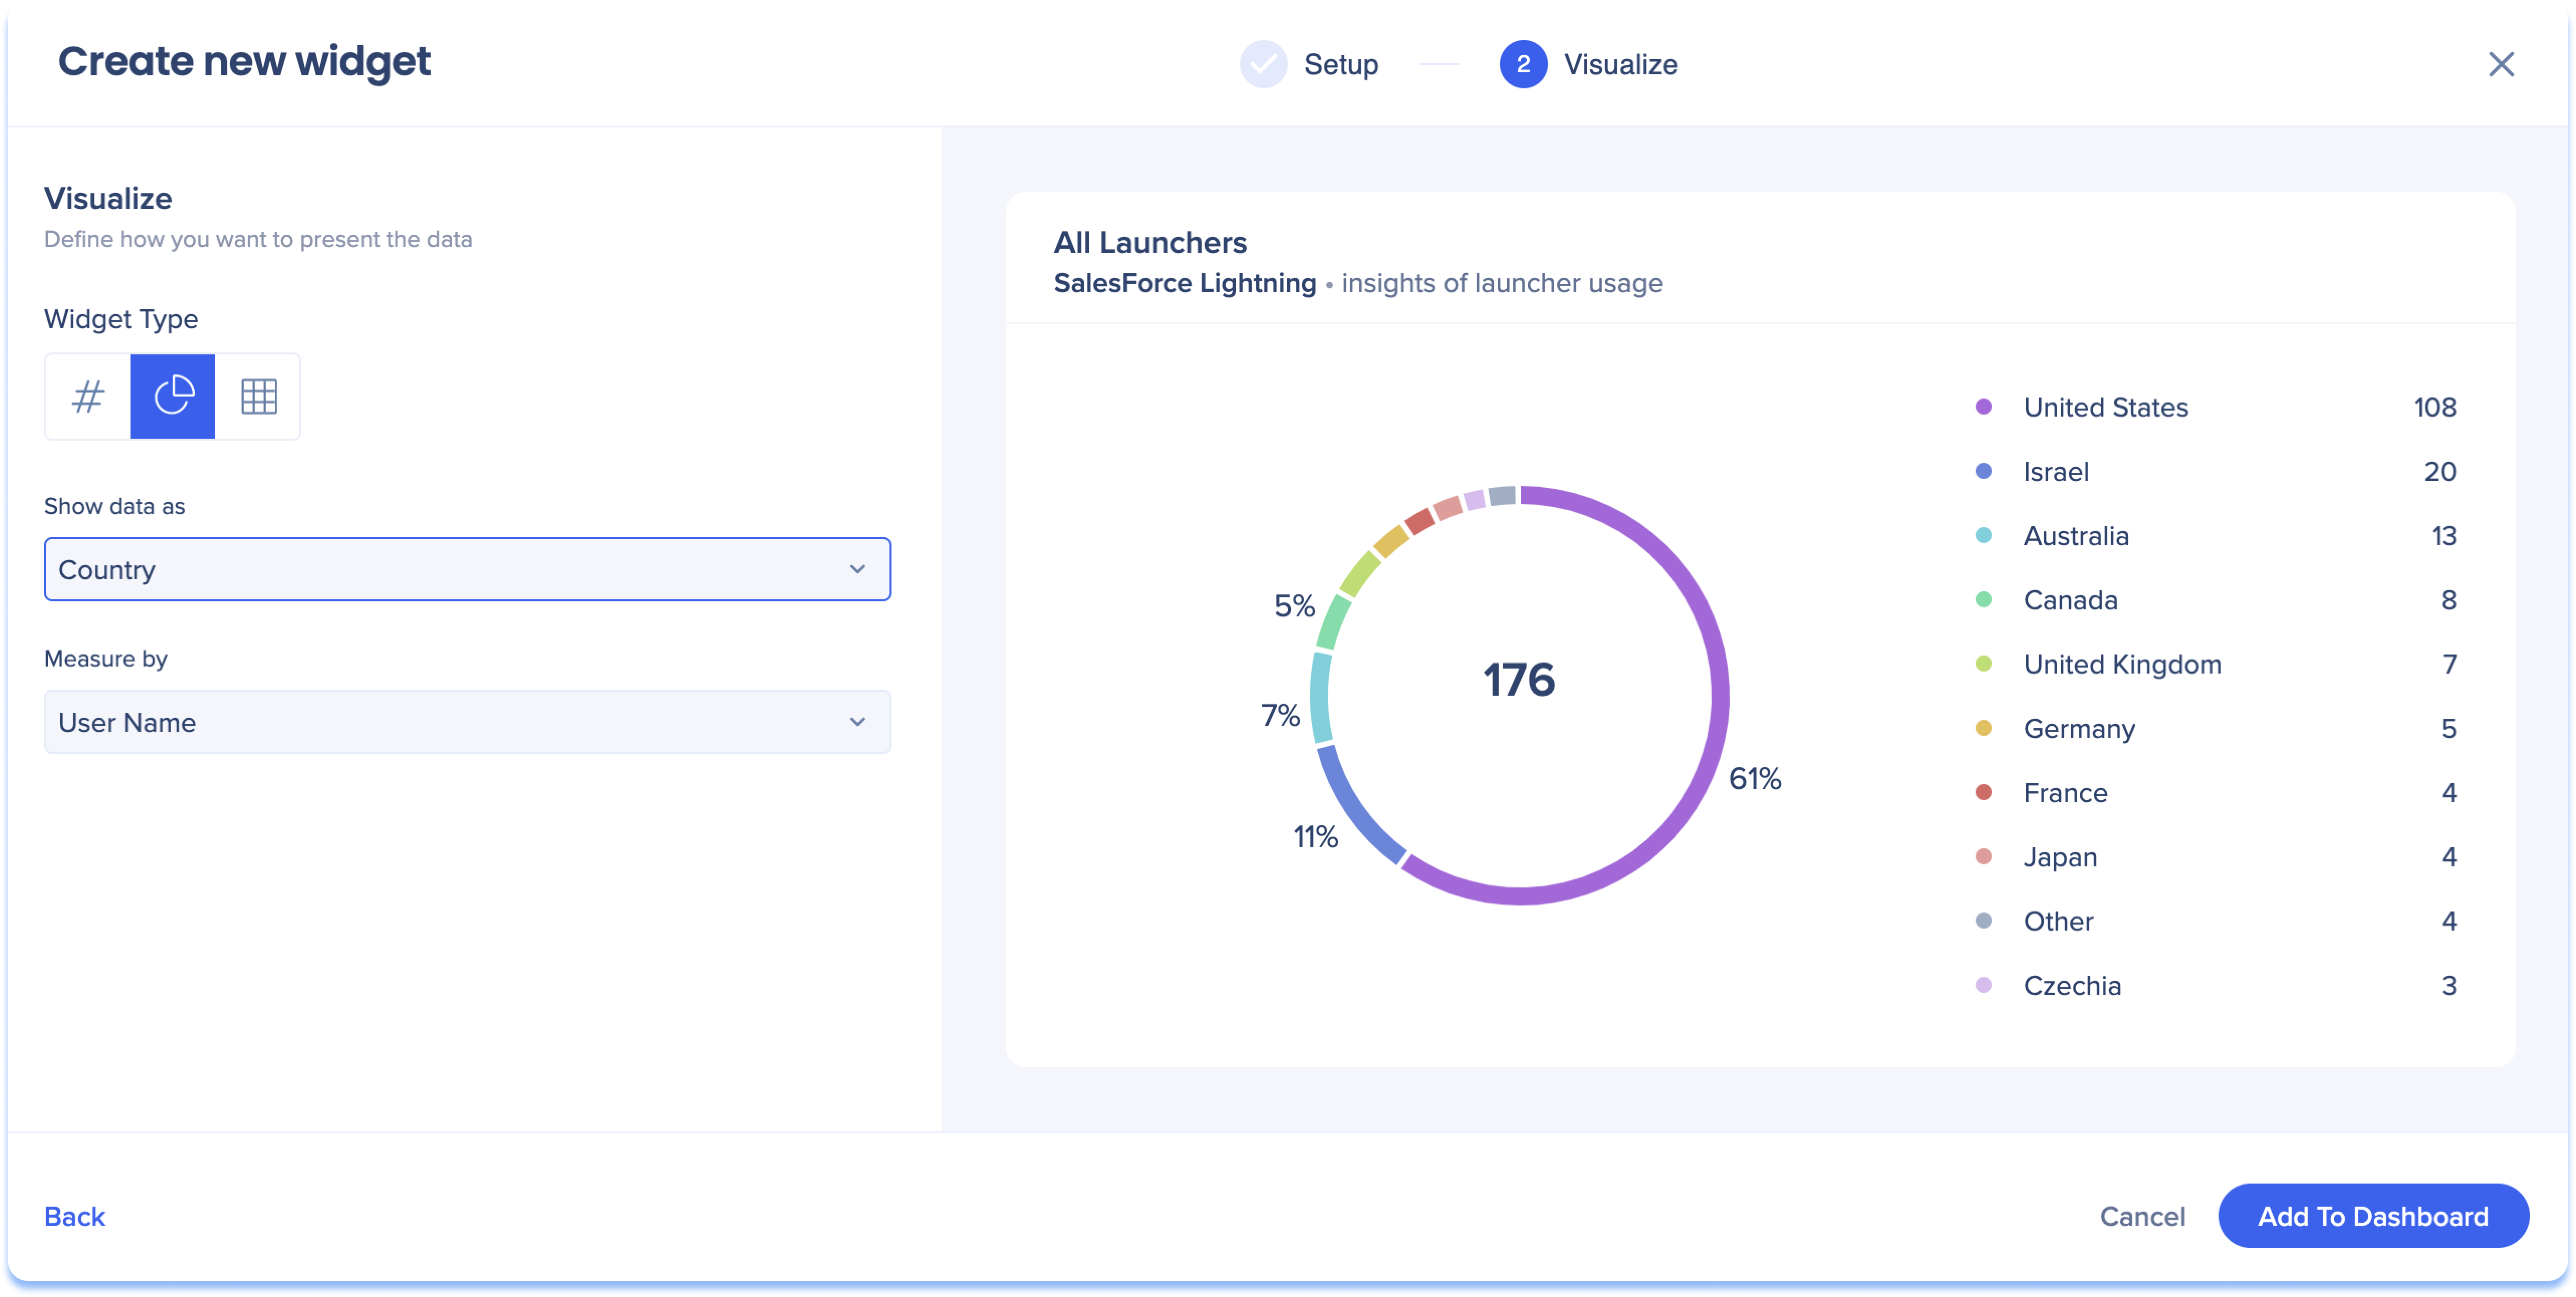
Pie Chart Example Scenario
Setup
Visualize
-
Widget type: Pie Chart
-
Show data as: Country
-
Measure by: User Name
Interpretation
Displays the number of unique users per country that clicked on a launcher from all of the available launchers in SalesForce Lightning
Table
Choose the table visualization method if you want to display lots of your data in a detailed format, where you can select to data columns and display the data as either measures or dimensions.
- Click Add Column to select add data columns to the table
About Dimensions & Measures
Dimensions and measures are different ways to display your data columns in the table.
- Dimensions: Display written values like usernames, email addresses, and locations, enabling analysis of textual information
- Measures: Display numerical values to count and measure your data
Example
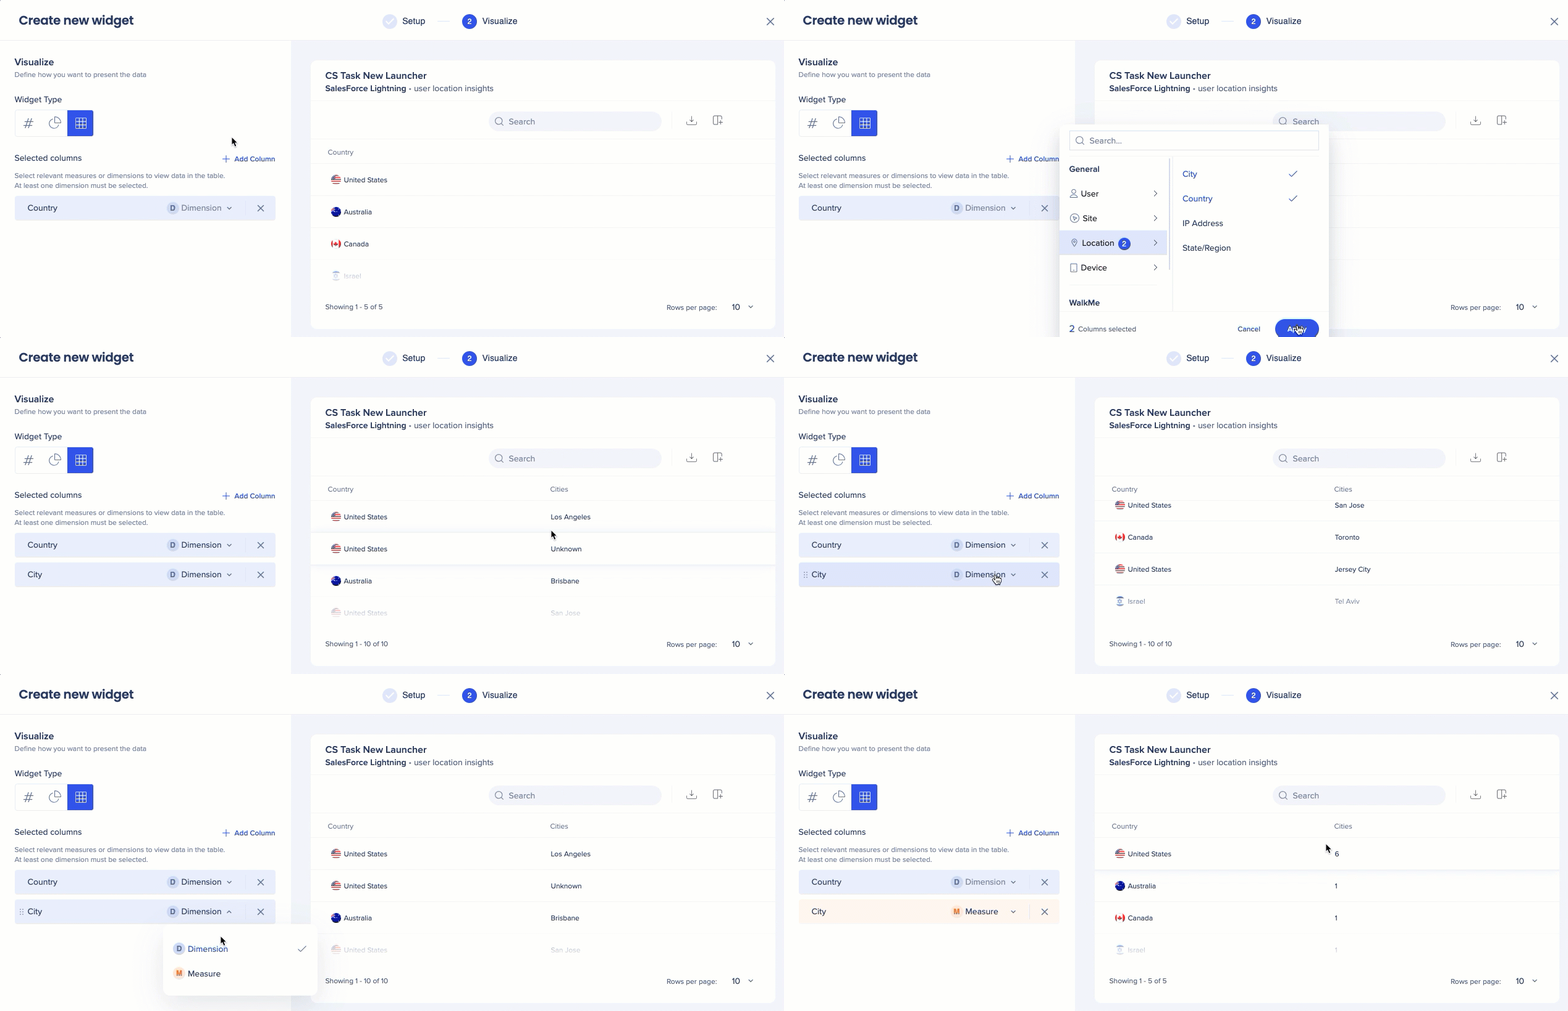
I want to view location insights for my “CS Task New” launcher in my Salesforce Lightning system. I can do this by adding 'Country' and 'City' columns.
- By setting the City column as a dimension, I can see a list of cities per country
- By setting it as a measure, I can see the number of cities per country
Note
At least one column must be shown as a text value in the table.
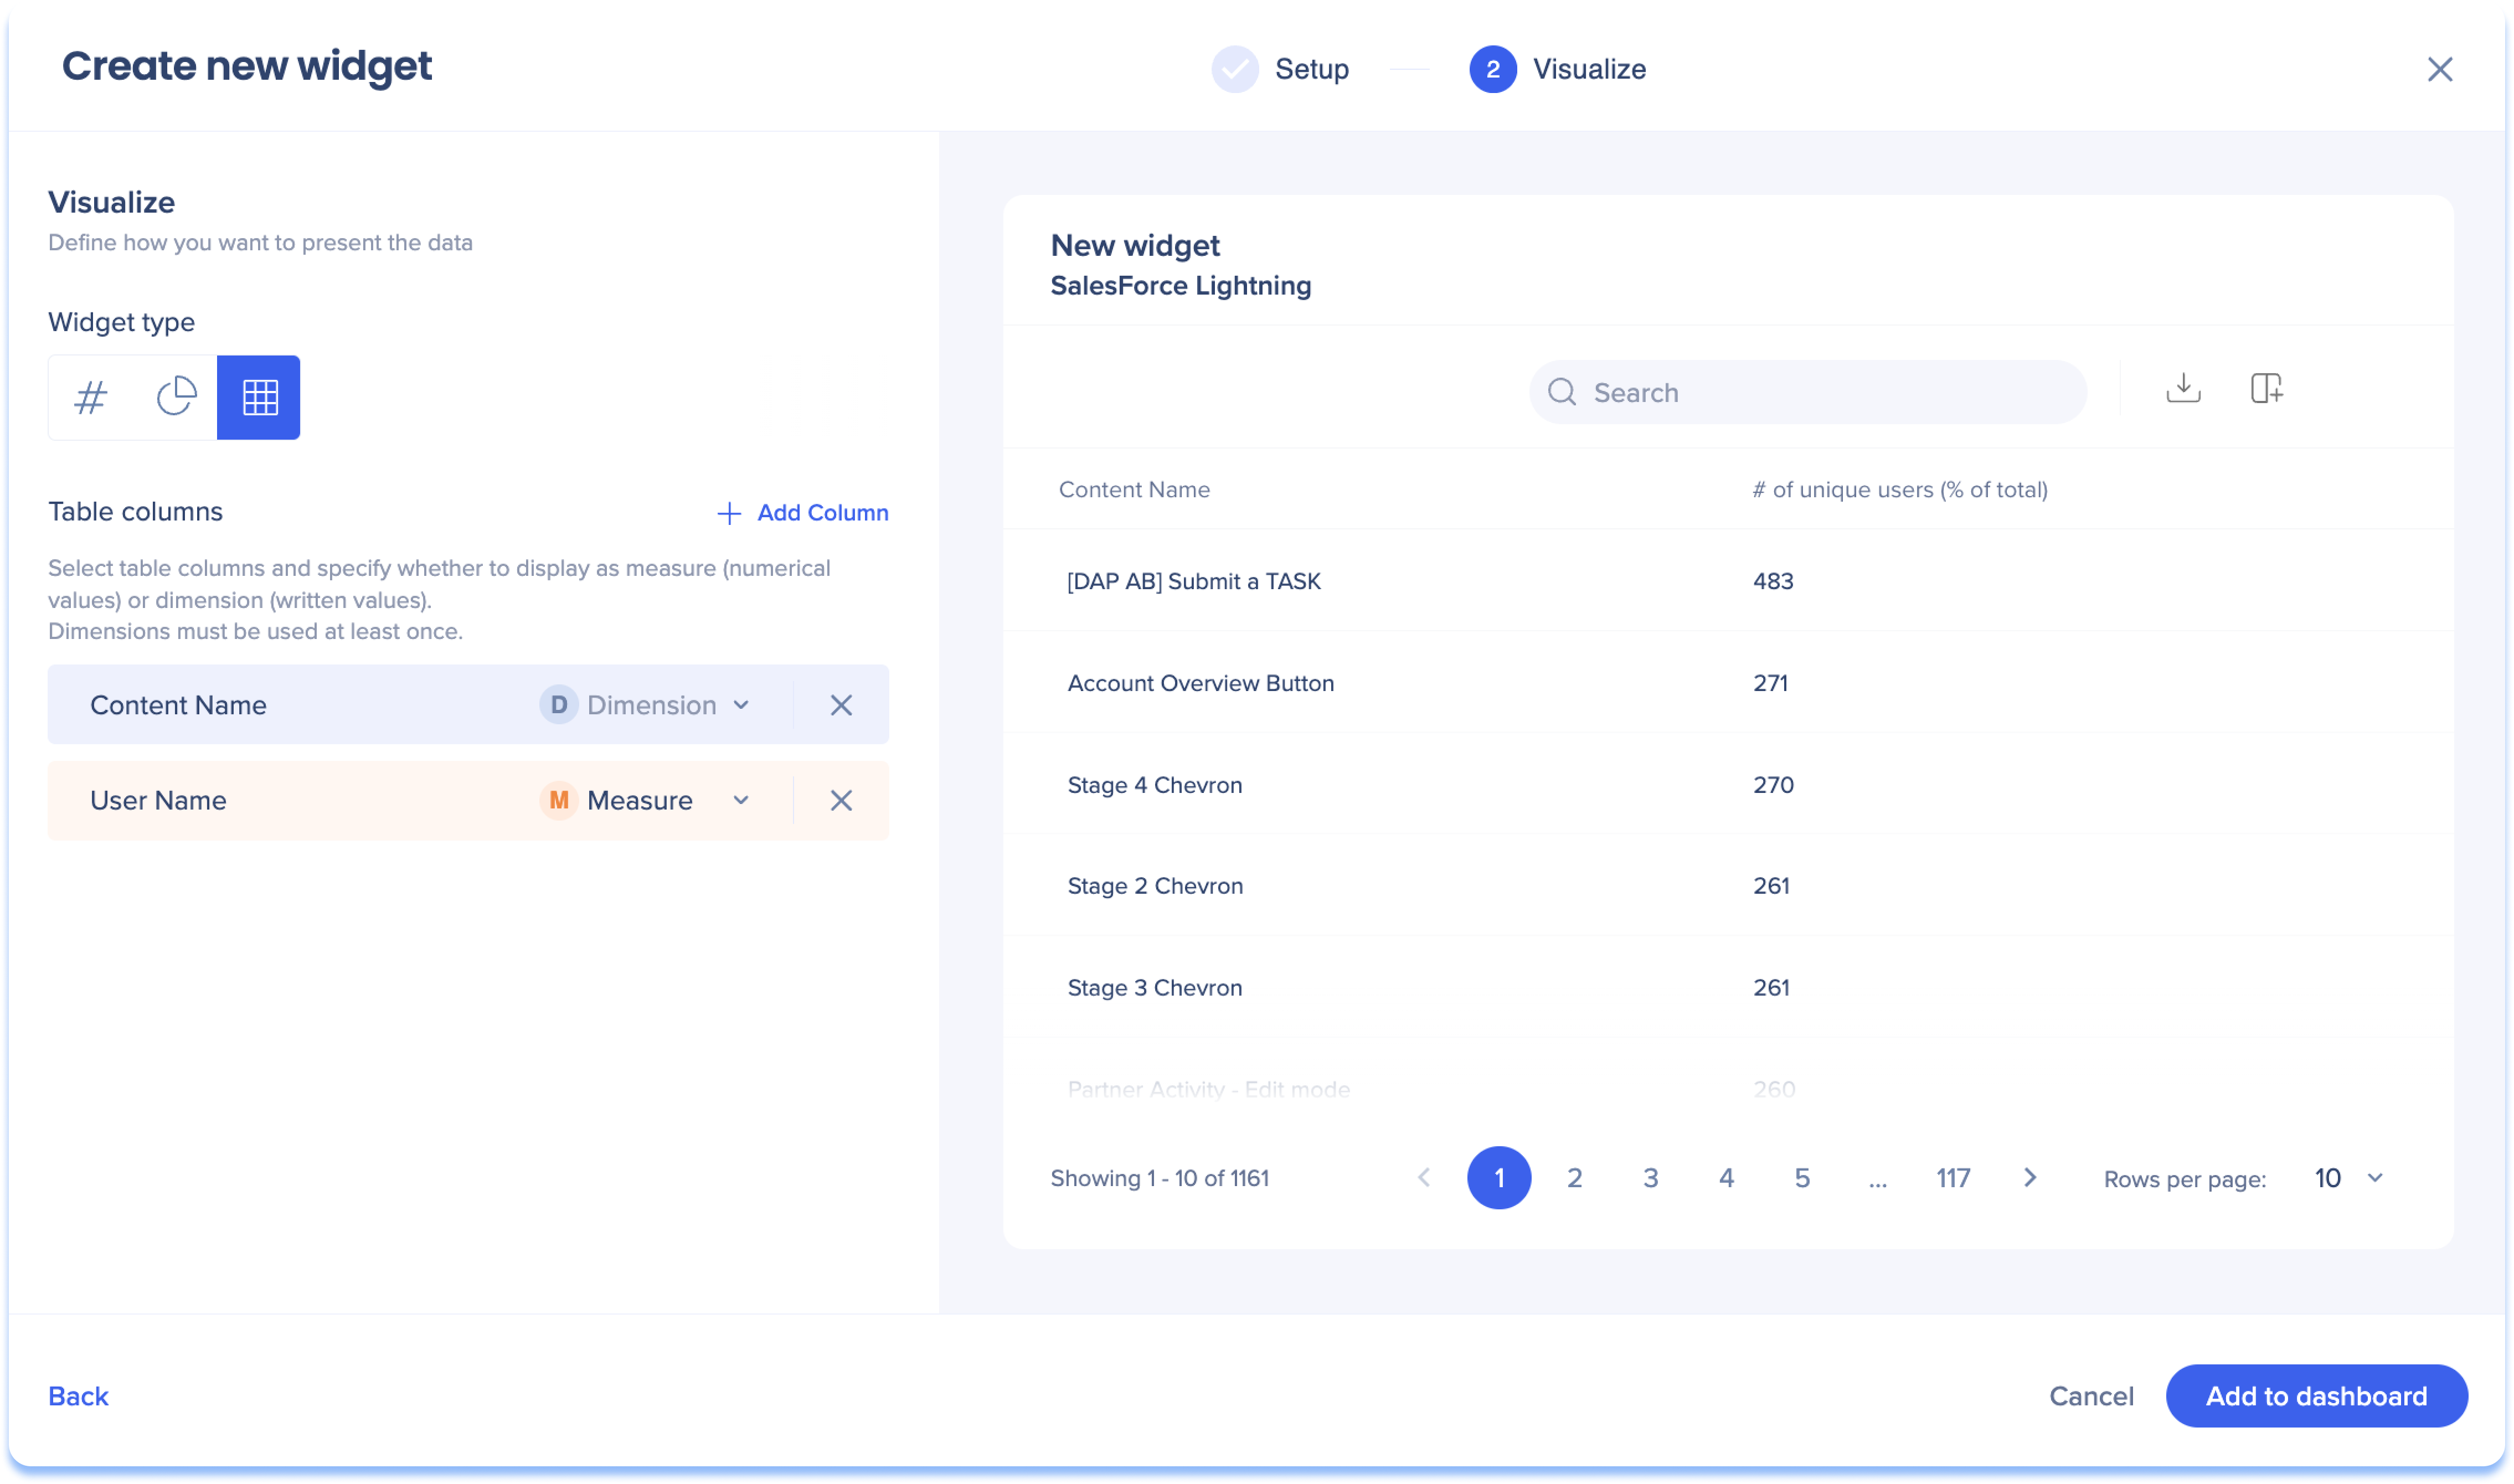
Table Example Scenario
Setup
Visualize
-
Widget type: Table
-
Columns & values:
-
Content Name - Text
-
User Name - Number
-
Country - Number
-
Browser - Number
Interpretation for one launcher on the table
The Change Stage Button launcher was clicked by 54 unique users from 9 countries, all using the same browser type.
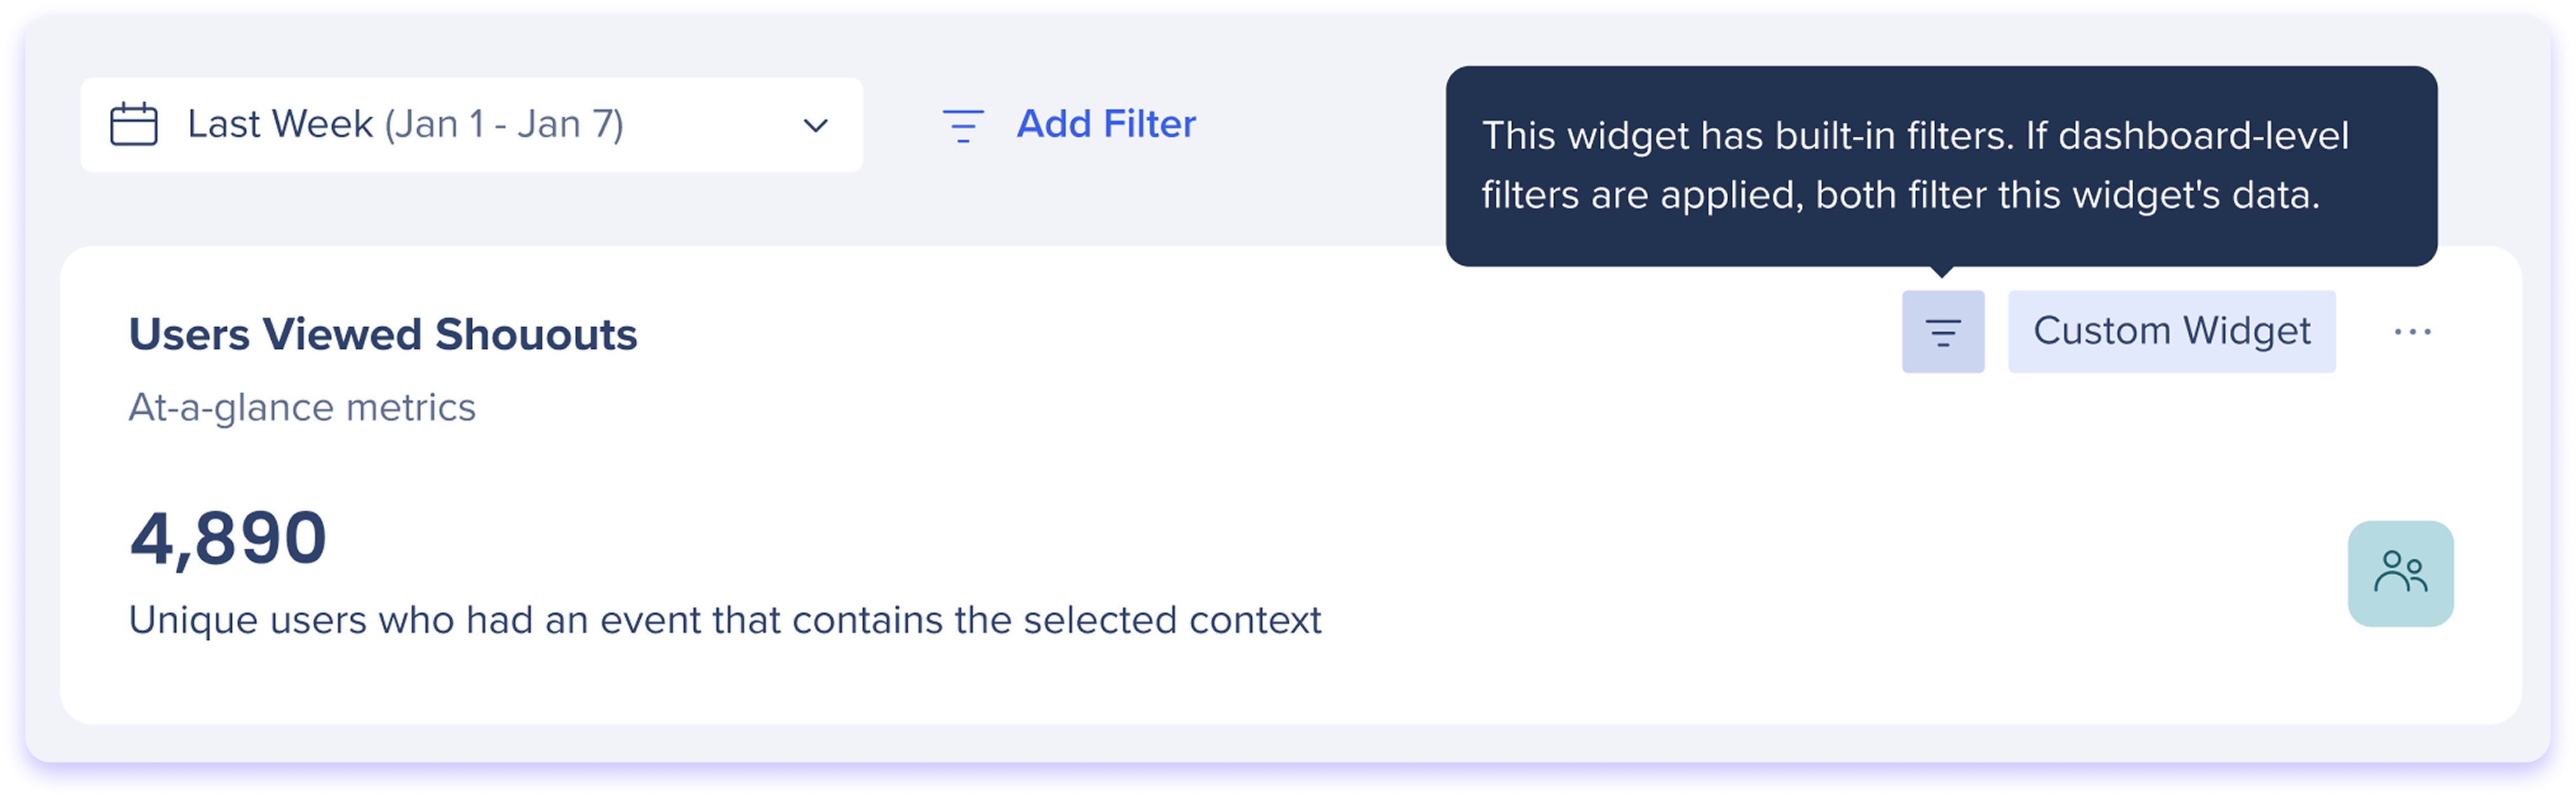
Dashboard-level filters apply to custom widgets alongside any widget-level filters set during the widget creation process.
If a custom widget has built-in filters, a filter icon will appear on the widget.
When both filter types are active, they are combined using the AND operator, meaning only data that satisfies both sets of conditions will be returned.
Example
Example
-
Dashboard Filter: Department = 'Marketing'
-
Widget Filter: Country = 'Israel'
-
Result: Only users from Israel whose department is Marketing
Note
If the two filters conflict (for example, Dashboard Filter: Country = 'Australia' and Widget Filter: Country = 'Israel'), the widget will return 0 results, since an event can only have a single country value.
Technical Notes
Known Issues
Related Articles
Custom Dashboards — now includes dashboard sharing & permissions