Brief Overview
The Surveys Overview page serves as a centralized hub for analyzing survey performance across your account. It provides both high-level engagement metrics and detailed survey-specific insights. This helps you understand user interactions with surveys, whether they are linked to specific systems or shared as full-page experiences. It helps optimize survey effectiveness and provides a comprehensive view of user engagement.
- Key functionalities include:
- Viewing total survey views and submissions.
- Tracking survey activity by system or over time.
- Drilling down to user-level insights for each survey.
- Identifying the most visible and most responded-to surveys.
- Overall, this page enhances your ability to monitor and improve survey performance effectively.
Access
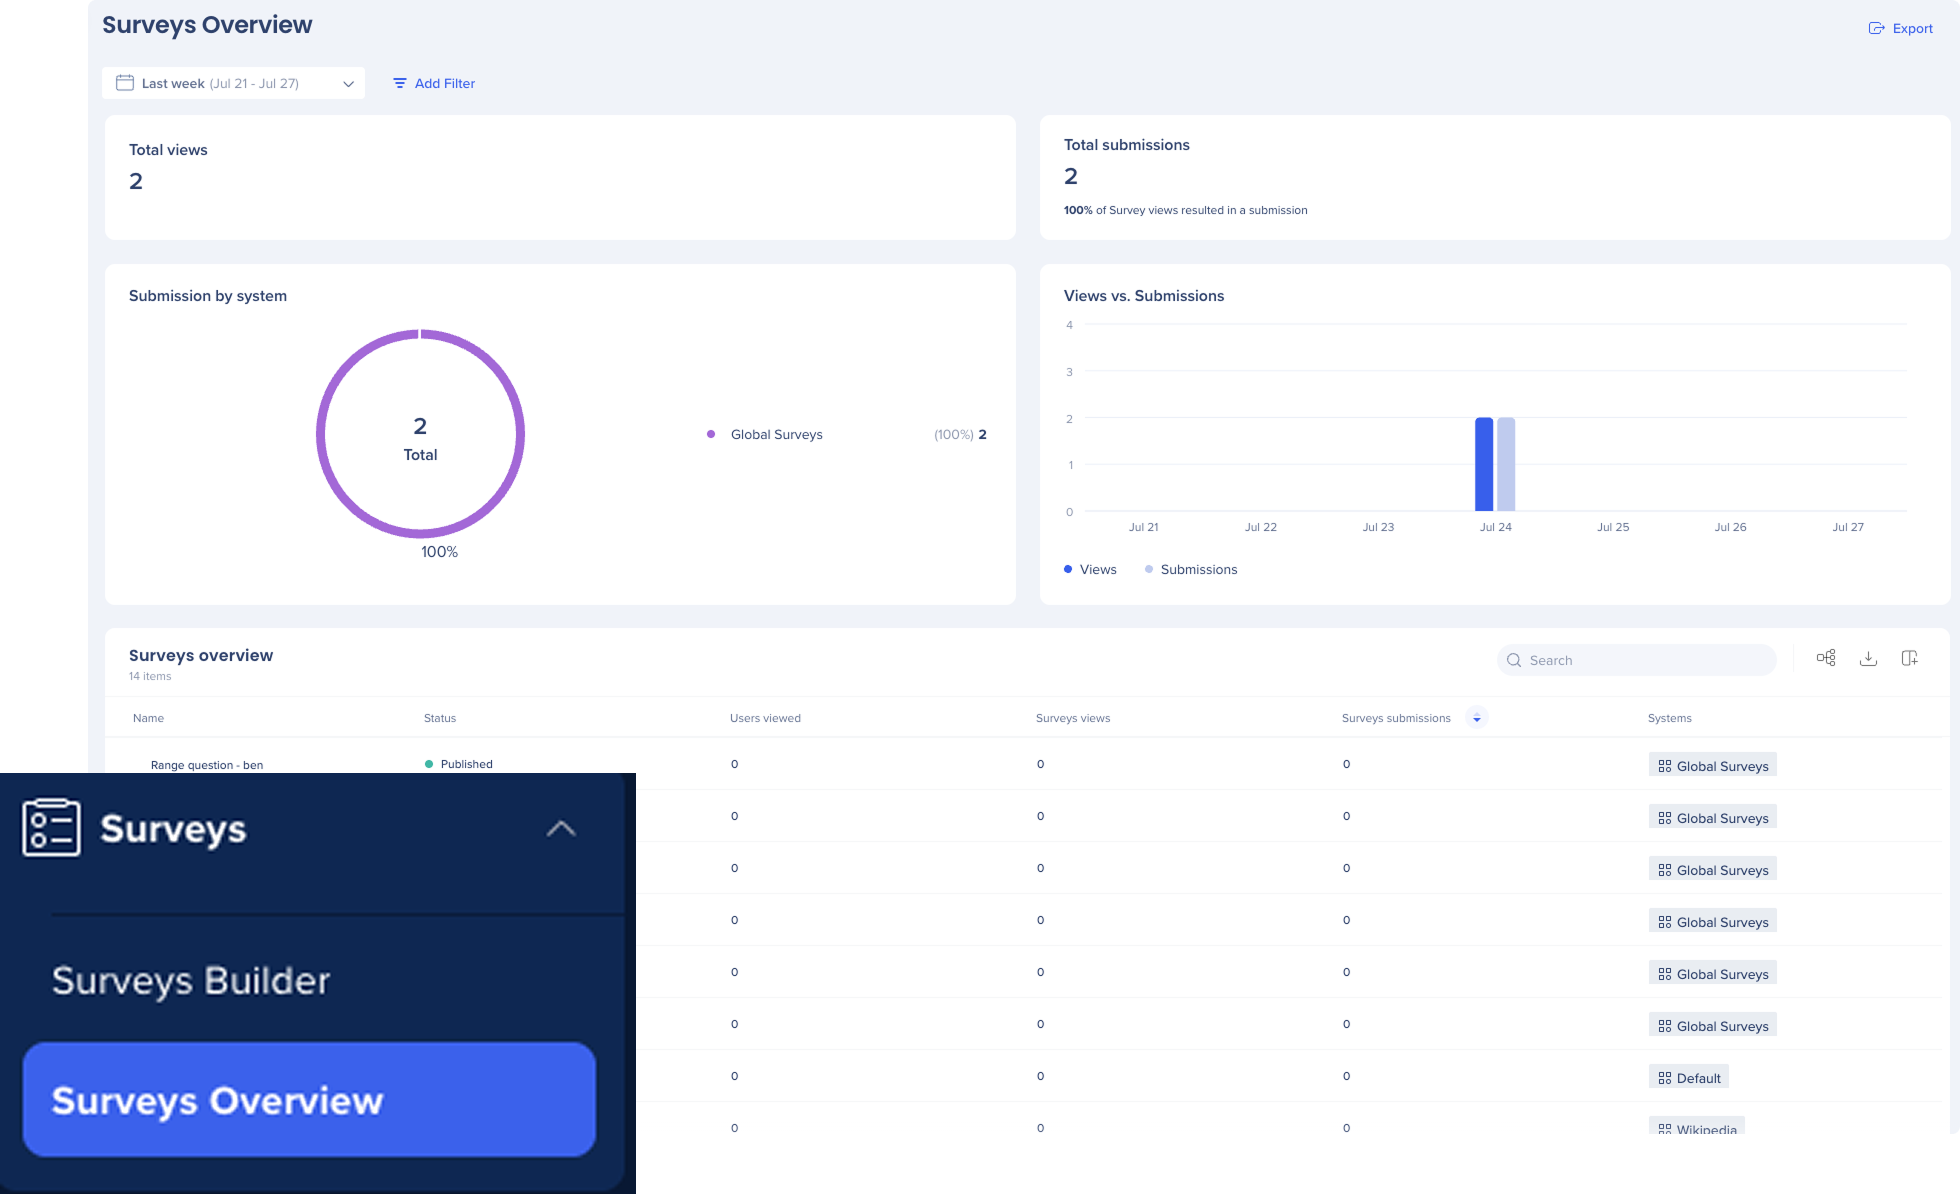
To access Surveys overview, navigate to the Surveys app in WalkMe console:
How It Works
Surveys overview page
The surveys overview page is divided into two sections:
-
Dashboard-level metrics: Survey activity across all systems
-
Survey table: Individual survey performance
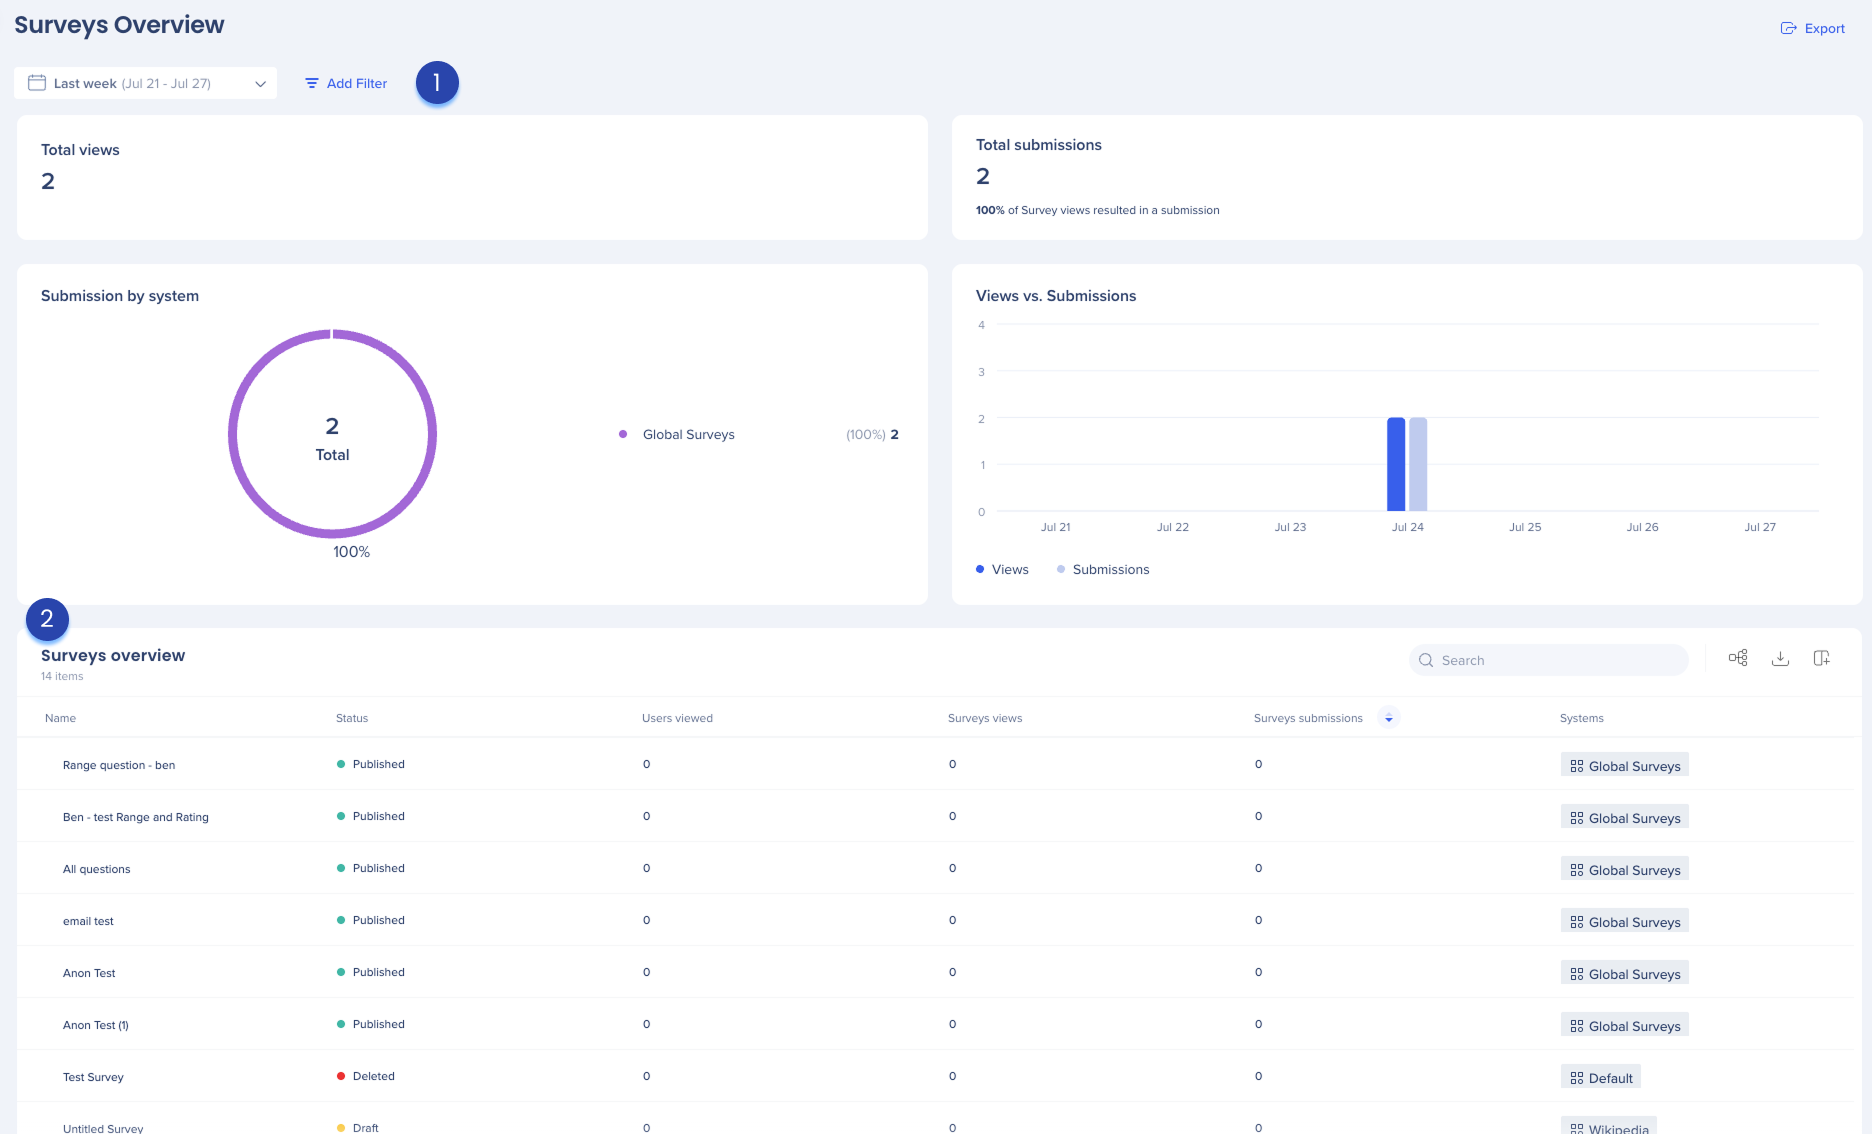
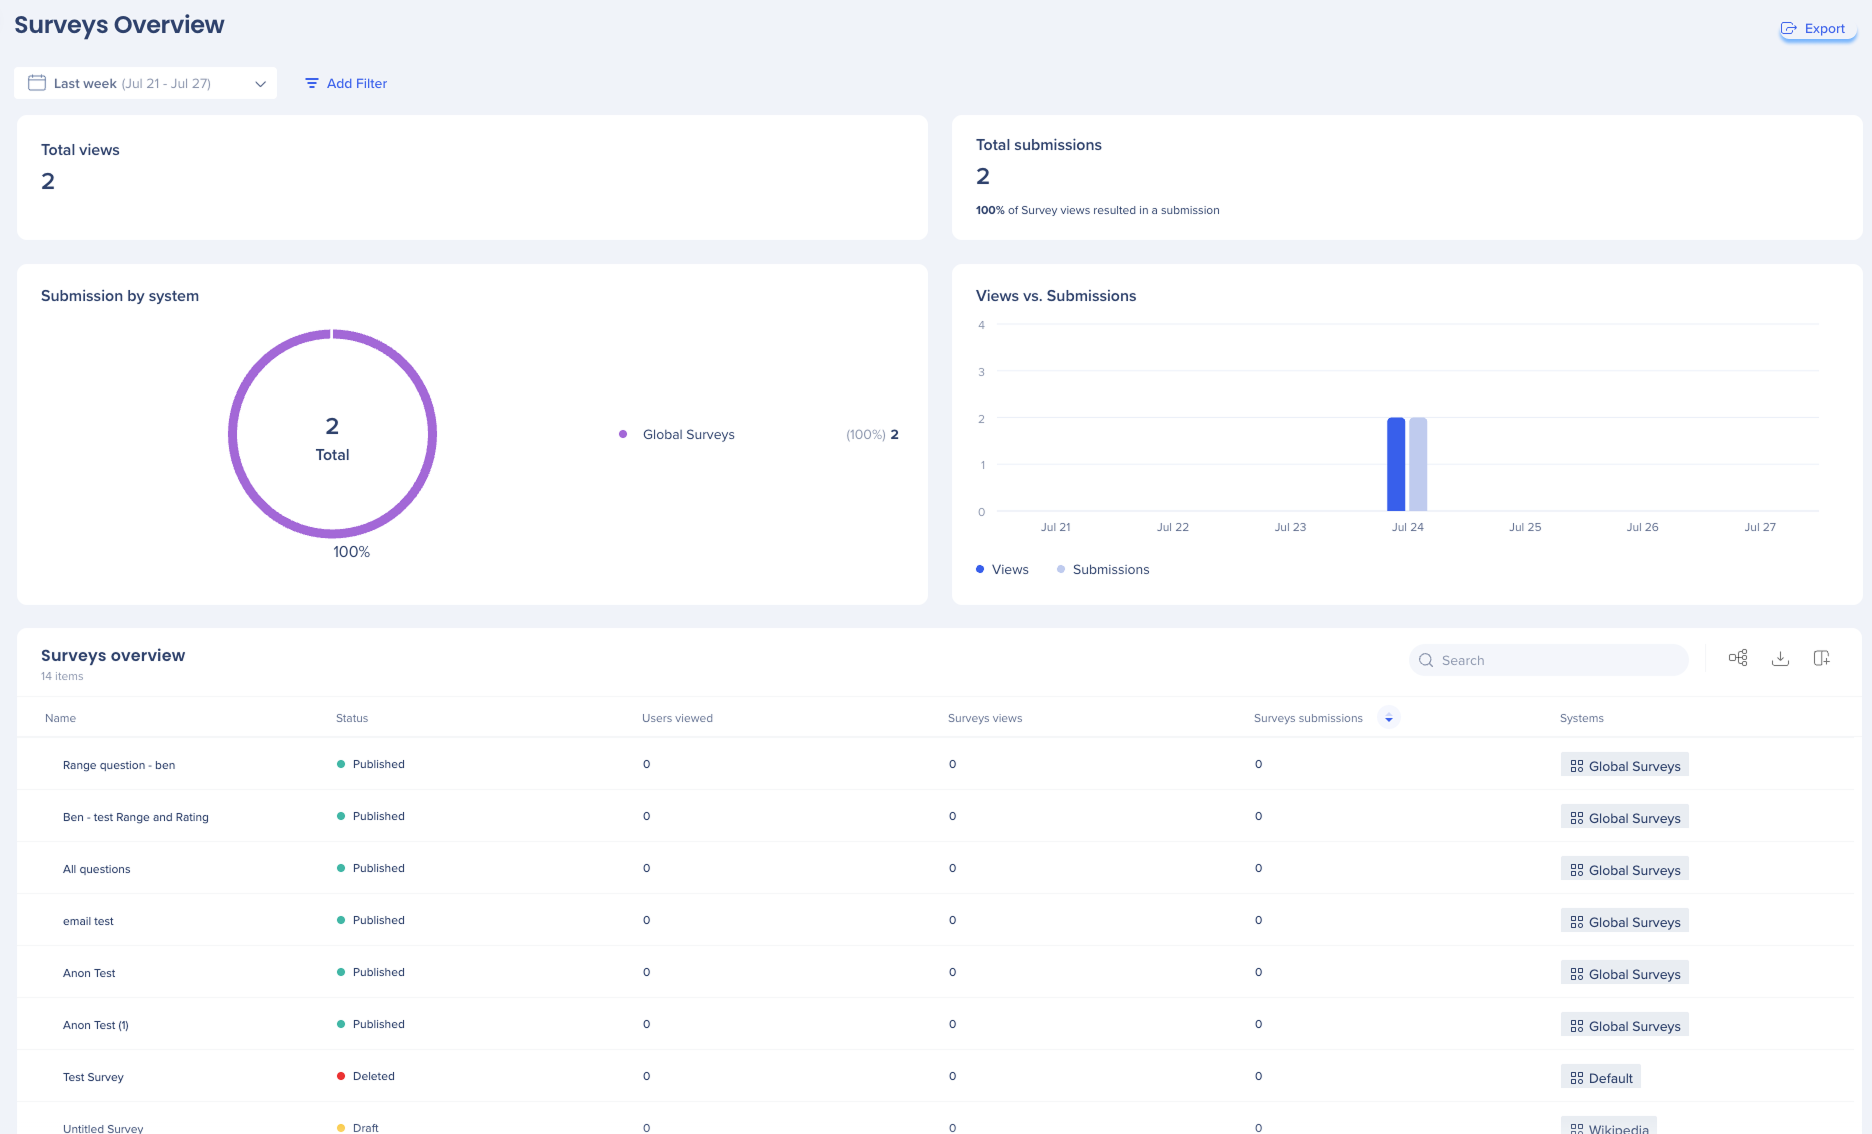
1. Dashboard-level metrics
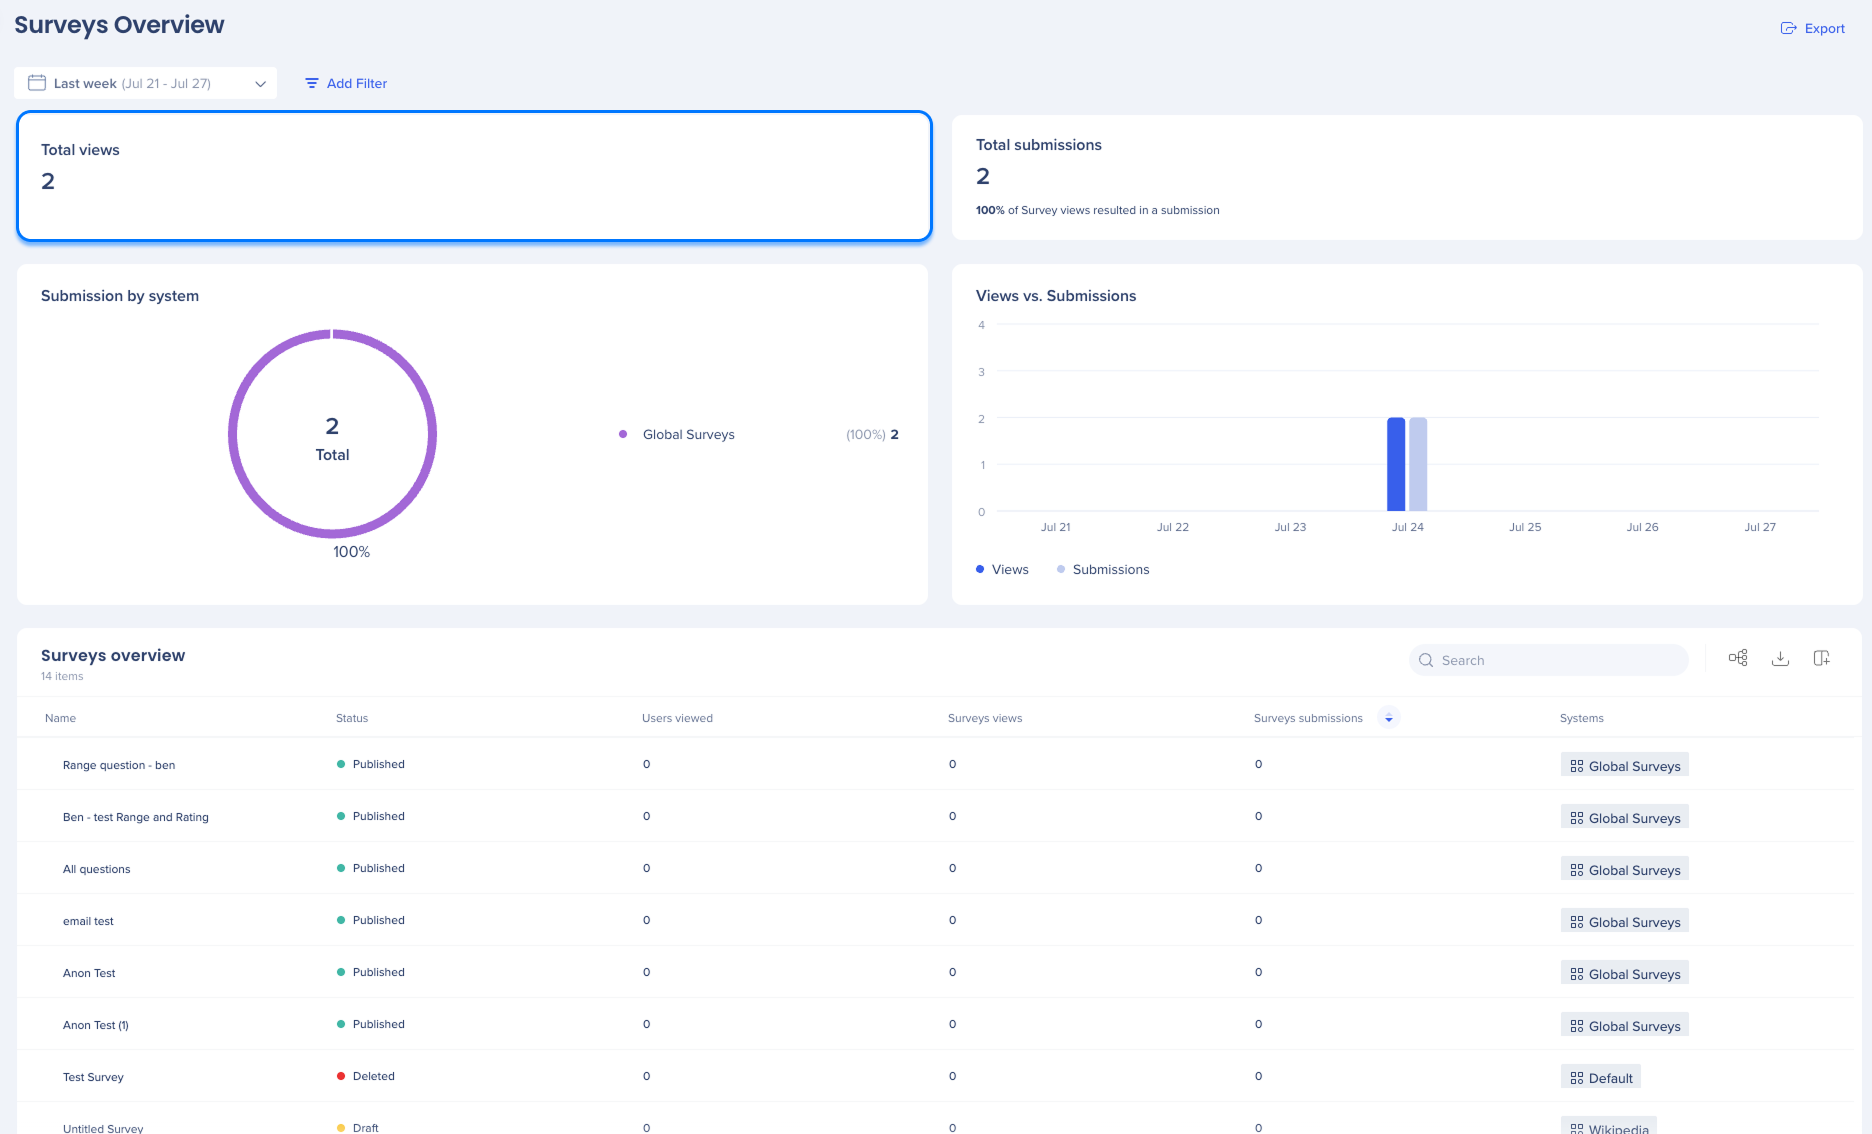
Total views
The total number of times any survey was viewed across all systems within the selected date range. This includes repeat views.
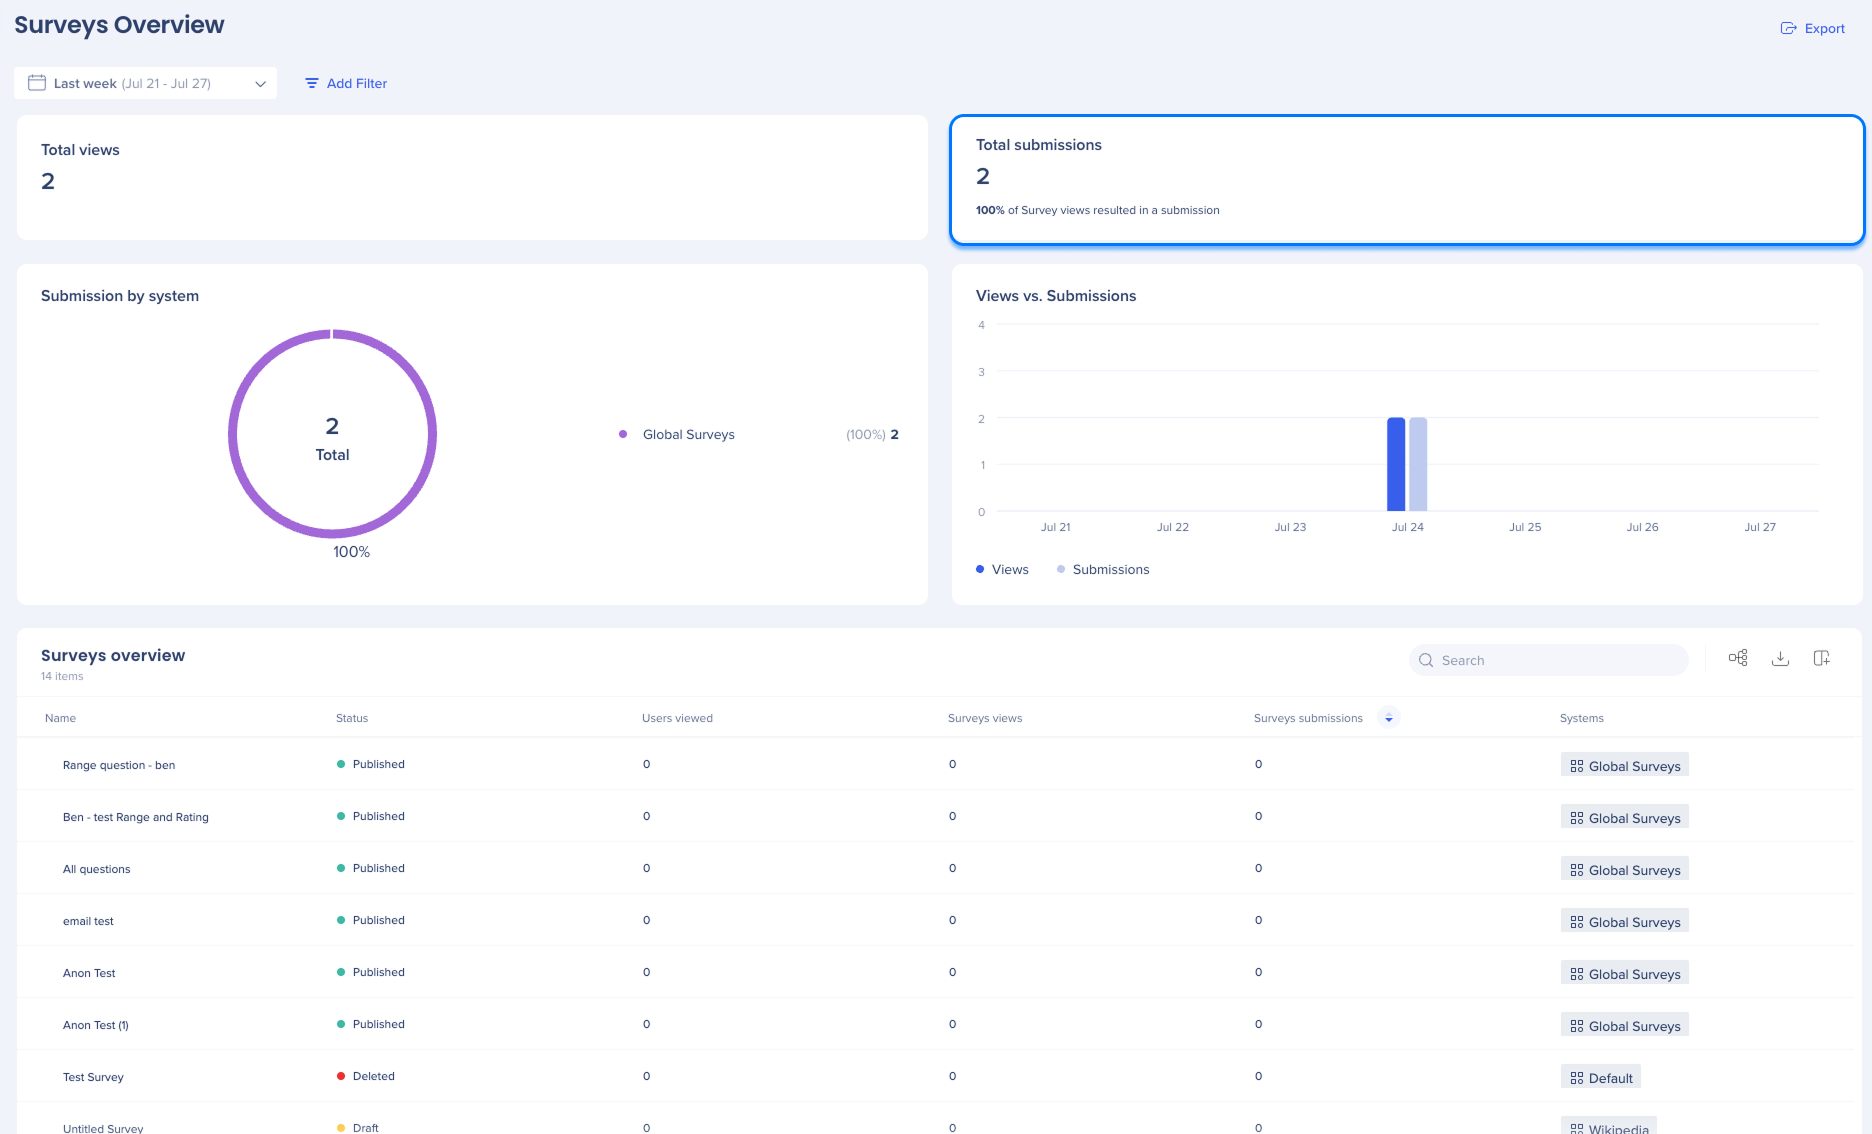
Total submissions
The number of submitted surveys across all systems. Also includes a conversion percentage indicating how many views resulted in a submission.
Submission by systems
A circular chart that visualizes which systems received the most submissions. The top 10 systems are shown, helping you understand which platforms drive the most engagement.
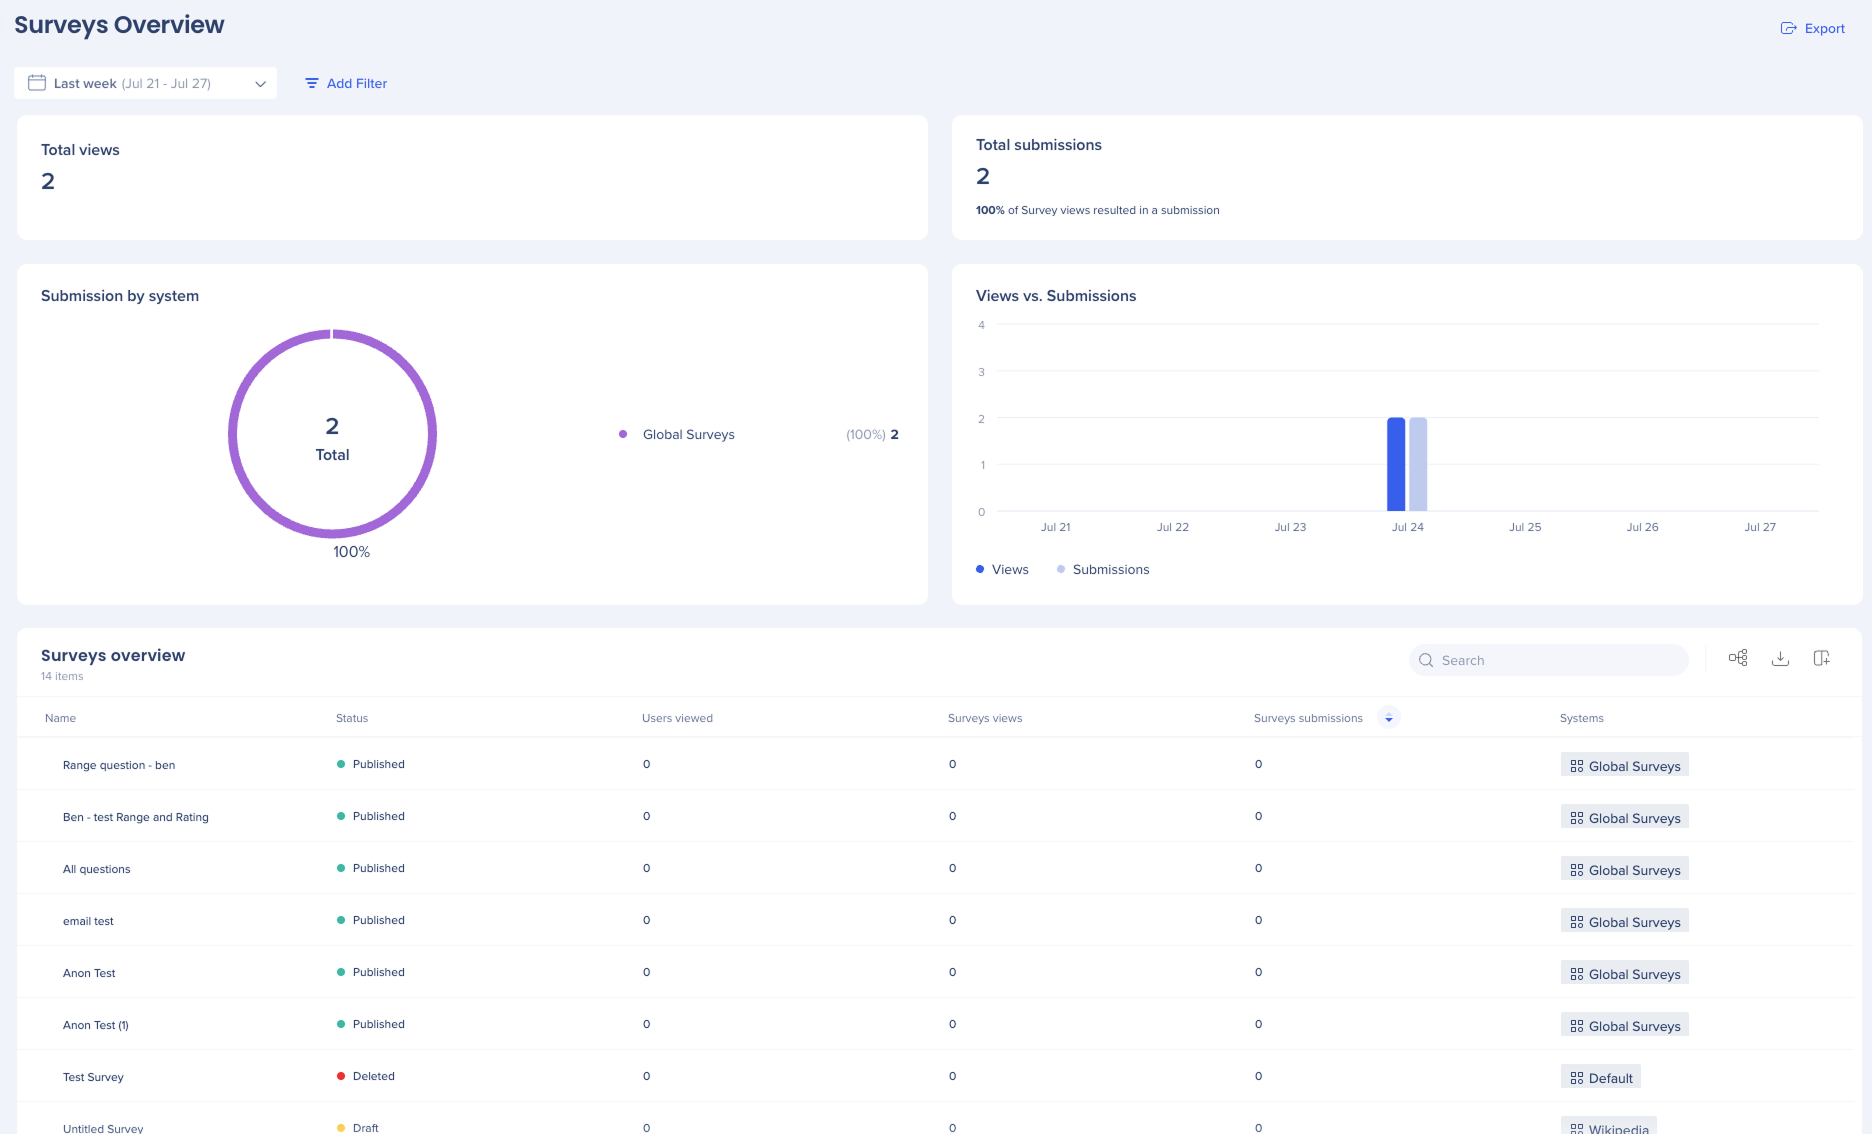
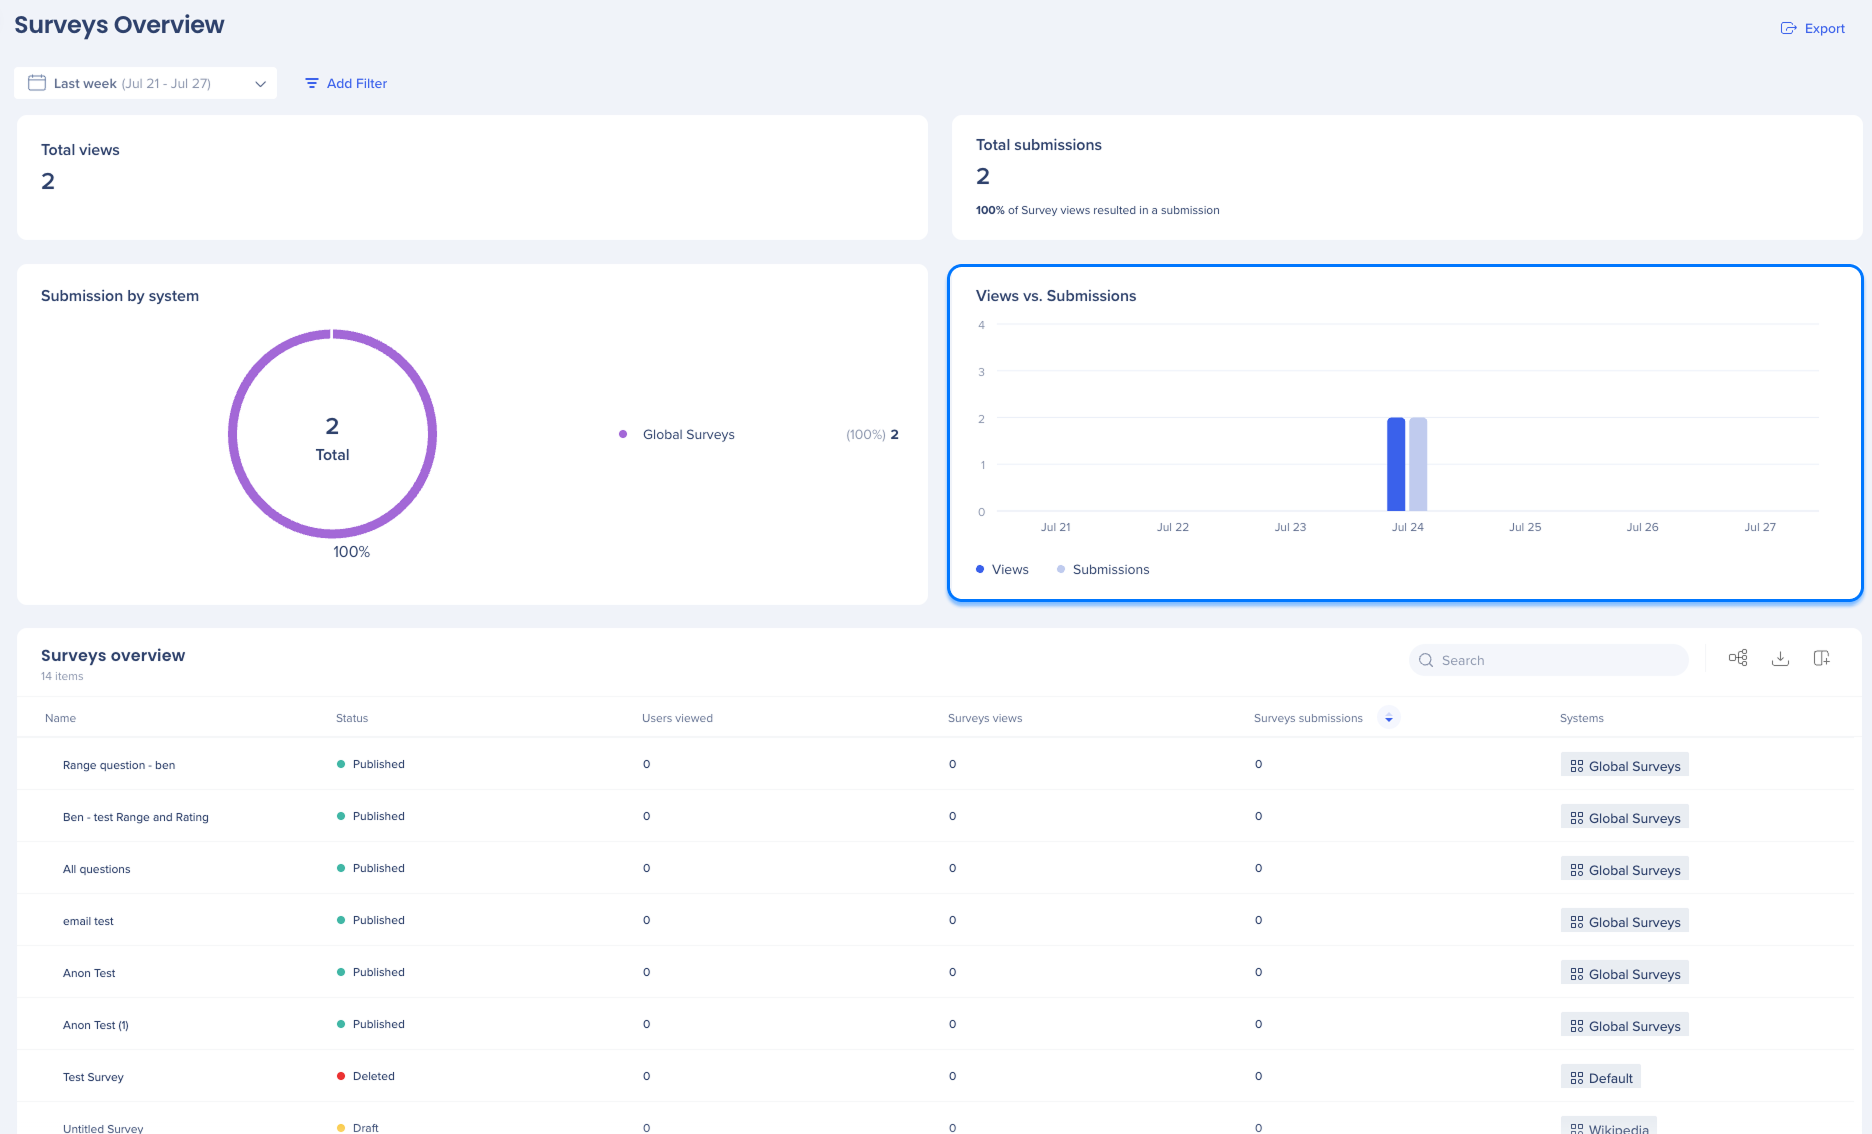
Views vs. Submissions
A time-based chart showing trends in survey views and submissions. The chart updates based on the selected time range. Useful for spotting spikes or dips in survey activity.
Additional features
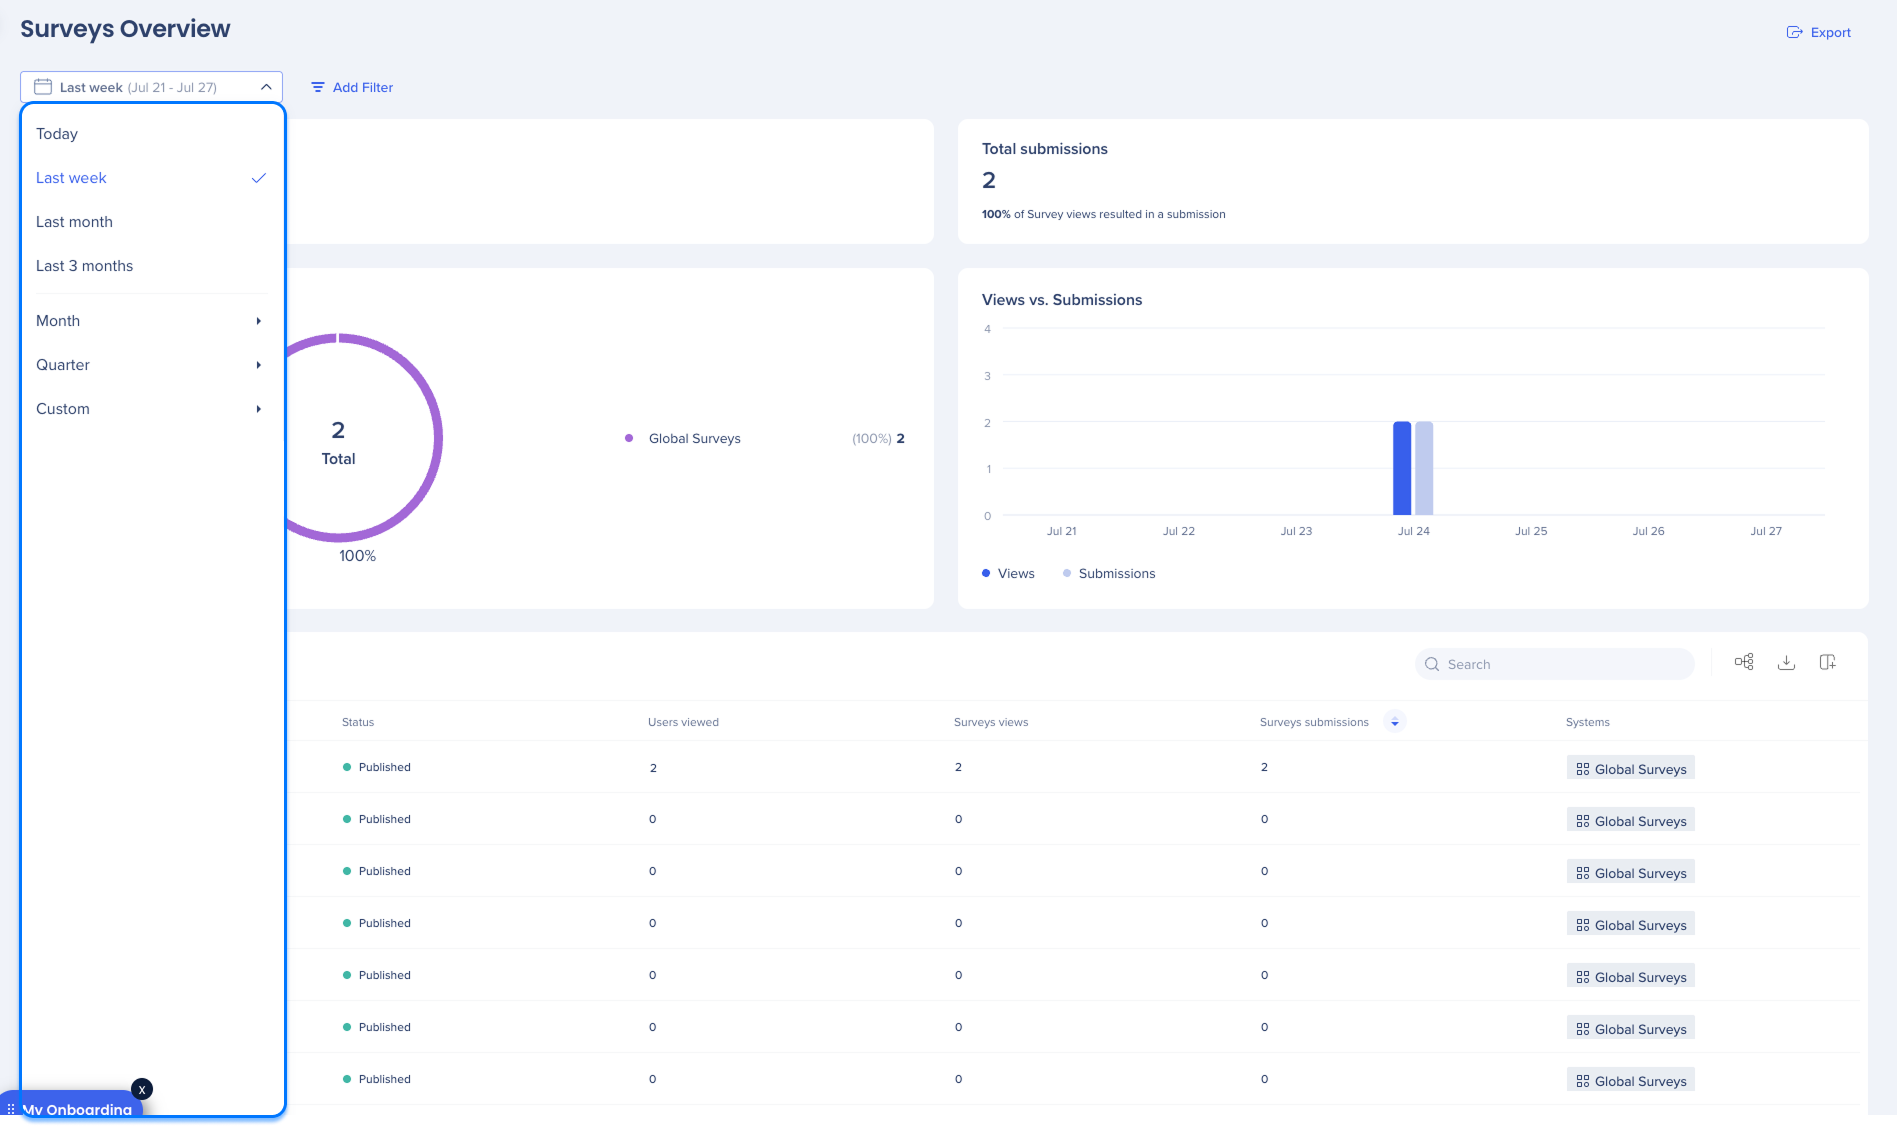
Date filters
The dashboard filters enables users to view and analyze a smaller part of your data set.
Users have the following filter options:
-
Today: This filter shows data from the current day
-
Last week: This filter shows data from the previous day
-
Last month: This filter shows data for the previous month
-
Last three months: This filter shows data for the last three months
-
Month: This filter shows data from the selected month and year
-
Quarter: This filter shows data from the selected quarter and year
-
Custom: This filter allows you to select a custom date range to view data
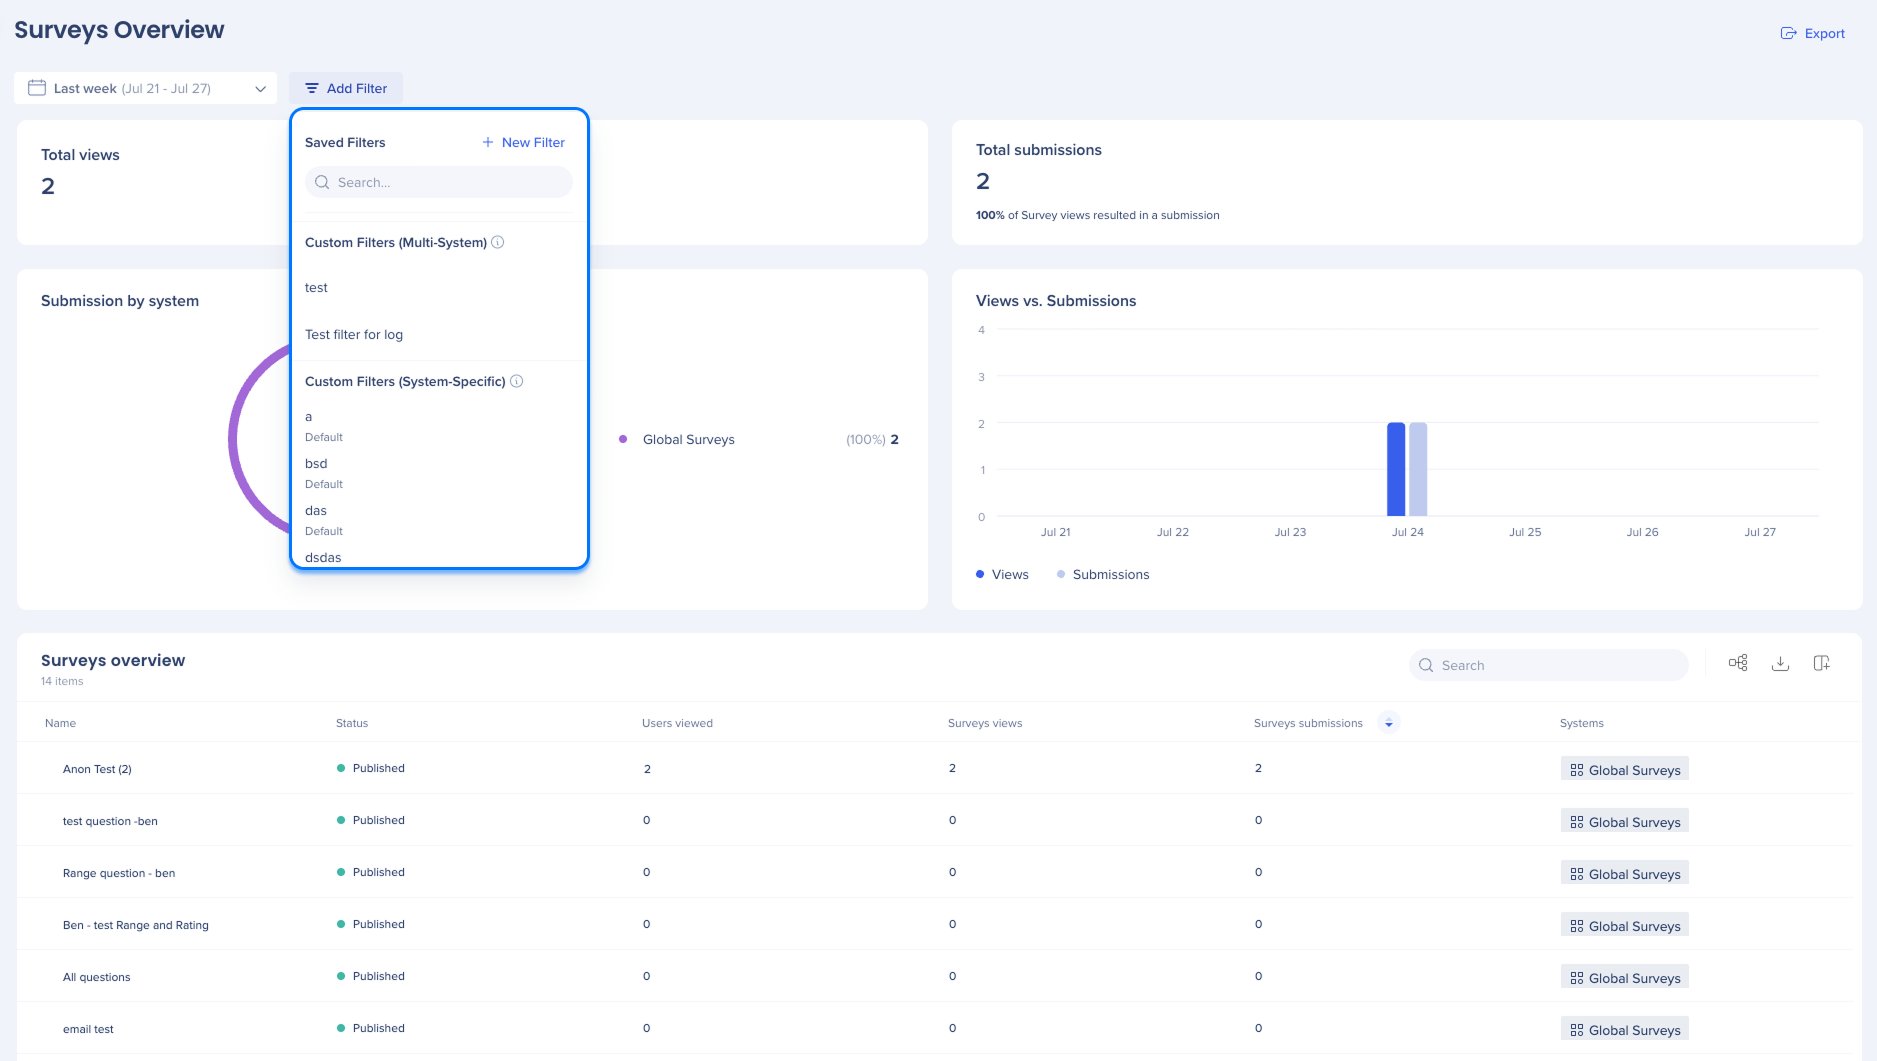
Add filters
Use the Add Filters feature to streamline your search and find information faster.
Data Filtering
Export
-
Click the Export button to download a PNG file
2. Survey table
The survey table provides a detailed breakdown of how each individual survey is performing across your account.
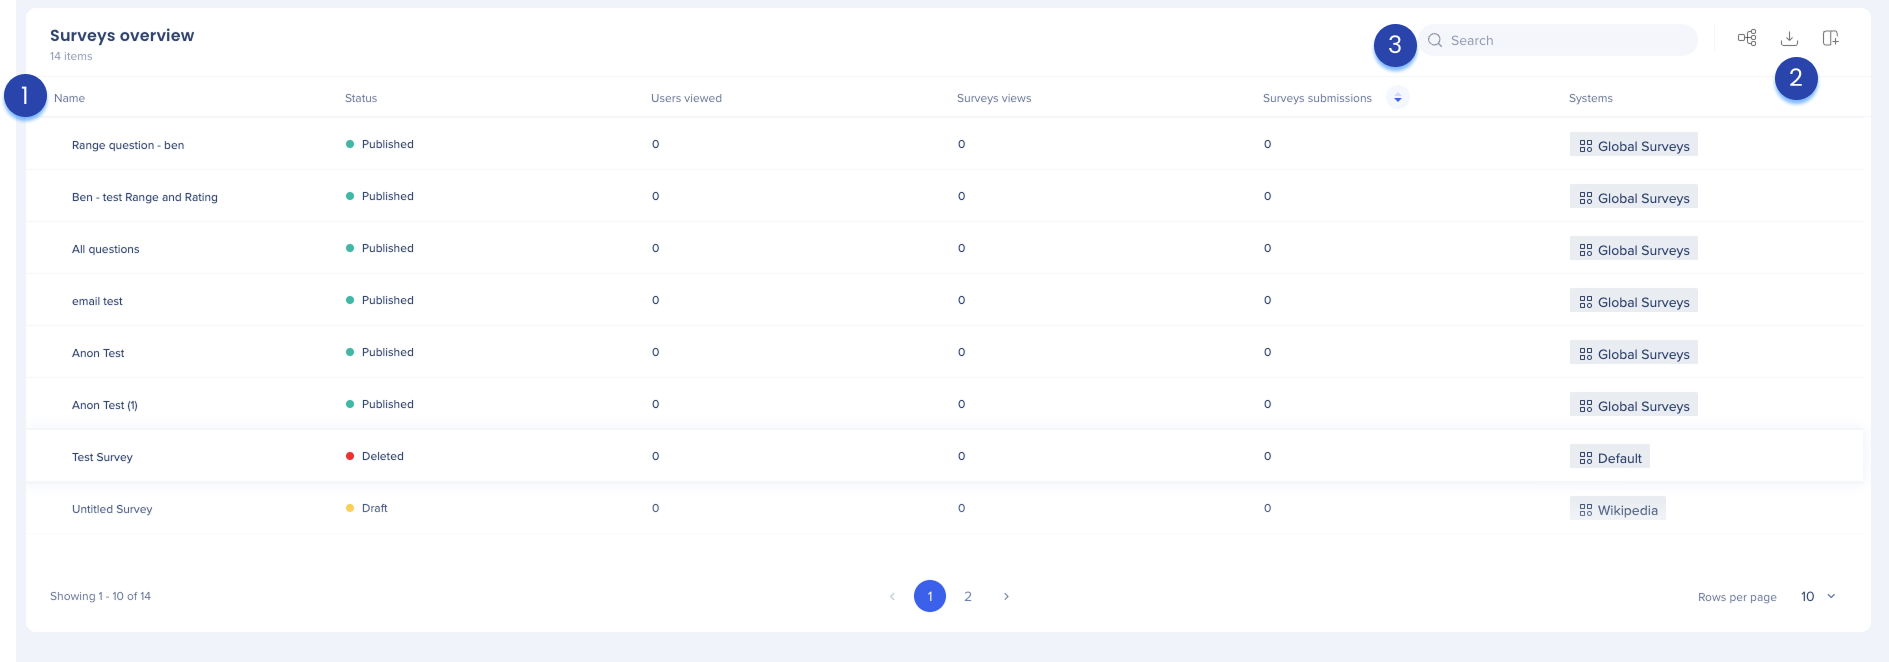
1. Table columns
-
Name: The name of the survey
-
Status: Indicates whether the survey is published, a draft, or deleted
-
Users viewed: The number of unique users who viewed the survey, regardless of whether they submitted a response
-
Survey views: The total number of times the survey was shown. This count includes repeat views from the same user.
-
Survey submissions: The total number of completed responses submitted for the survey.
-
Systems: The system the survey is associated with
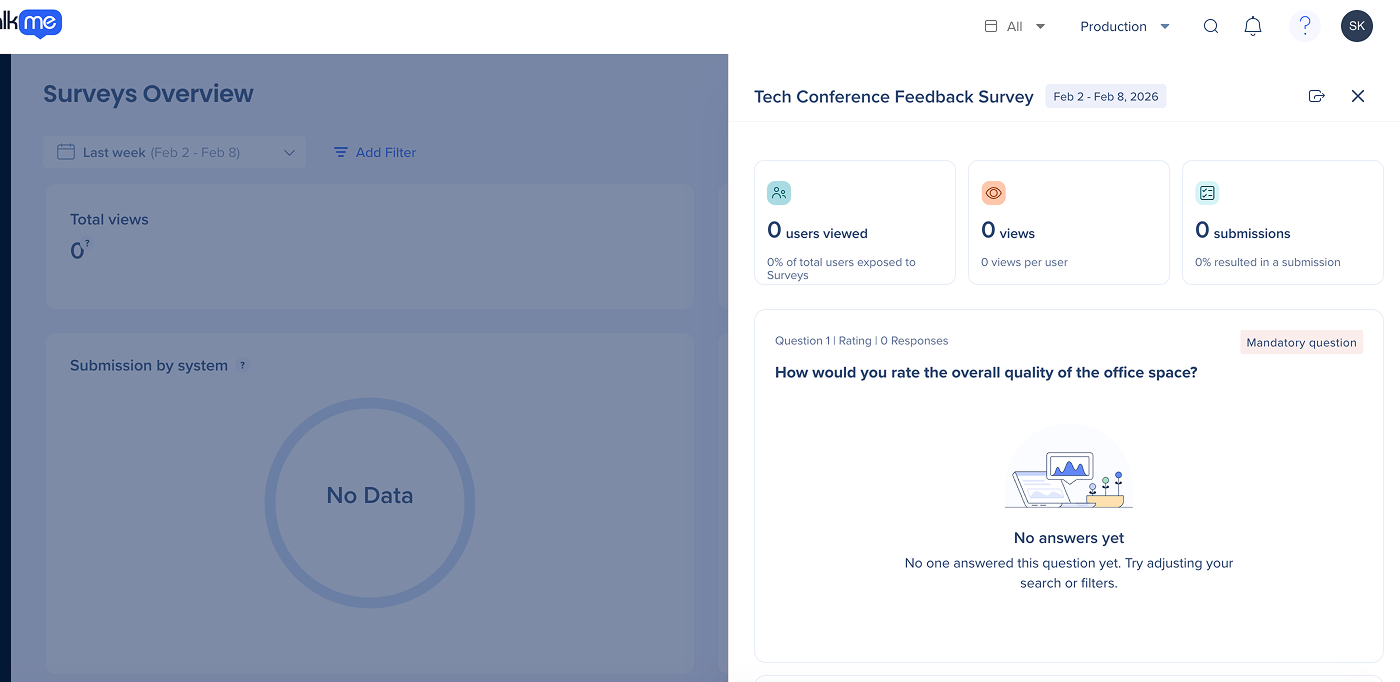
Individual survey panel
Selecting a survey name opens a side panel with specific insights for that item. This allows you to review survey-level details.
From the side panel, you can:
- Review metrics for the selected survey
- View survey questions and an overview of responses
- Export as report
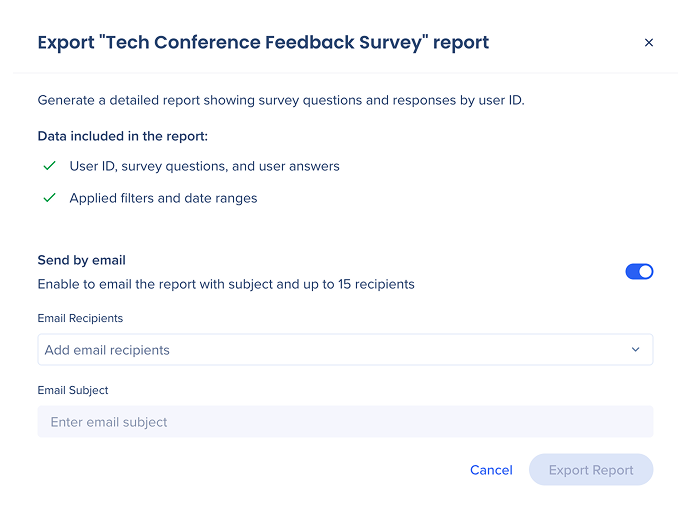
Export as report
You can generate a detailed report of survey questions and responses from users.
How to export a survey report:
- In the side panel, select Export as report
- To email the report, turn on Send by email (optional)
- Email Subject: Enter a subject line
- Recipients: Enter up to 15 email addresses
- Select Export Report
Data included in the report
- User ID, survey questions, and user answers
- Applied filters and date ranges
2. Table icons
Manage Columns
Remove or add columns from the table
- Click the Manage columns icon
- Select which columns you'd like to have in the table
- Click Apply
Group by Column
You can group columns by values
- Click the Group by Column icon to organize the table by a specific value
- This collapses the data into a group folder that can be expanded to view the data, making it easier to organize and view your data
Export
- Click the Export icon to download the file to either:
- CSV
- XLSX
3. Search bar
- Use the Search bar to quickly find the survey you need
Technical Notes


