Using the Mobile Insights Dashboards
Brief Overview
The WalkMe Mobile Dashboards are your way to see insights about your apps and mobile campaigns. Log in to the mobile console here: https://console.mobile.walkme.com/
The dashboard is divided into three sub dashboards:
- Users - displays data on your app users.
- Campaigns- displays data on your WalkMe campaigns.
- Tracked Events - displays data on your WalkMe Events.

Use Cases
- Measure usage and pain points of your mobile campaigns;
- Optimize your WalkMe solution;
- Analyze your end-users' objectives;
- Recognize instances of end-user confusion and UX inefficiency and capitalize on these opportunities to improve.
Users Dashboard
The Users Dashboard updates every 8 hours.
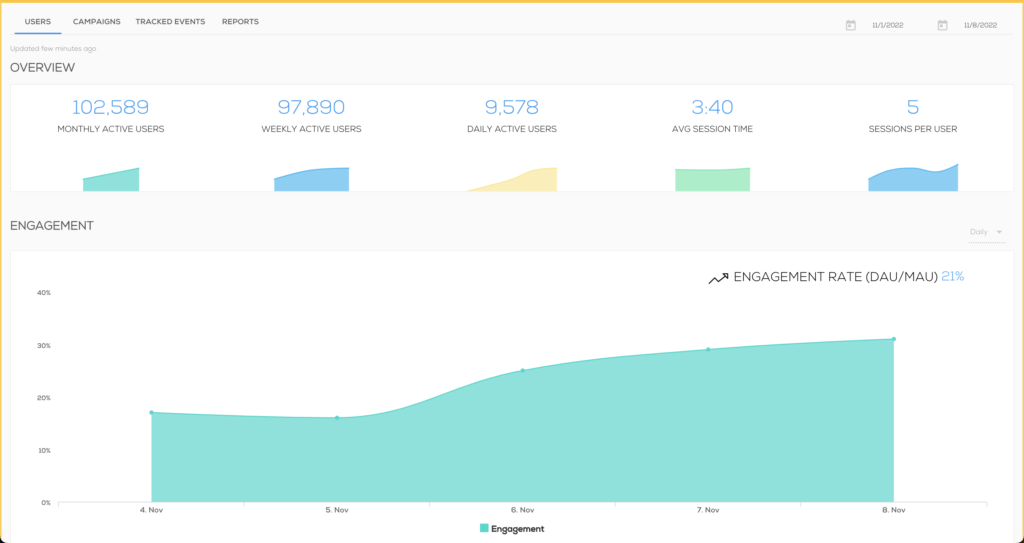
OVERVIEW
- MONTHLY ACTIVE USERS: The number of active unique users calculated using 31 days prior to the "to" date set in the date range.
- WEEKLY ACTIVE USERS: The number of active unique users calculated using 7 days prior to the "to" date set in the date range.
- DAILY ACTIVE USERS: The number of active unique users calculated using the "to" date set in the date range.
- AVG SESSION TIME: The average time users spend in the app per session, calculated using the date range set.
- SESSIONS PER USER: The average number of sessions per day per user, calculated using the date range set. A session is defined by the amount of time a user ACTIVELY spends on the app. A single user can have many sessions per day.
ENGAGEMENT
User engagement is displayed as a percentage equal to the number of daily active users divided by the number of monthly active users.
RETENTION
Retention is displayed as the percentage of users who returned to the application within the defined date range.
TOP LOCATIONS
Displays the countries your app is active in.
PUSH NOTIFICATION
Push notifications is displayed as the percentage of users who have enabled push notifications for this particular app.
iOS "Approved" rates tend to be low (40-50% on average) as iOS requires that applications ask users' permissions at the start of the first session.
On Android, push notifications are enabled by default, so the "Approved" rates are often 90% or higher.
Campaigns Dashboard
The Campaigns Dashboard updates hourly.
OVERVIEW
- AVG. CTR: CTR is displayed as a percentage equal to the number of positive user interactions (clicks) with the campaign divided by the total number of impressions of the campaign.
- TOTAL CLICKS: The total number* of positive interactions with the campaign within the set time period, defined as:
- WalkThru - plays to completion (with no negative CTA interaction) or positive action is interacted with (positive actions include Campaign, custom, Settings, OK)
- Shoutout/Survey - positive action is interacted with (positive actions include Campaign, custom, Settings, OK)
- Launcher - tapped
- *Not limited to a unique user
- TOTAL IMPRESSIONS: The total number* of times the campaigns were shown to users based on the date range and Campaign filtering defined. *Not limited to a unique user
- USER CAMPAIGN RATIO: The User Campaign Ratio is the percentage of all users that have been exposed to the campaign(s) as defined by the Campaign filter.
TOP AUDIENCE
Displays the characteristics of users who engage with WalkMe Campaigns the most, defined by the Campaign filter and date range that have been set.
PERFORMANCE
The Performance graphs display the CTR (click-through rate), impressions and clicks data according to each day within the set date period.
CALL TO ACTION
Use this dropdown to select a campaign and see its clicks distribution for the date range defined.
Tracked Events Dashboard (Goals)
The Events Dashboard updates hourly.

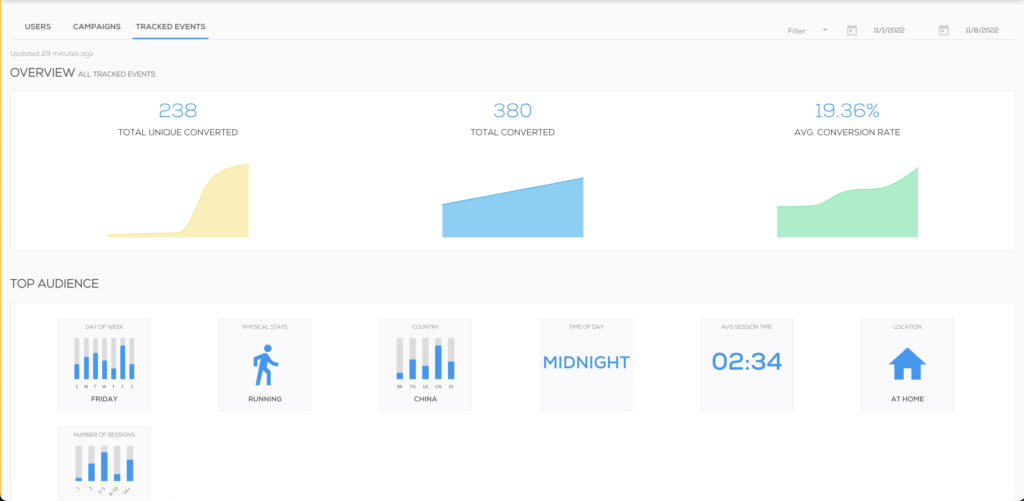
TOTAL UNIQUE CONVERTED
The number of unique users who reached this event in the date range defined.
For example, if a user reached this event twice in this period, it reflects as one count.
TOTAL CONVERTED
The total number of times this event was reached in the date range defined.
For example, if a user reached this event twice it reflects as two counts.
AVG. CONVERSION RATE
The percentage displayed is the average of the conversion rate* per day, within the date range defined.
*Conversion rate is calculated as the total number of unique conversions (event reaches) divided by the total number of sessions.
This number helps you understand how often users are reaching events.
Data Displayed in Dashboards
The following table displays the type of user data each dashboard displays, this is either unique per user or not unique per user.
| Data per unique users | Data not per unique users | |
| Users Dashboard | All data | None |
| Campaigns Dashboard |
|
|
| Tracked Events Dashboard (Goals) |
|
|

