Brief Overview
The AI Usage Dashboard provides customer-managed AI visibility for accounts using Bring Your Own LLM (BYO LLM).
It offers model-level insight into input and output token usage, monthly activity trends, and breakdowns by product and system, helping teams understand how their AI models are being used and estimate costs using customer-defined pricing.
This dashboard is designed to answer questions such as:
-
Which customer-managed AI models are being used the most?
-
How many input vs. output tokens are generated?
-
Which products and systems drive AI usage?
-
How AI usage trends change over time
Access
To access the AI Usage Dashboard page, open the the AI Center app in the Admin Center:
WalkMe Admin Center
How It Works
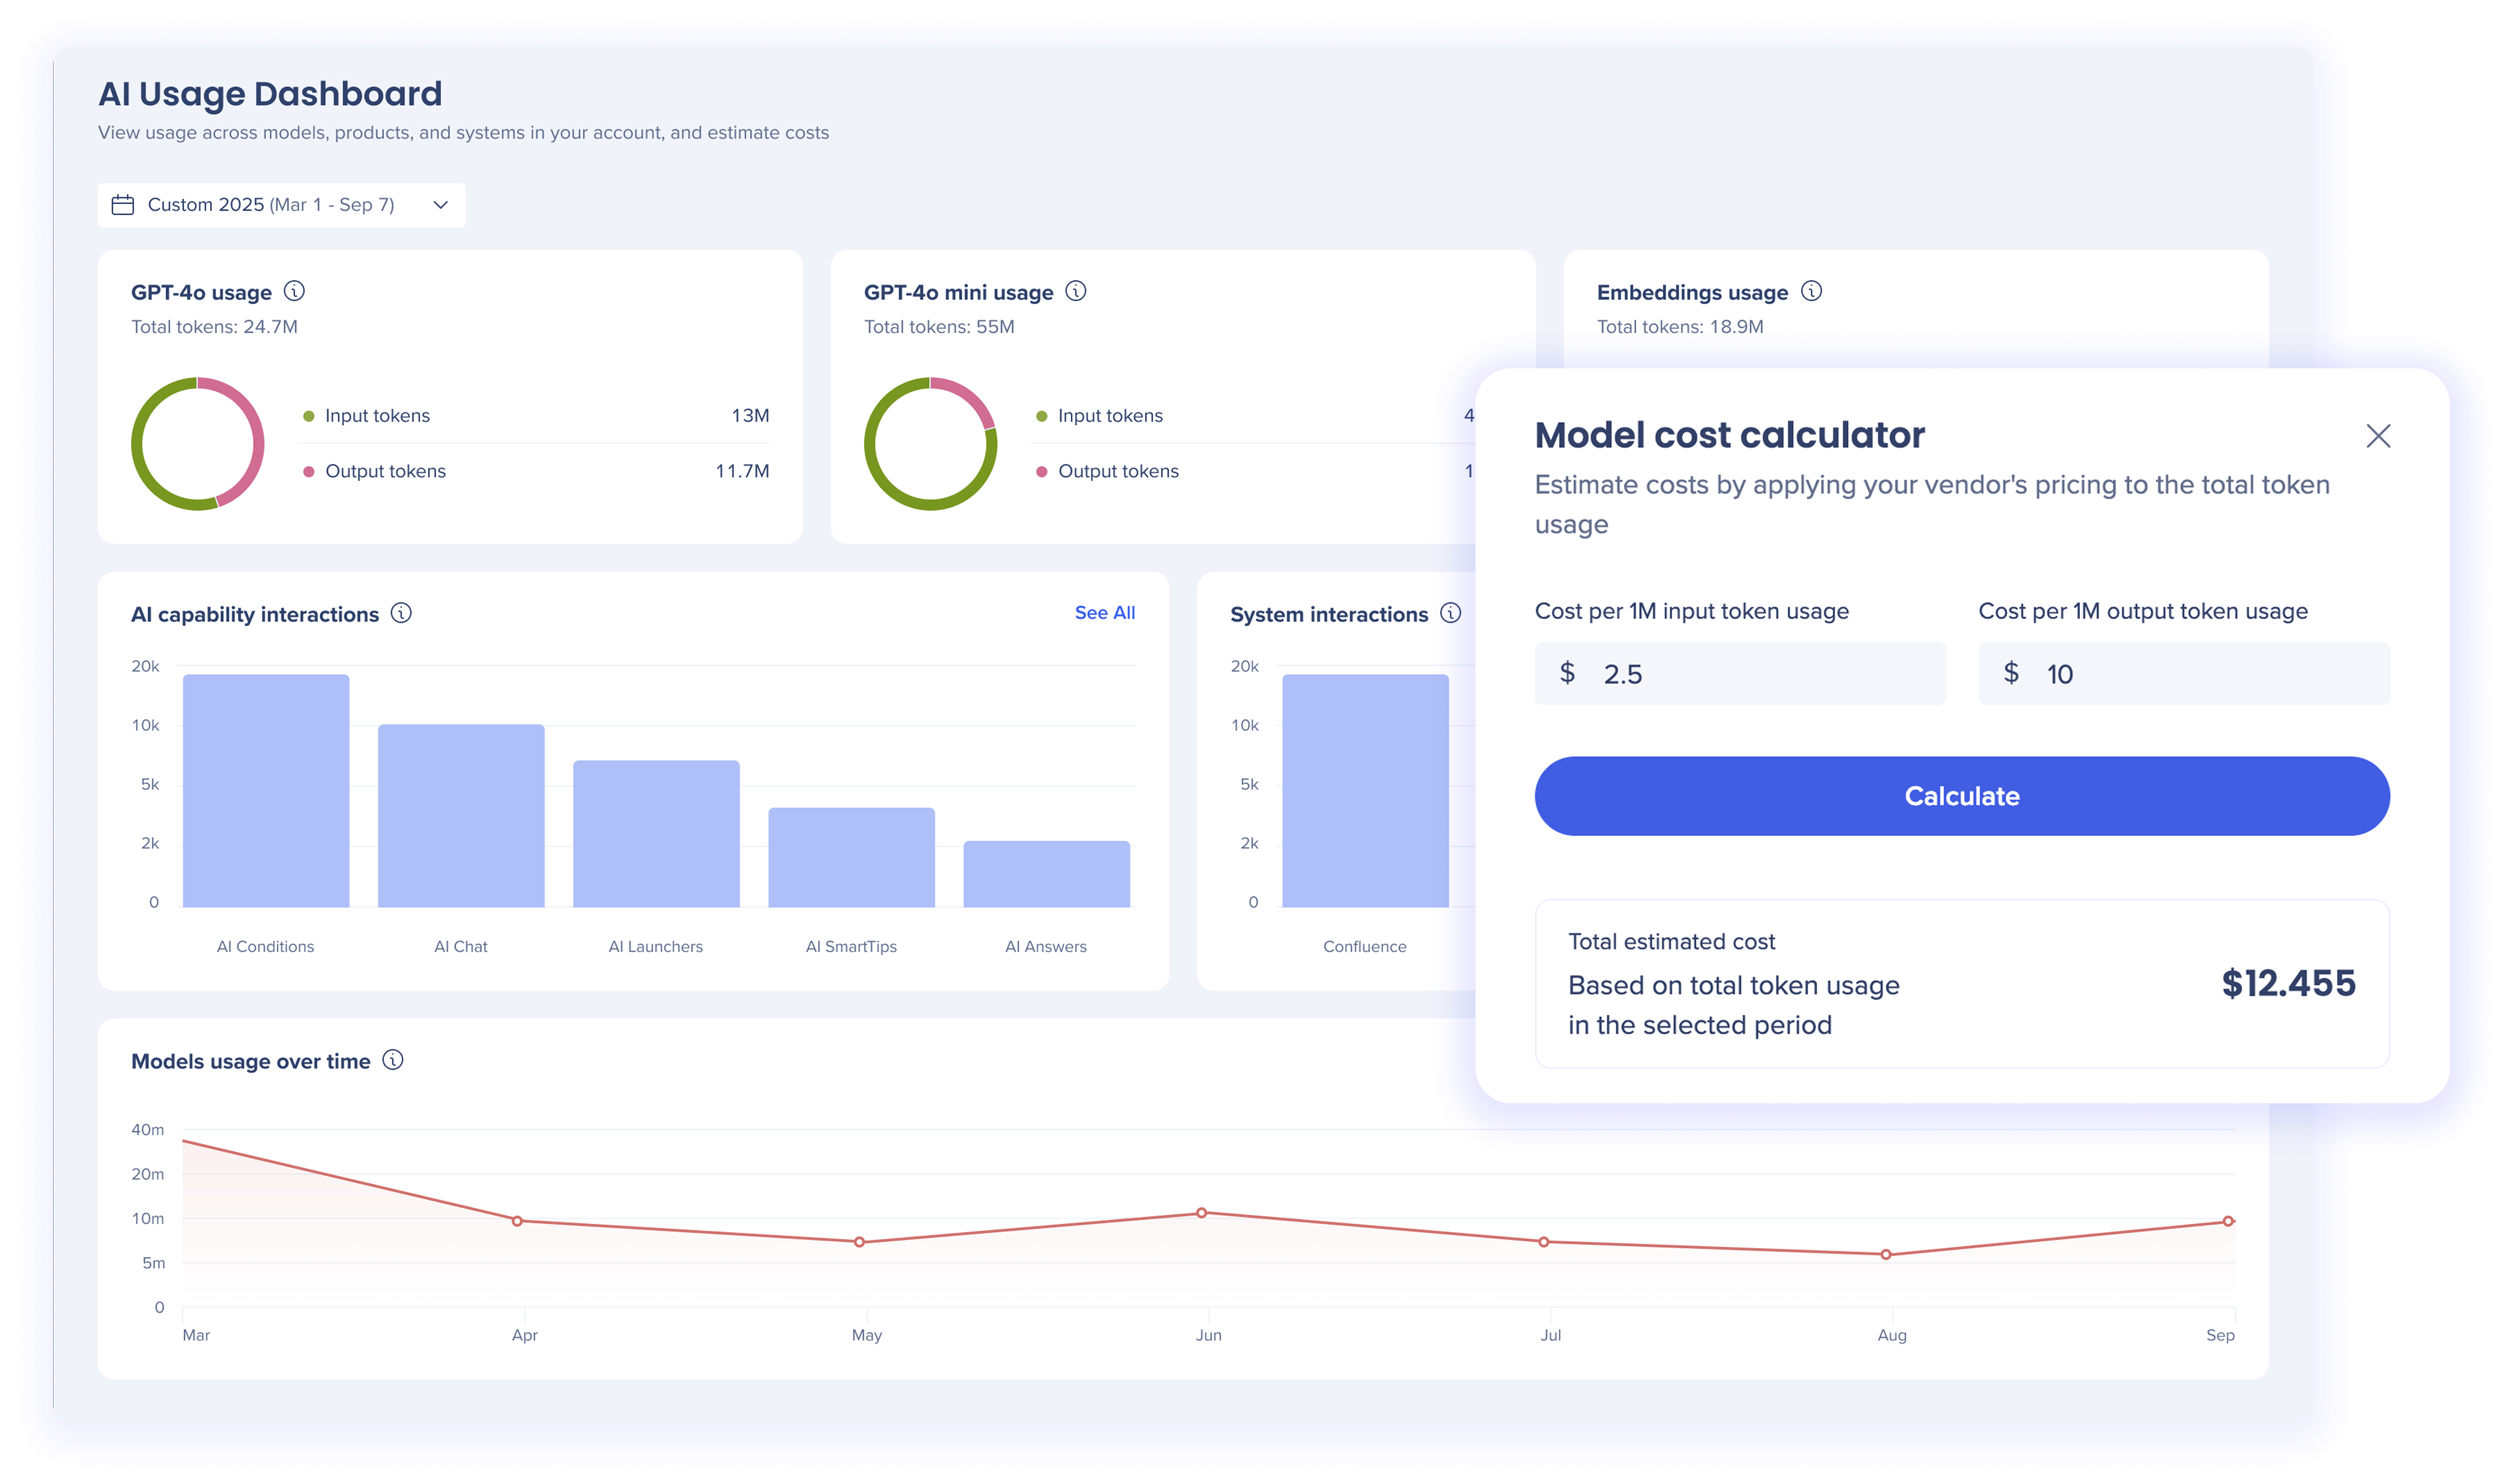
The AI Usage Dashboard is designed to help users monitor, analyze, and optimize usage of their customer-managed AI models.
Start by selecting a date range to understand AI usage within a specific period. From there, use the widgets together to answer key questions about model usage, feature adoption, system impact, and trends over time.
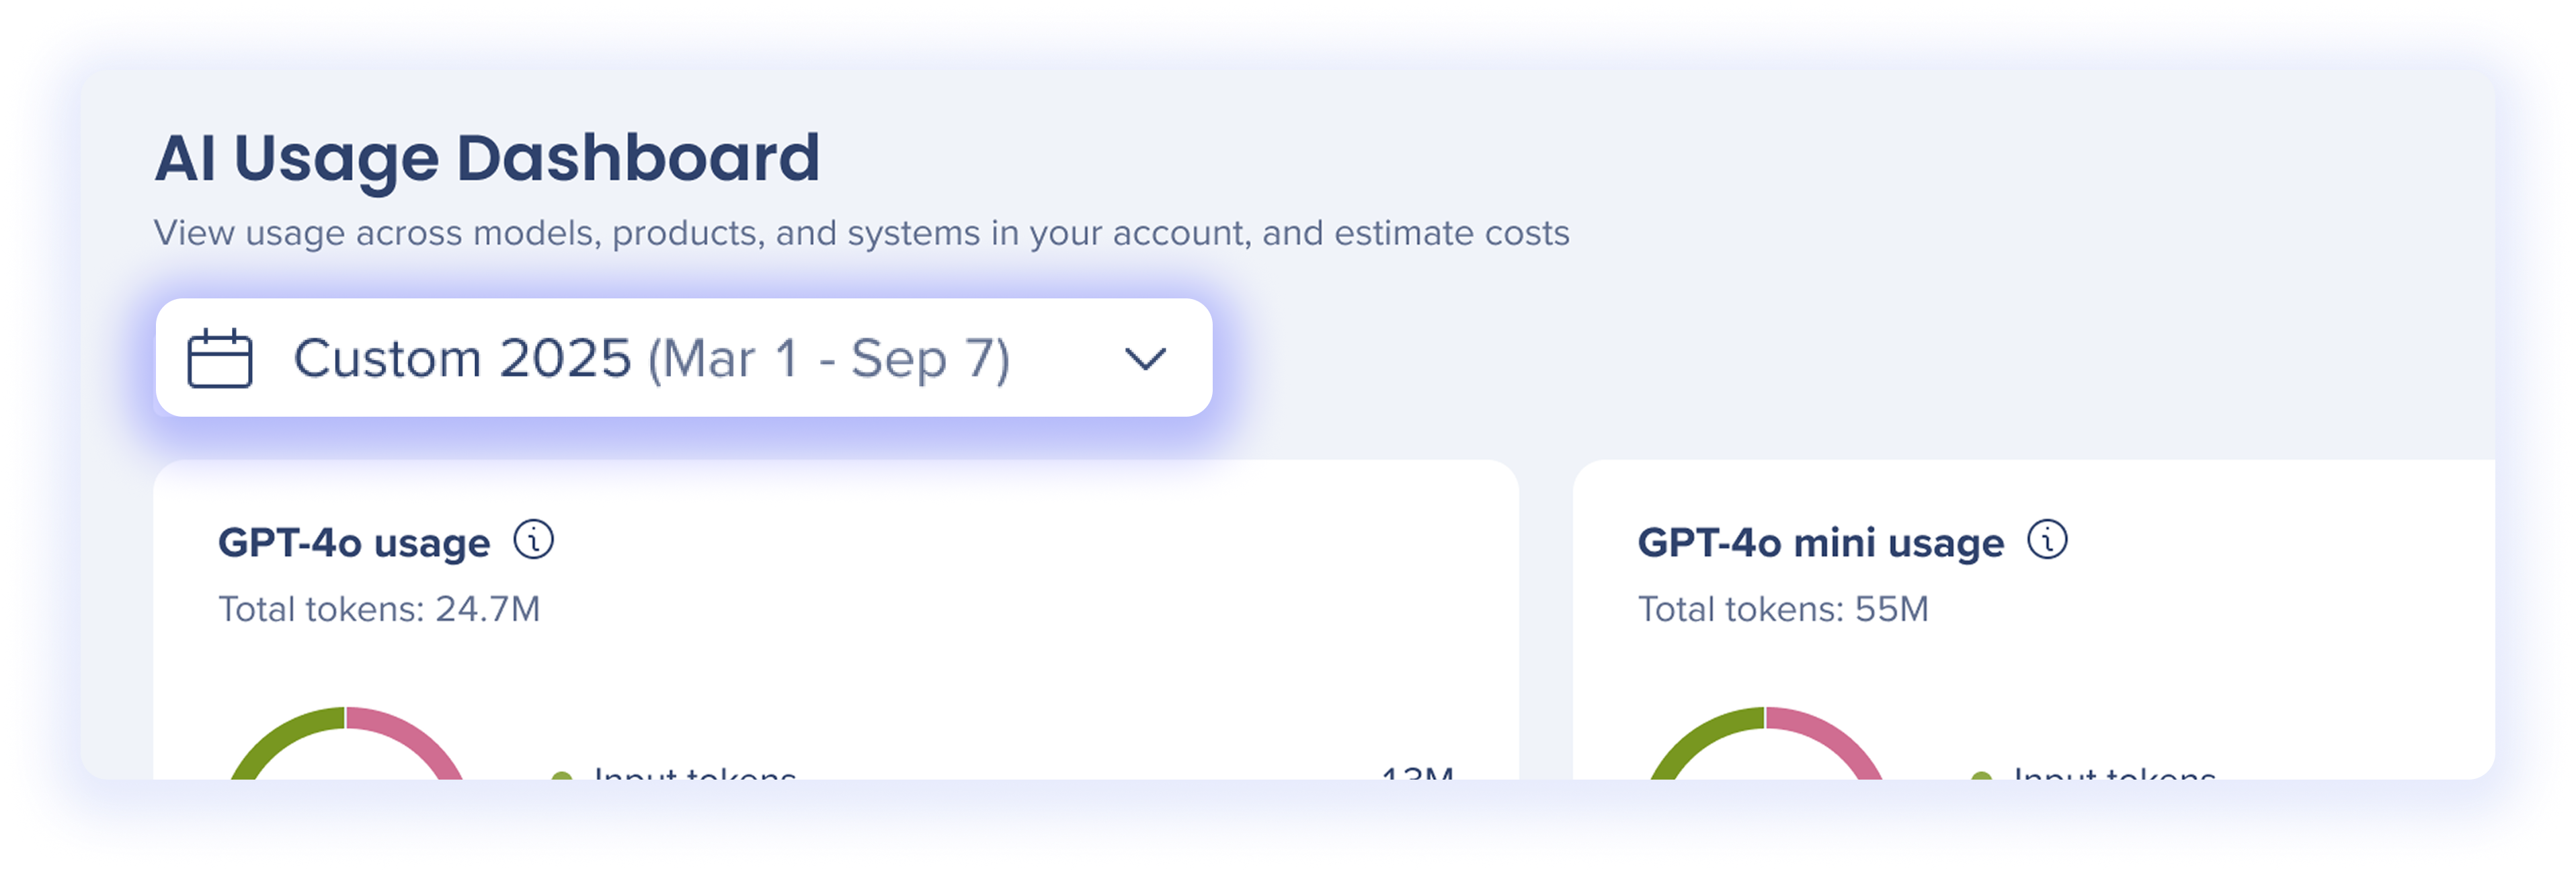
Date picker
Use the date picker at the top of the dashboard to define the time period for all metrics.
Displays usage for any AI model configured by your organization.
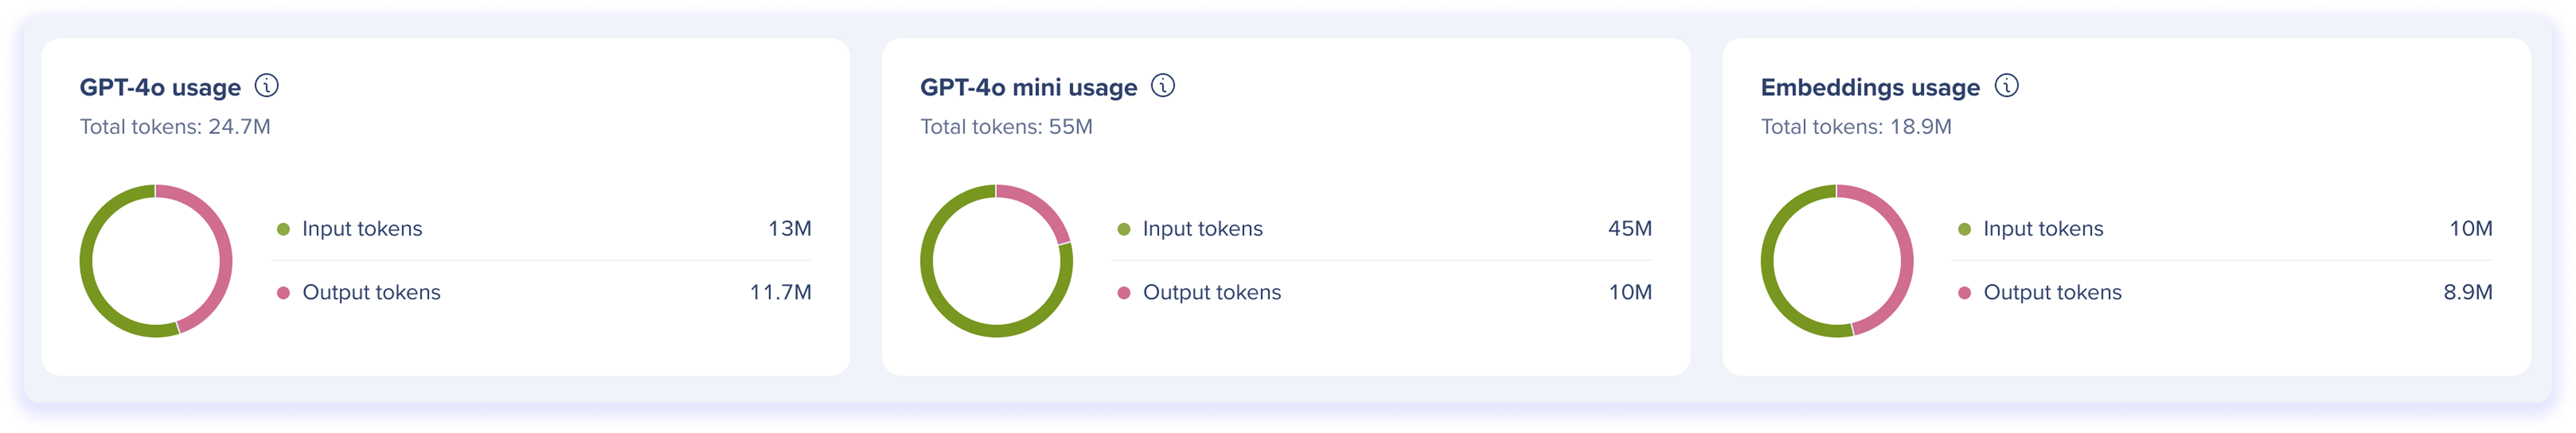
These widgets provide model-level visibility into how your customer-managed AI models are being used across WalkMe AI experiences in the selected period.
For each model, you can view:
-
Total tokens: The total number of tokens processed by the AI model during the selected period
-
Input tokens: Tokens generated from text sent to the AI model
-
Output tokens: Tokens generated by the AI model in response to input text
Use these widgets to:
-
Understand which AI models drive the highest usage
-
Compare input vs. output behavior across models
-
Support governance, optimization, and cost monitoring for customer-managed AI providers
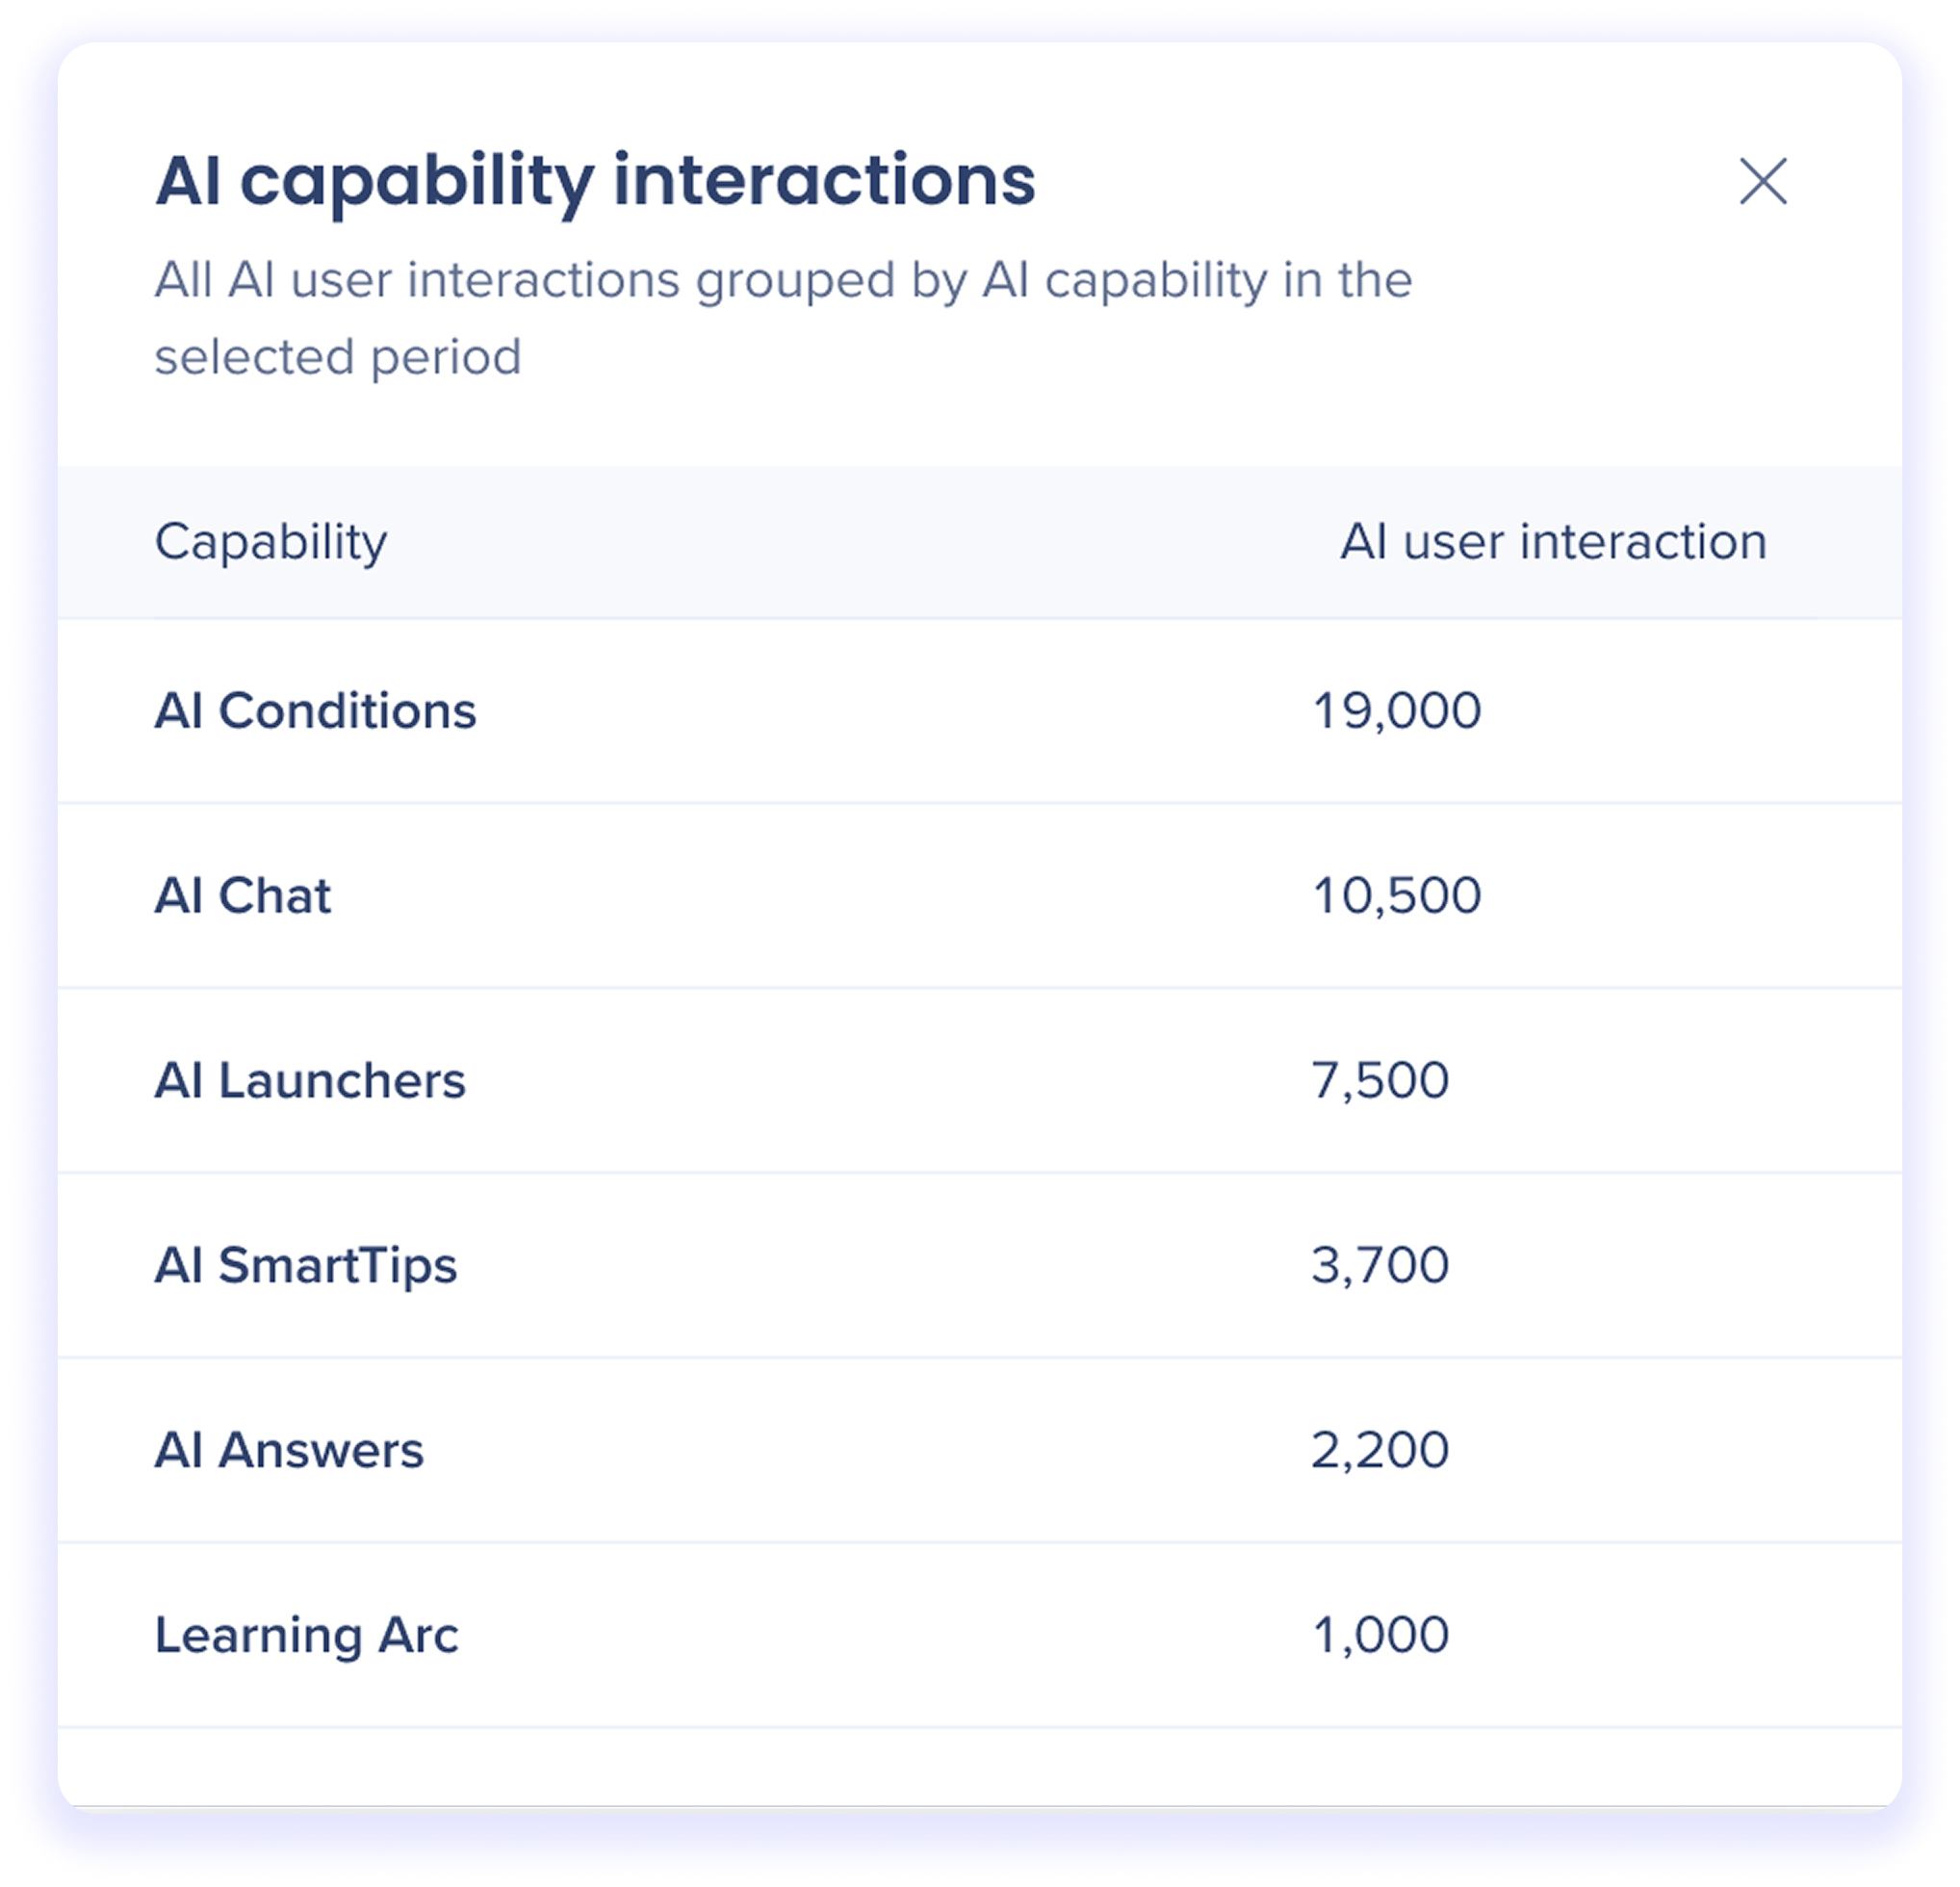
AI capability interactions
Highlights user interactions with WalkMe AI capabilities
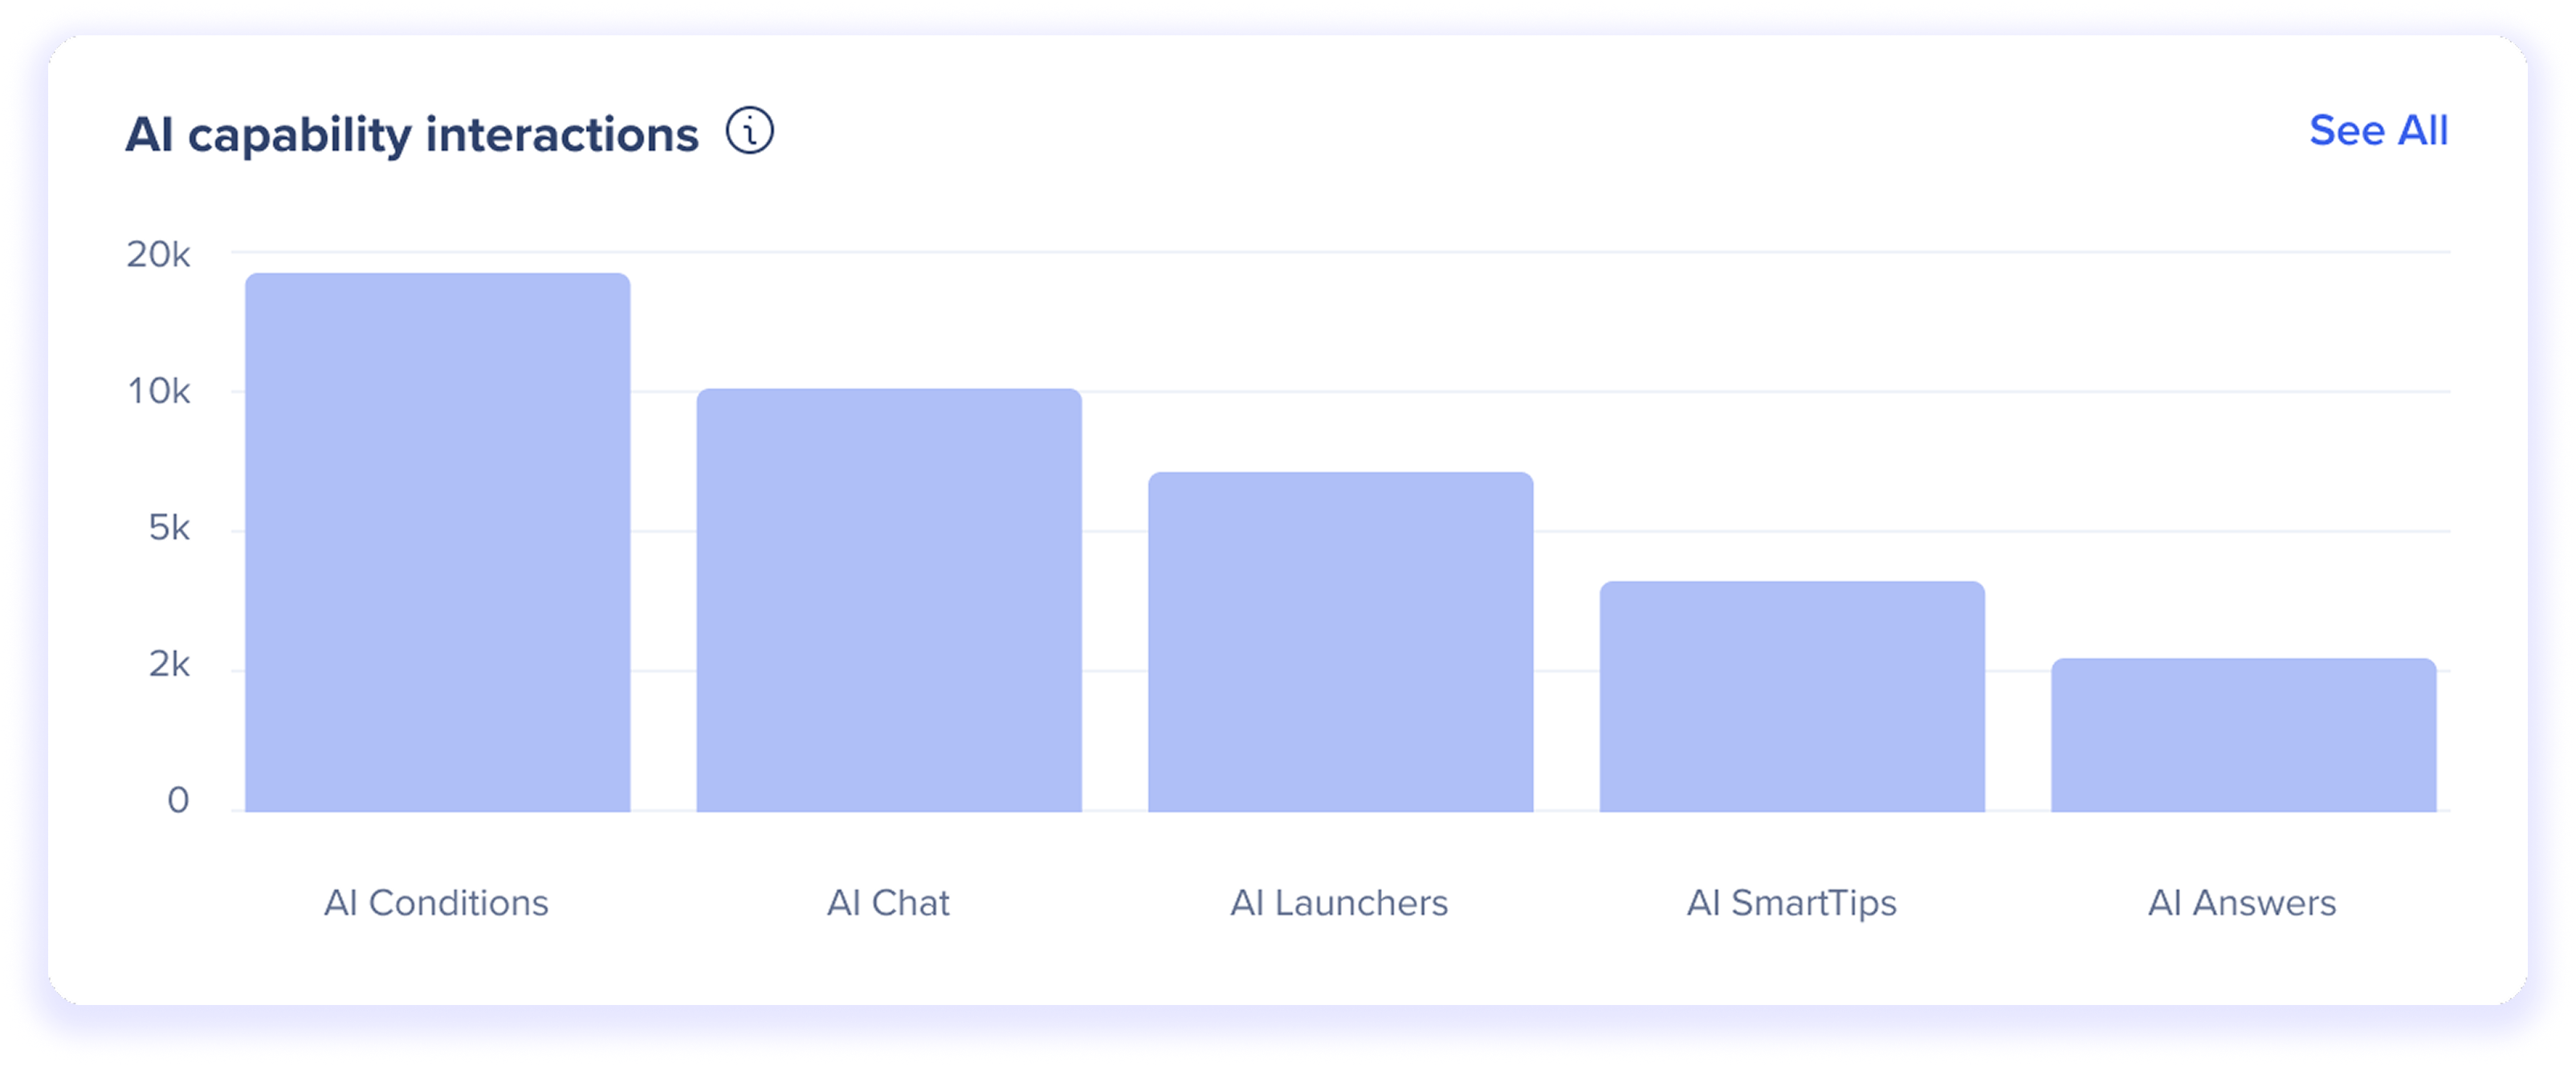
This widget shows usage volume by AI capability, helping you understand where AI is delivering value across the WalkMe experience.
Use this widget to:
-
Identify which AI capabilities are most actively used
-
Compare adoption across AI-powered features
-
Prioritize optimization and investment in high-impact capabilities
Click See All to view all AI capabilities included in the selected time period.
System interactions
Highlights AI interactions broken down by system

This widget helps you:
-
Identify which systems generate the most AI activity
-
Understand where customer-managed AI models are most heavily used
-
Compare AI adoption across different platforms and tools
Click See All to view all systems included in the selected time period.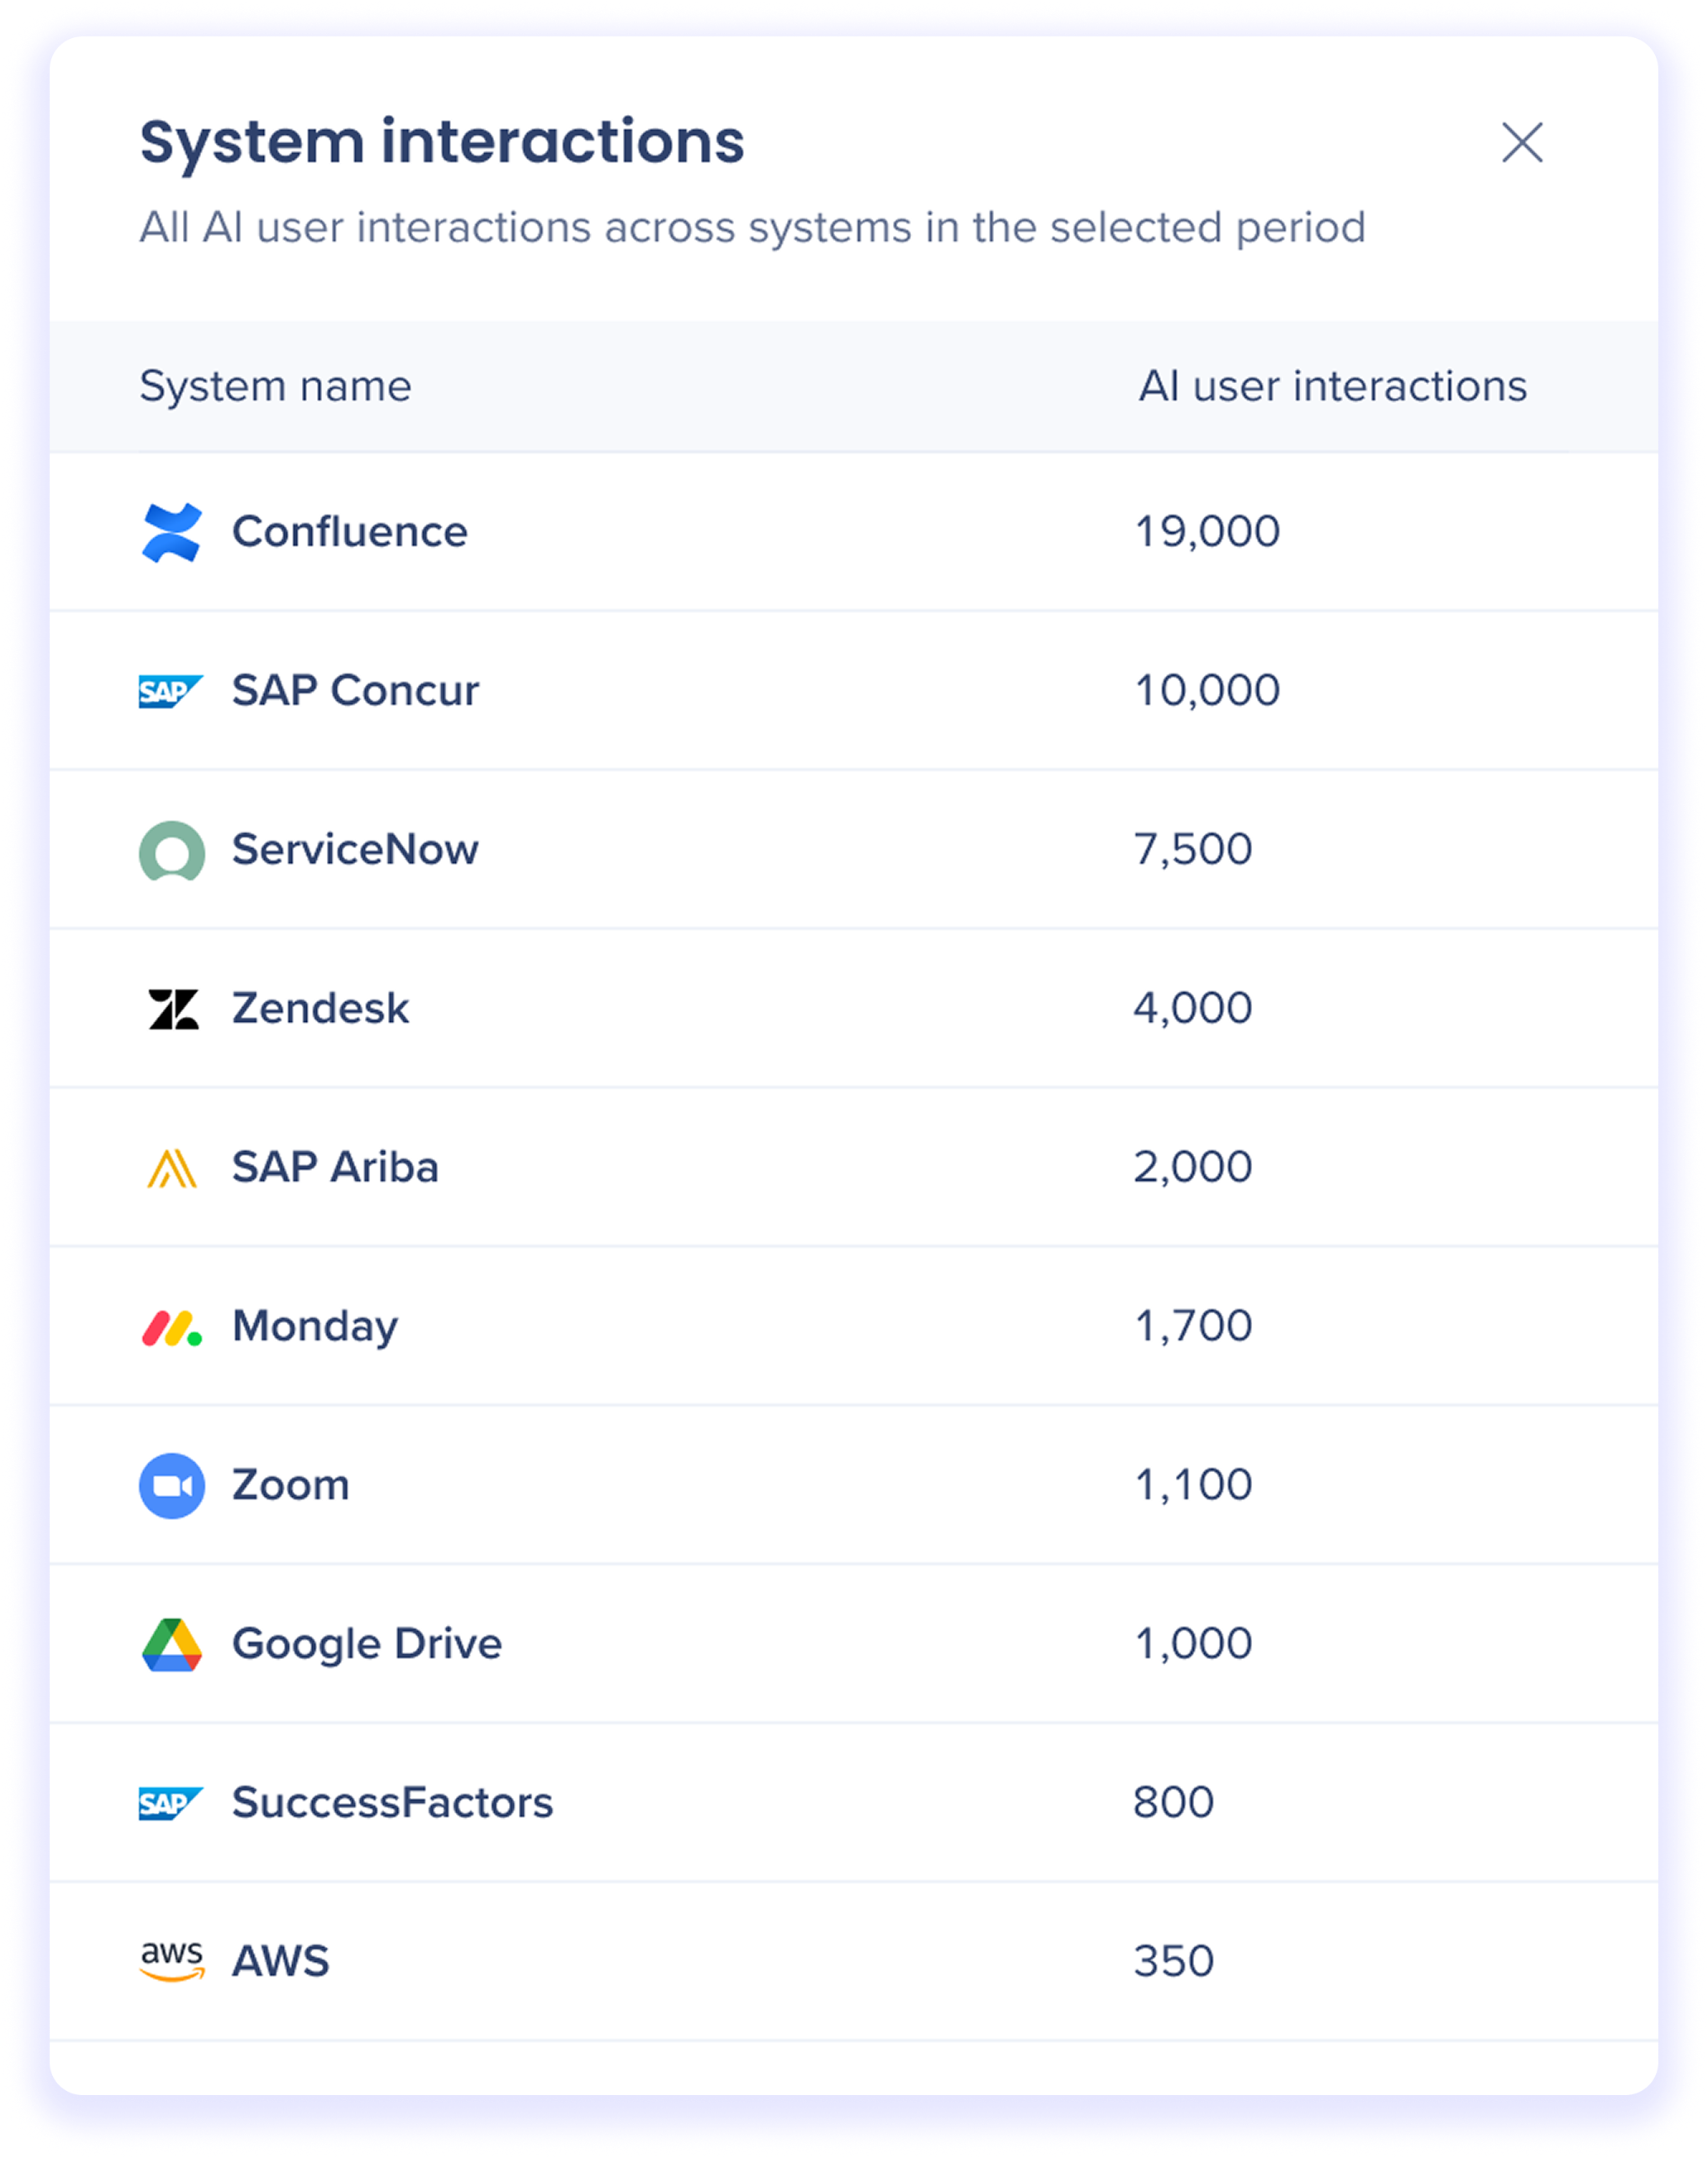
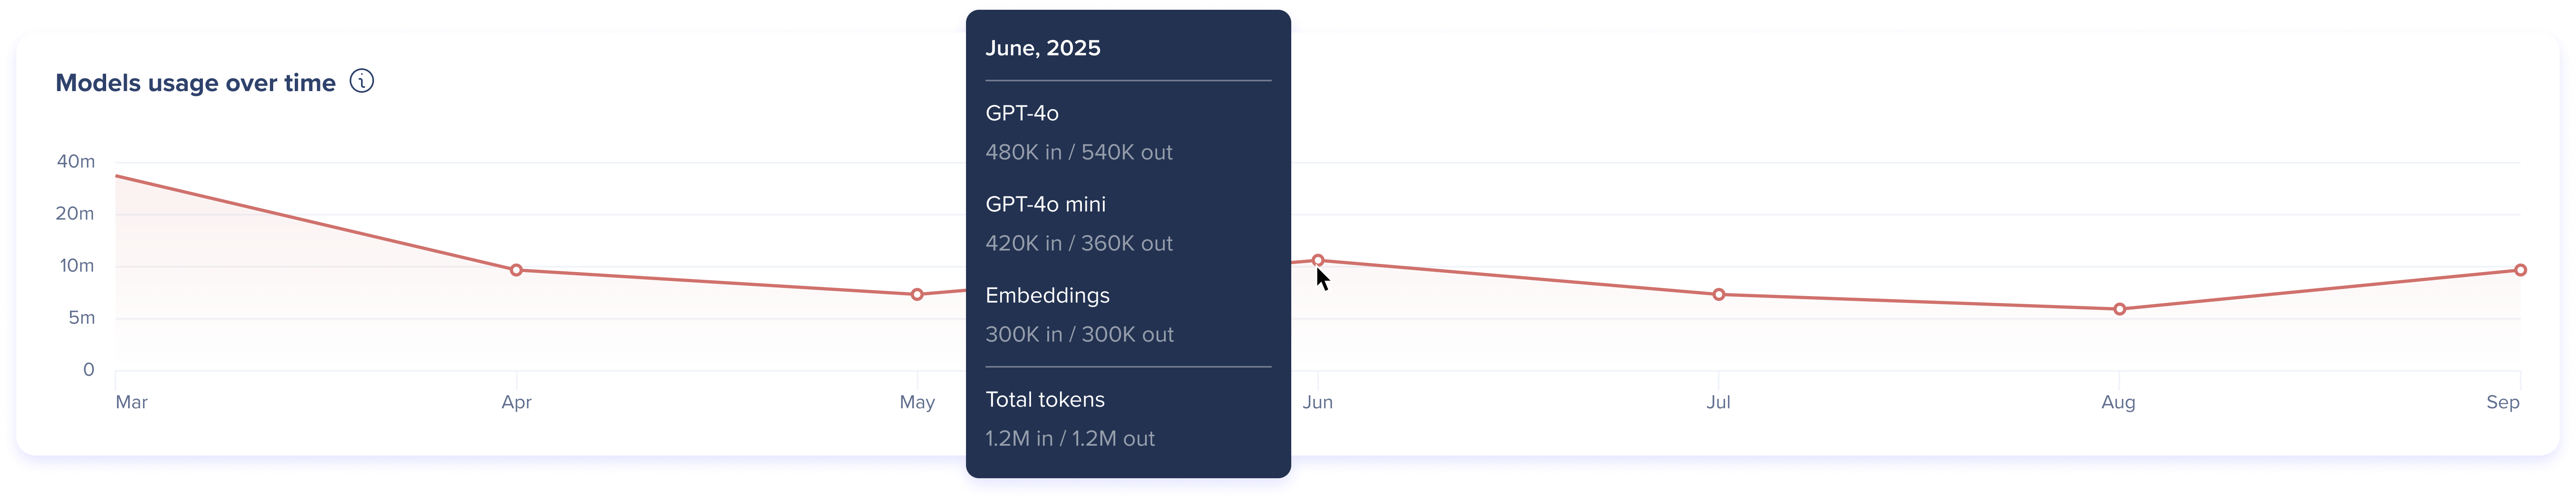
Models usage over time
A line graph showing AI token usage trends over the selected period, across all configured AI models.
This widget helps you:
-
Track growth or decline in AI usage over time
-
Correlate usage changes with launches, rollouts, or configuration changes
-
Understand seasonal or cyclical usage patterns
Hover over any point to view detailed usage for that specific time period, including:
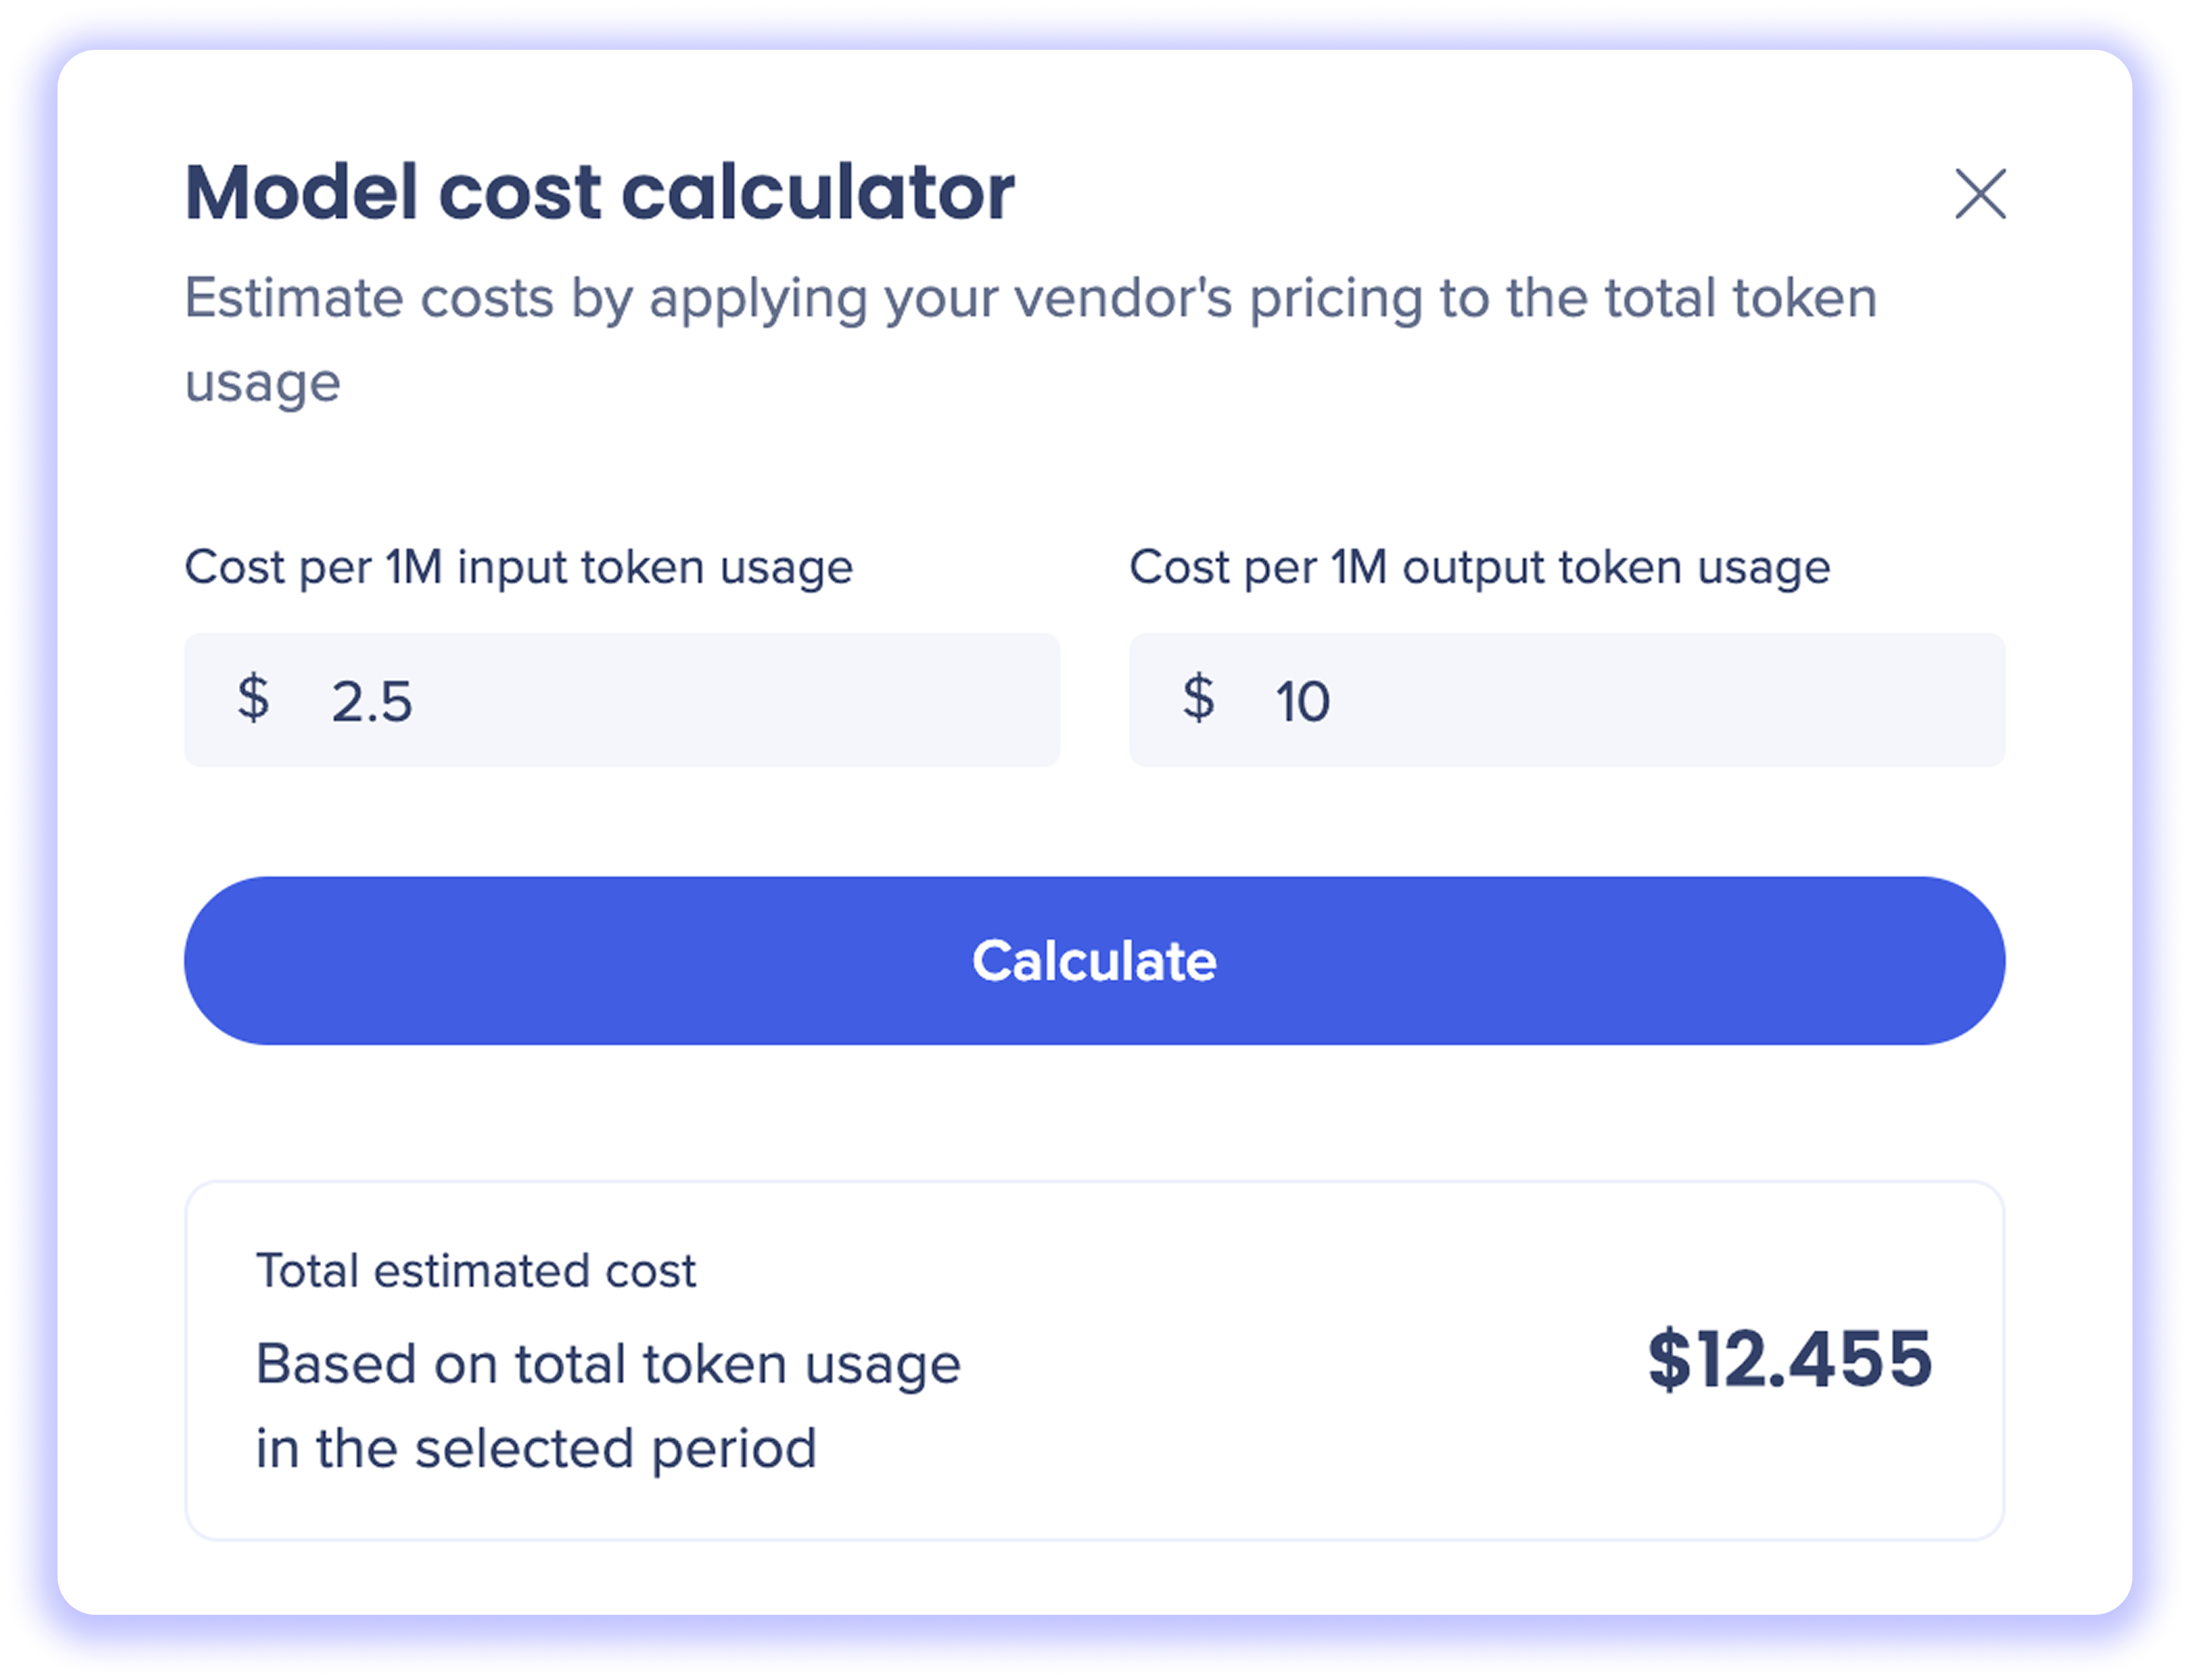
Model Cost Calculator
The model cost calculator allows you to estimate AI spend by applying your AI vendor's pricing to token usage.
How to use the cost calculator
-
Hover over an AI model usage widget and click the Calculate cost icon
-
Enter the cost per input token based on your AI vendor's pricing
-
Enter the cost per output token based on your AI vendor's pricing
-
Click Calculate to generate a total estimated cost
The calculation is based on the total input and output tokens used during the selected period.
Model-specific values are saved at the account level. This ensures your team always sees the latest updates and removes the need for manual re-entry.
Note
Calculations are for estimation purposes only and do not represent WalkMe billing.
Technical Notes
-
Cost calculations are estimates only and may differ from your AI vendor's actual billing
-
Pricing inputs must be entered manually and are not validated against vendor rate cards
-
Usage data reflects only AI interactions processed through WalkMe-supported AI capabilities
-
Historical data availability depends on when the AI Usage Dashboard feature was enabled
- Token usage is aggregated at the account level and cannot currently be filtered by individual users
- To dive into specific WalkMe system usage data, go to the AI Dashboards in Insights
BYOLLM Customers Only
This dashboard is only available for Bring Your Own LLM users only.


