Brief Overview
Content tagging enables you to assign WalkMe content, such as ShoutOuts, Smart Walk-Thrus, and SmartTips, to Workflows and Tasks from our Workflows Catalog. Assigned content will reflect accordingly in the Active Workflows and Active Tasks sections.
Assigning content also allows you to create custom dashboards for the associated Workflows and Tasks. That custom dashboard can then be shared with business stakeholders so they can easily track the success of the Workflow implementation.
This article covers how to tag WalkMe content and how to create a custom dashboard.
Workflows

How It Works
Tag Content
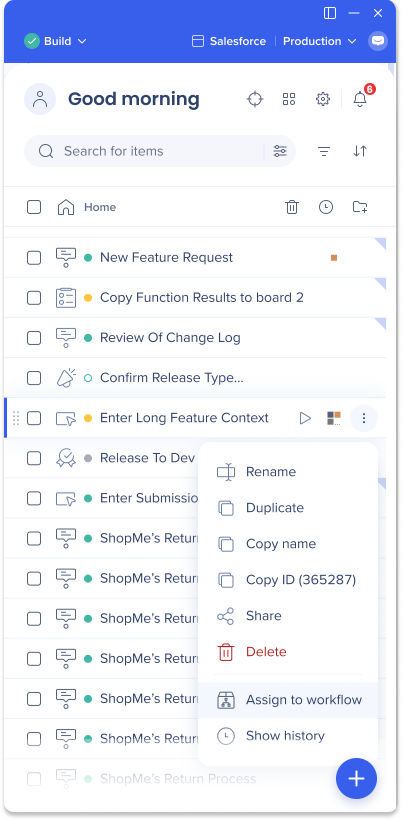
How to assign content
- Open the WalkMe Editor
- Hover over the WalkMe item you want to assign
- Click the item options menu
- Click Assign to workflow
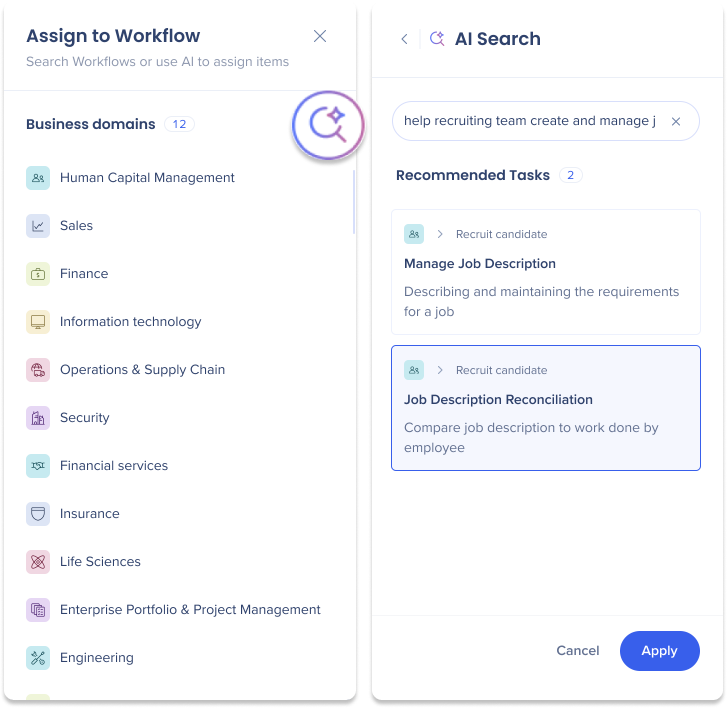
- Search for relevant tasks manually by clicking on a business domain
- Click a Workflow to see the tasks within
- Select all of the tasks you'd like to assign
- Click Apply

You can also search for relevant tasking using AI Search.
- Click the AI Search icon
- Type a description of the business challenge or workflow you want to improve in the AI Search field
- Click on the tasks you want to assign
- Click Apply
Create Custom Dashboards
To create a custom dashboard for a specific workflow, use the Insights app available in the console. This feature allows you to add metric widgets that extract data from the tagged WalkMe content to create a unique dashboard with valuable insights. The dashboard will then appear in the Workflows app for stakeholders to use.
-
Go to the My Dashboard page in the console under the Insights tab
-
Click Create Dashboard
- Type a name for your dashboard in the New Dashboard field and write a description (optional)
- Click Add Widget

- The Widget Gallery will appear
- Tip: Narrow down your search results by filtering based on Widget type or Content type.

- Select a widget from the Widget Gallery to add to your dashboard
- When selecting a widget, you must select the system from which you wish to retrieve data for the widget
- You can also rename the widget and add a description
- Click Add Widget
- Tip: Narrow down your search results by filtering based on Widget type or Content type.

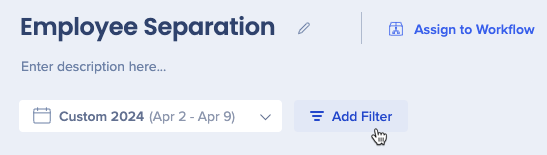
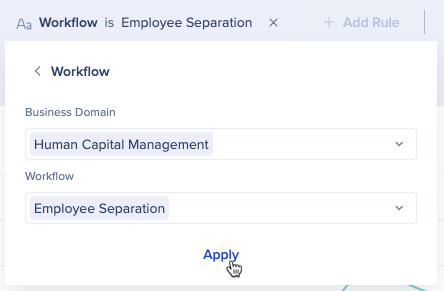
Add Workflow filter
Next, you'll need to filter your data by your Workflow. By doing so, you'll only see the WalkMe content that has been specifically tagged to that Workflow.
- Click Add Filter
- Click New Filter
- Select Workflow
- Select Workflow
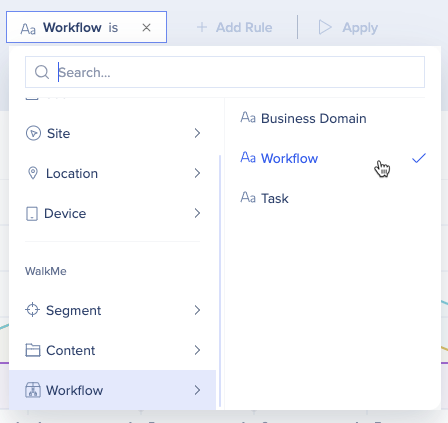
- Select the Business Domain and Workflow
- Click Apply
Tips
- Pin Filters: You can save a filter by “pin it” to the custom dashboard so it becomes the default view.
- Filter by Multiple Tasks: You can use multiple Task filters on a custom dashboard, but all widgets in that dashboard will be affected by the same filter. You cannot apply different filters to different widgets in the same dashboard.
Assign dashboard to Workflows
Lastly, you'll need to assign your dashboard to the desired Workflow which will appear in the Workflows app. Follow these steps:
- Click Assign to Workflow
- Select the Business Domain
- Select the Workflow
- Alternatively, search for the Workflow in the AI Search by clicking the AI Search icon
- Click Apply
Note
Only one custom dashboard can be assigned to one Workflow.
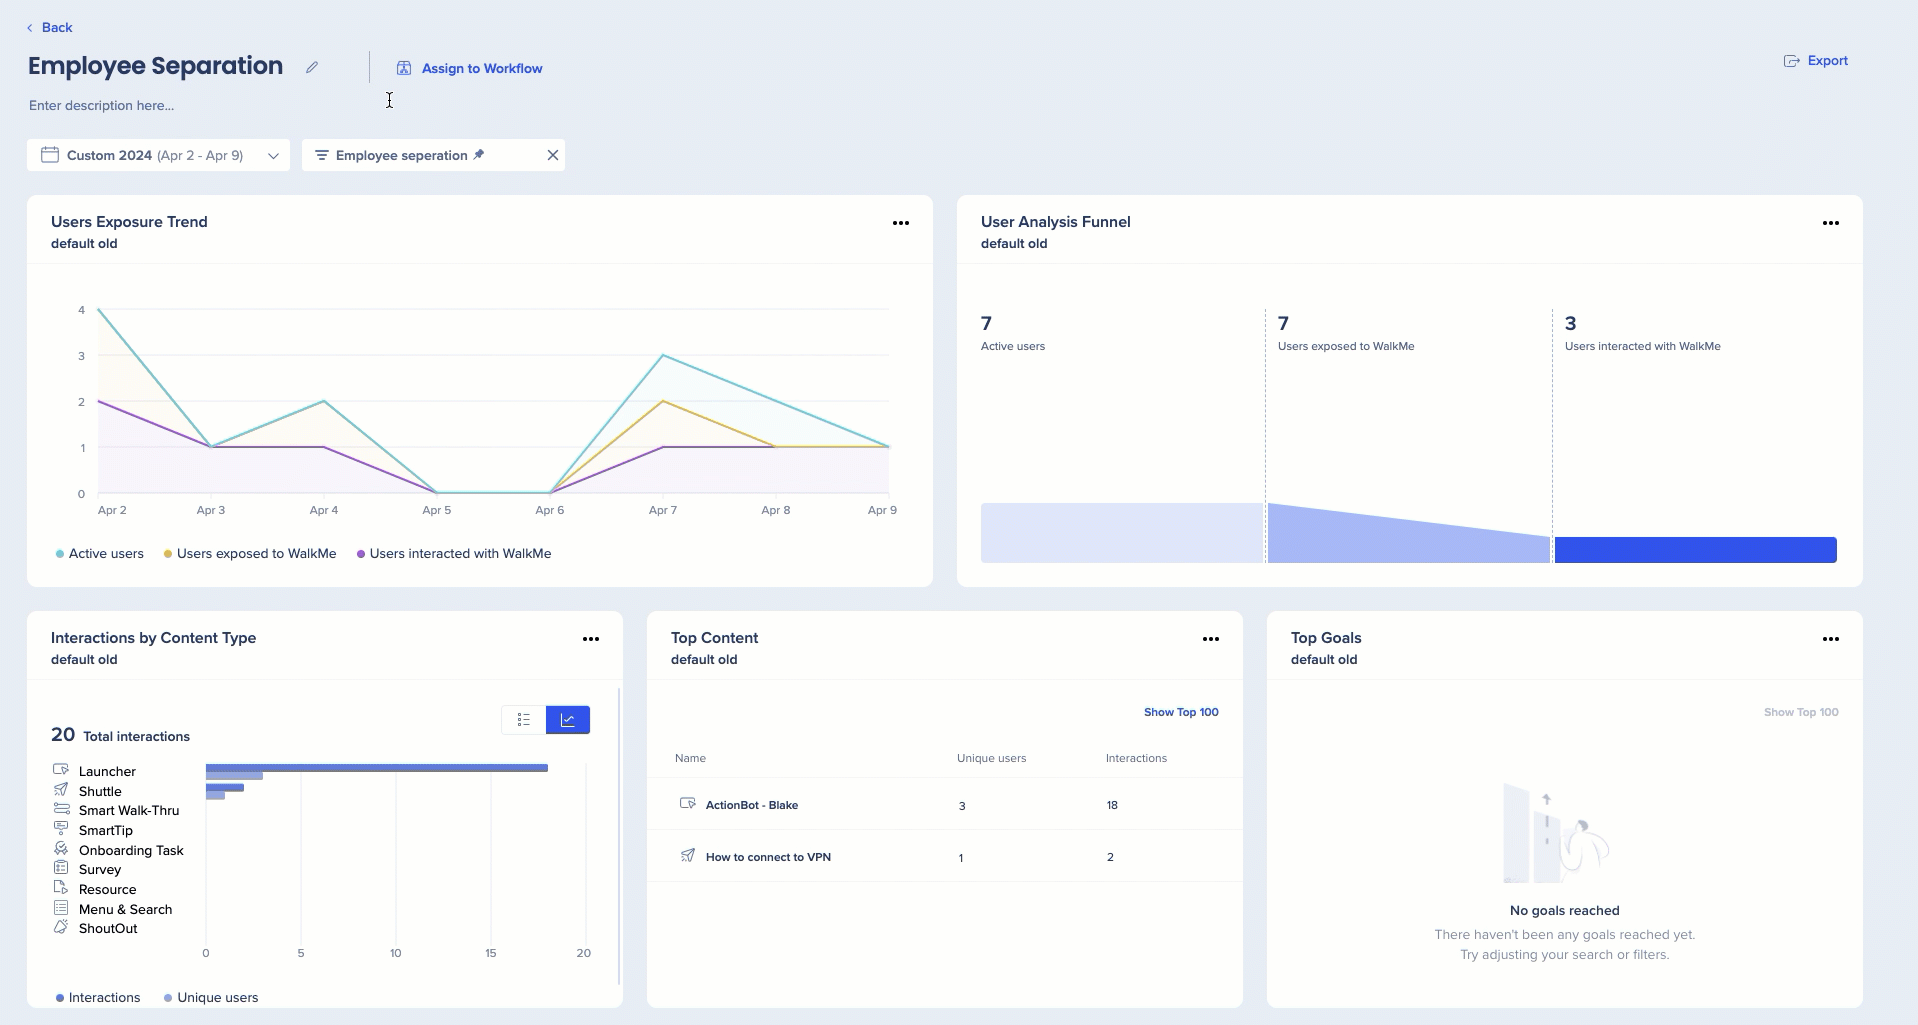
View Dashboard in Workflows
To view the custom dashboard you created within the Workflows app, you can navigate back to the Workflow Insights tab. This will allow business leaders to conveniently assess the effect of DAP on the Workflow.
How to access Workflow Insights
-
Go to the Workflows App
-
Select a workflow
-
Click the Workflow Insights tab
Additional Capabilities
-
Time range filters: Allows you to display data over a specific period of time
-
Export: Export a pdf of the dashboard to share with colleagues
-
Hover: Hover widgets to see more detailed data

Tip Tuesday Videos
Tagging WalkMe content
Creating Dashboards with Tagged Content