Brief Overview
The AI Dashboards in the Insights Console provide comprehensive visibility into the usage and adoption of AI products within your workflow.
These dashboards feature up to four tabs, each dedicated to a specific WalkMe AI product: AI Answers, AI Action Bar, AI SmartTips, and AI Rules. The tabs you receive depend on your AI package.
Each dashboard includes interactive visualizations and detailed breakdowns to help you make data-driven decisions, understand user behavior, and drive engagement.
This functionality is crucial for users as it offers detailed insights into how AI tools are being utilized, enabling better decision-making and optimization of AI integration.
Use Cases
- AI Answers: Use the AI Answer dashboard to categorize and analyze employee conversations, identifying where they need help
- Example: An HR lead can pinpoint frequently asked HR topics, prioritize documentation updates, and reduce training needs
- AI Action Bar: Track employee AI usage with the AI Action Bar dashboard to understand their needs and improve performance
- Example: A head of security can monitor email scanning for phishing risks, track policy adherence, and minimize risk exposure
- AI SmartTips: Improve form input quality and employee efficiency with the AI SmartTip dashboard, which groups SmartTips into Topics
- Example: A head of sales can guide correct data input, identify input challenges, and validate team collaboration hypotheses
- AI Rules: Measure and enhance business performance by tracking AI's impact on user behavior with the AI Rules dashboard
- Example: A product manager can use AI rules on feedback forms to nudge positive feedback to app store ratings and guide negative feedback through self-help, improving CSAT scores
Access

-
Go to the Systems Overview page in the console
-
Select a system from the Monitored Systems widget
-
Click the AI Dashboards tab from the apps bar
User Access to AI Dashboards
Each user can only view AI dashboards they have permission for, as controlled by their WalkMe admin. Ask your customer success manager for more information.
Get to Know & Use
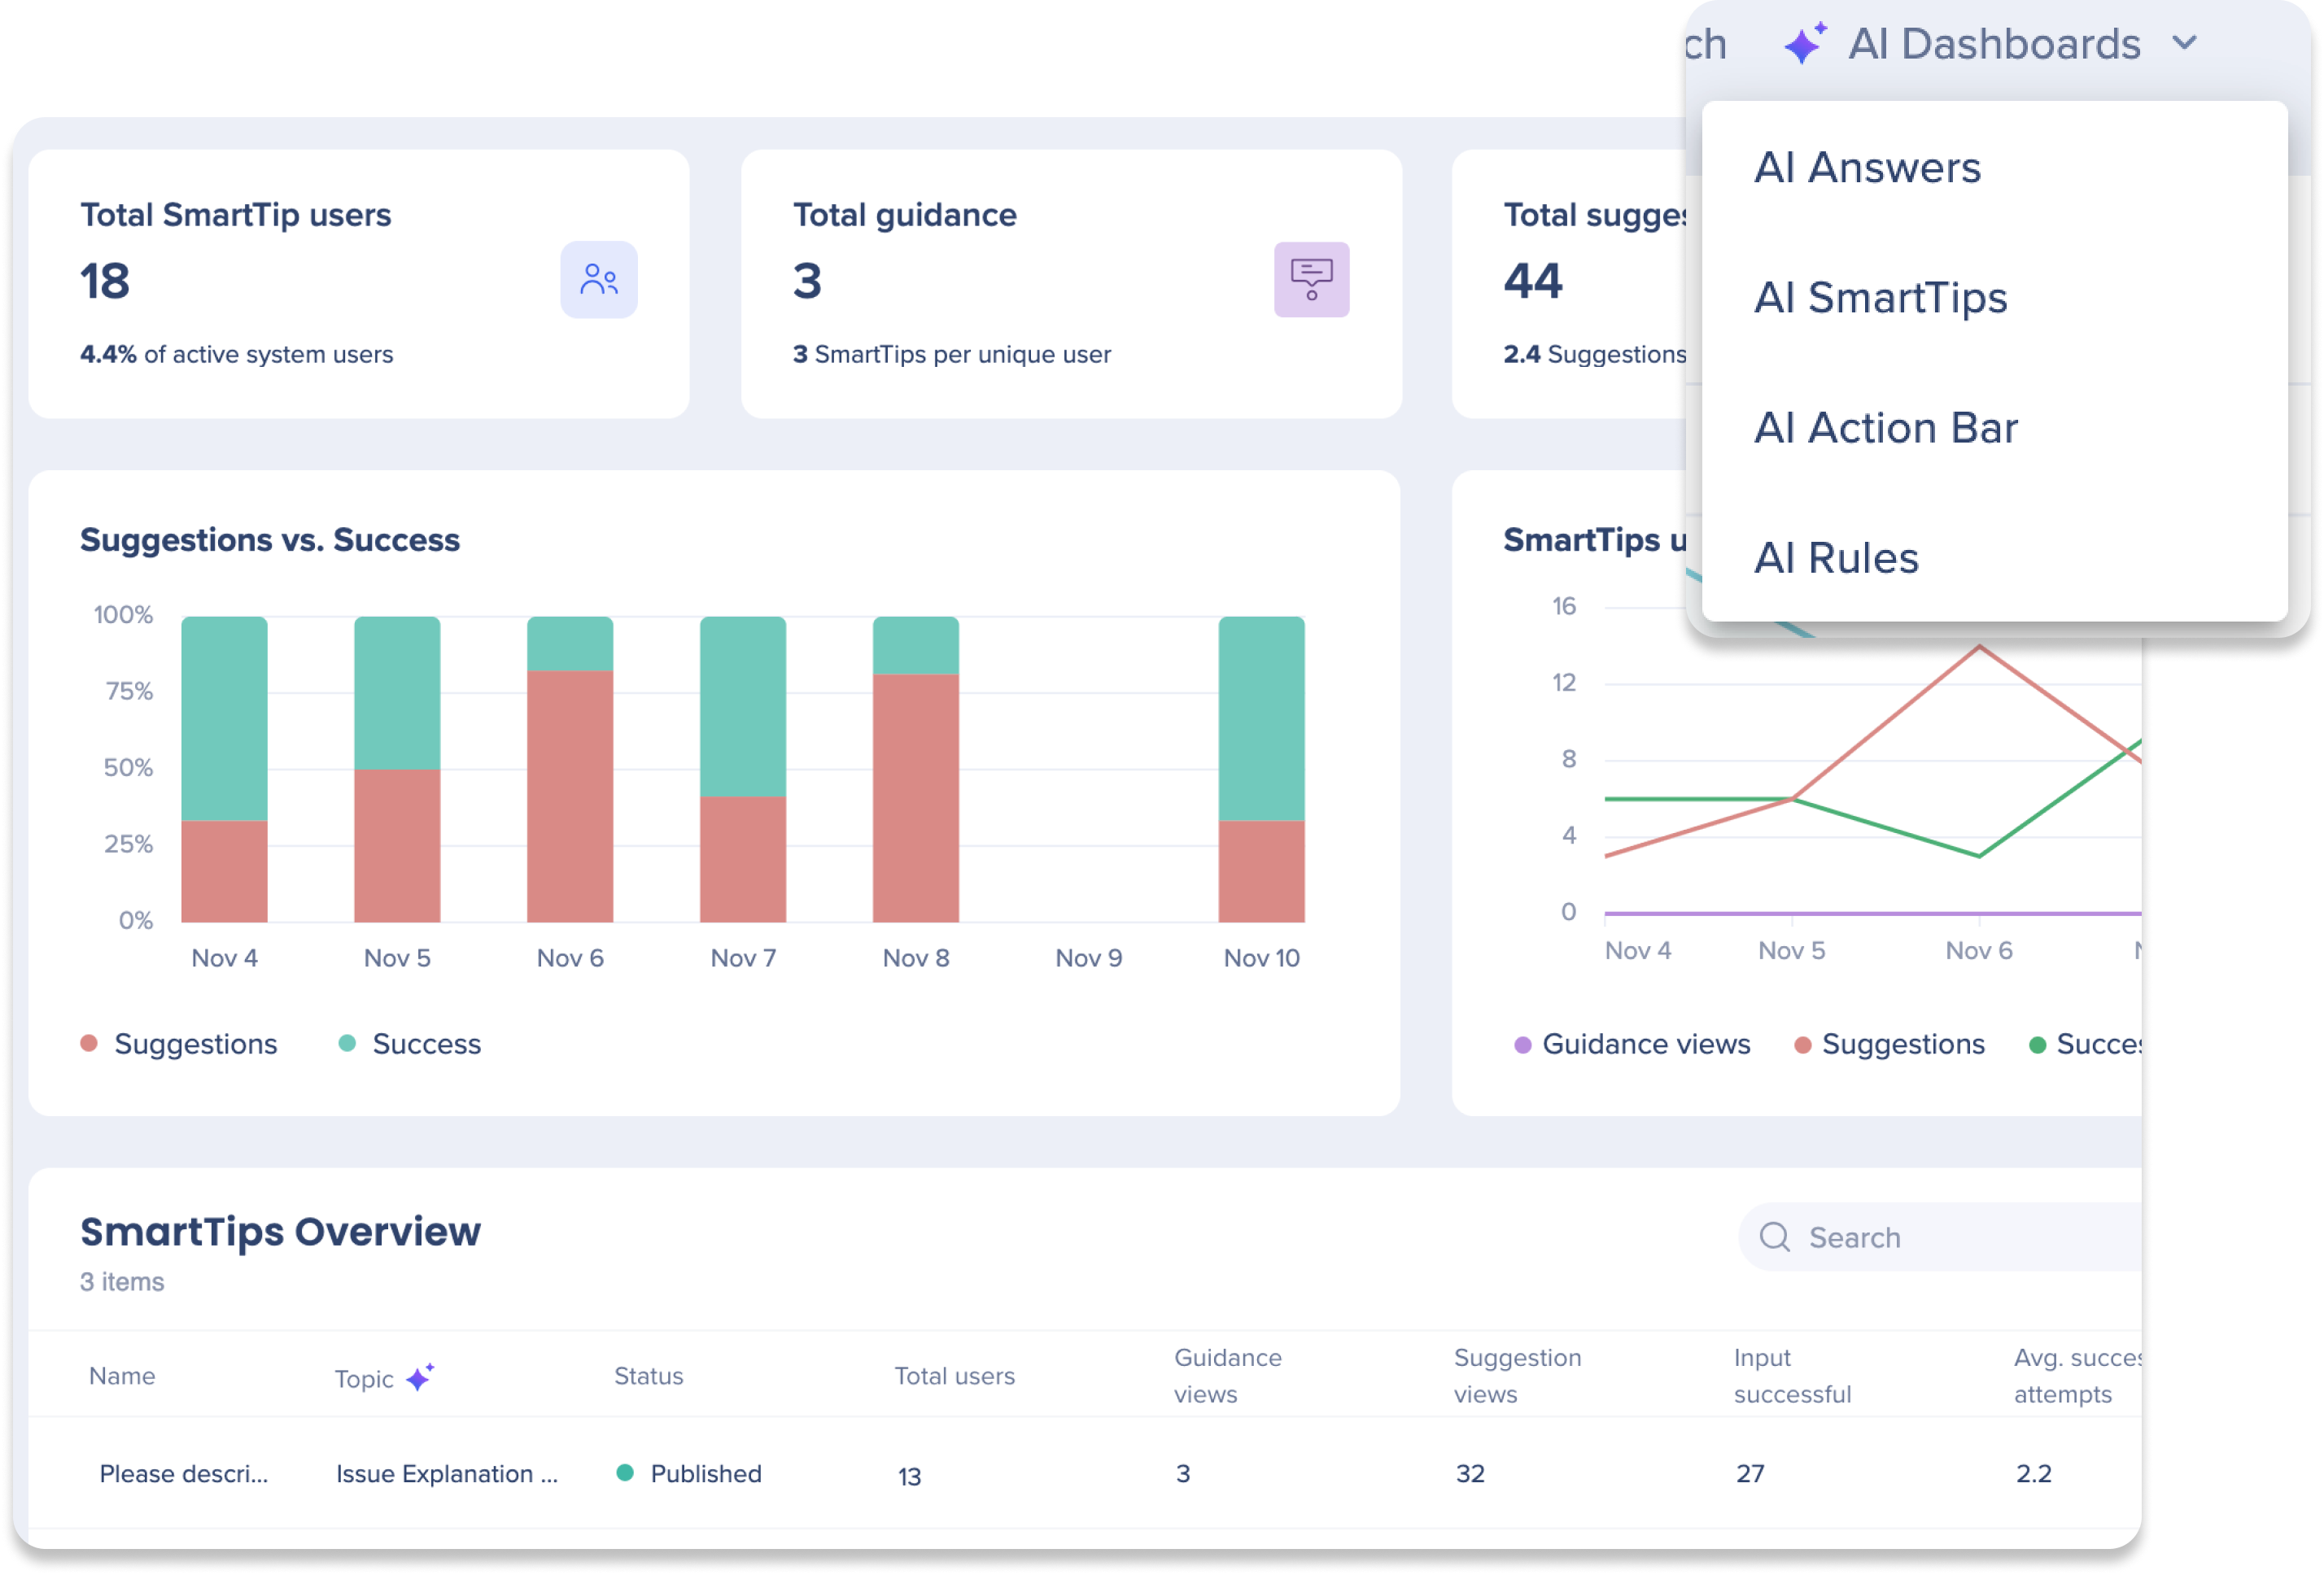
The AI Dashboards feature up to four tabs, each dedicated to a specific WalkMe AI product: AI Answers, AI Action Bar, AI SmartTips, and AI Rules. Each dashboard is composed of widgets to analyze and visualize data from WalkMe's AI features at the system level.
AI Answers Dashboard
General metrics
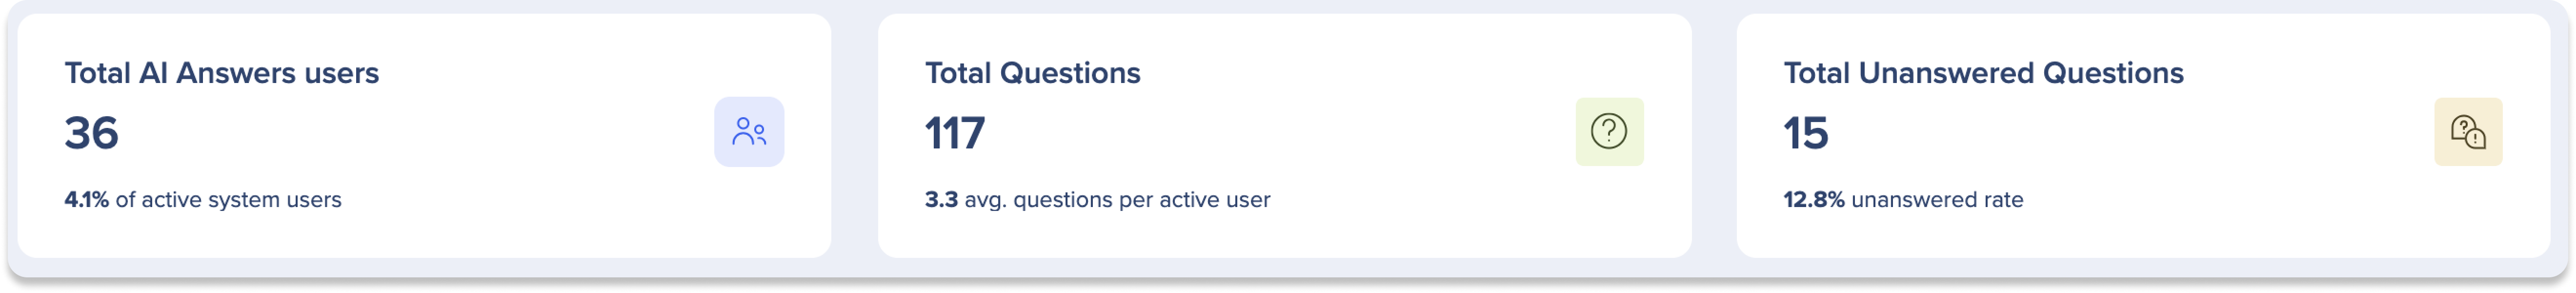
Track user interaction, AI response frequency, and identify failed response frequency to understand AI usage and issues.
-
Total users: Total number of unique users who asked a question and received an answer in AI Answers
-
Total questions: Total number of answers questions, excluding those where the user did not provide a response
-
Total unanswered questions: Total number of times AI Answers couldn't respond to user's question due to lack of knowledge sources or unclear query
Users vs. Questions
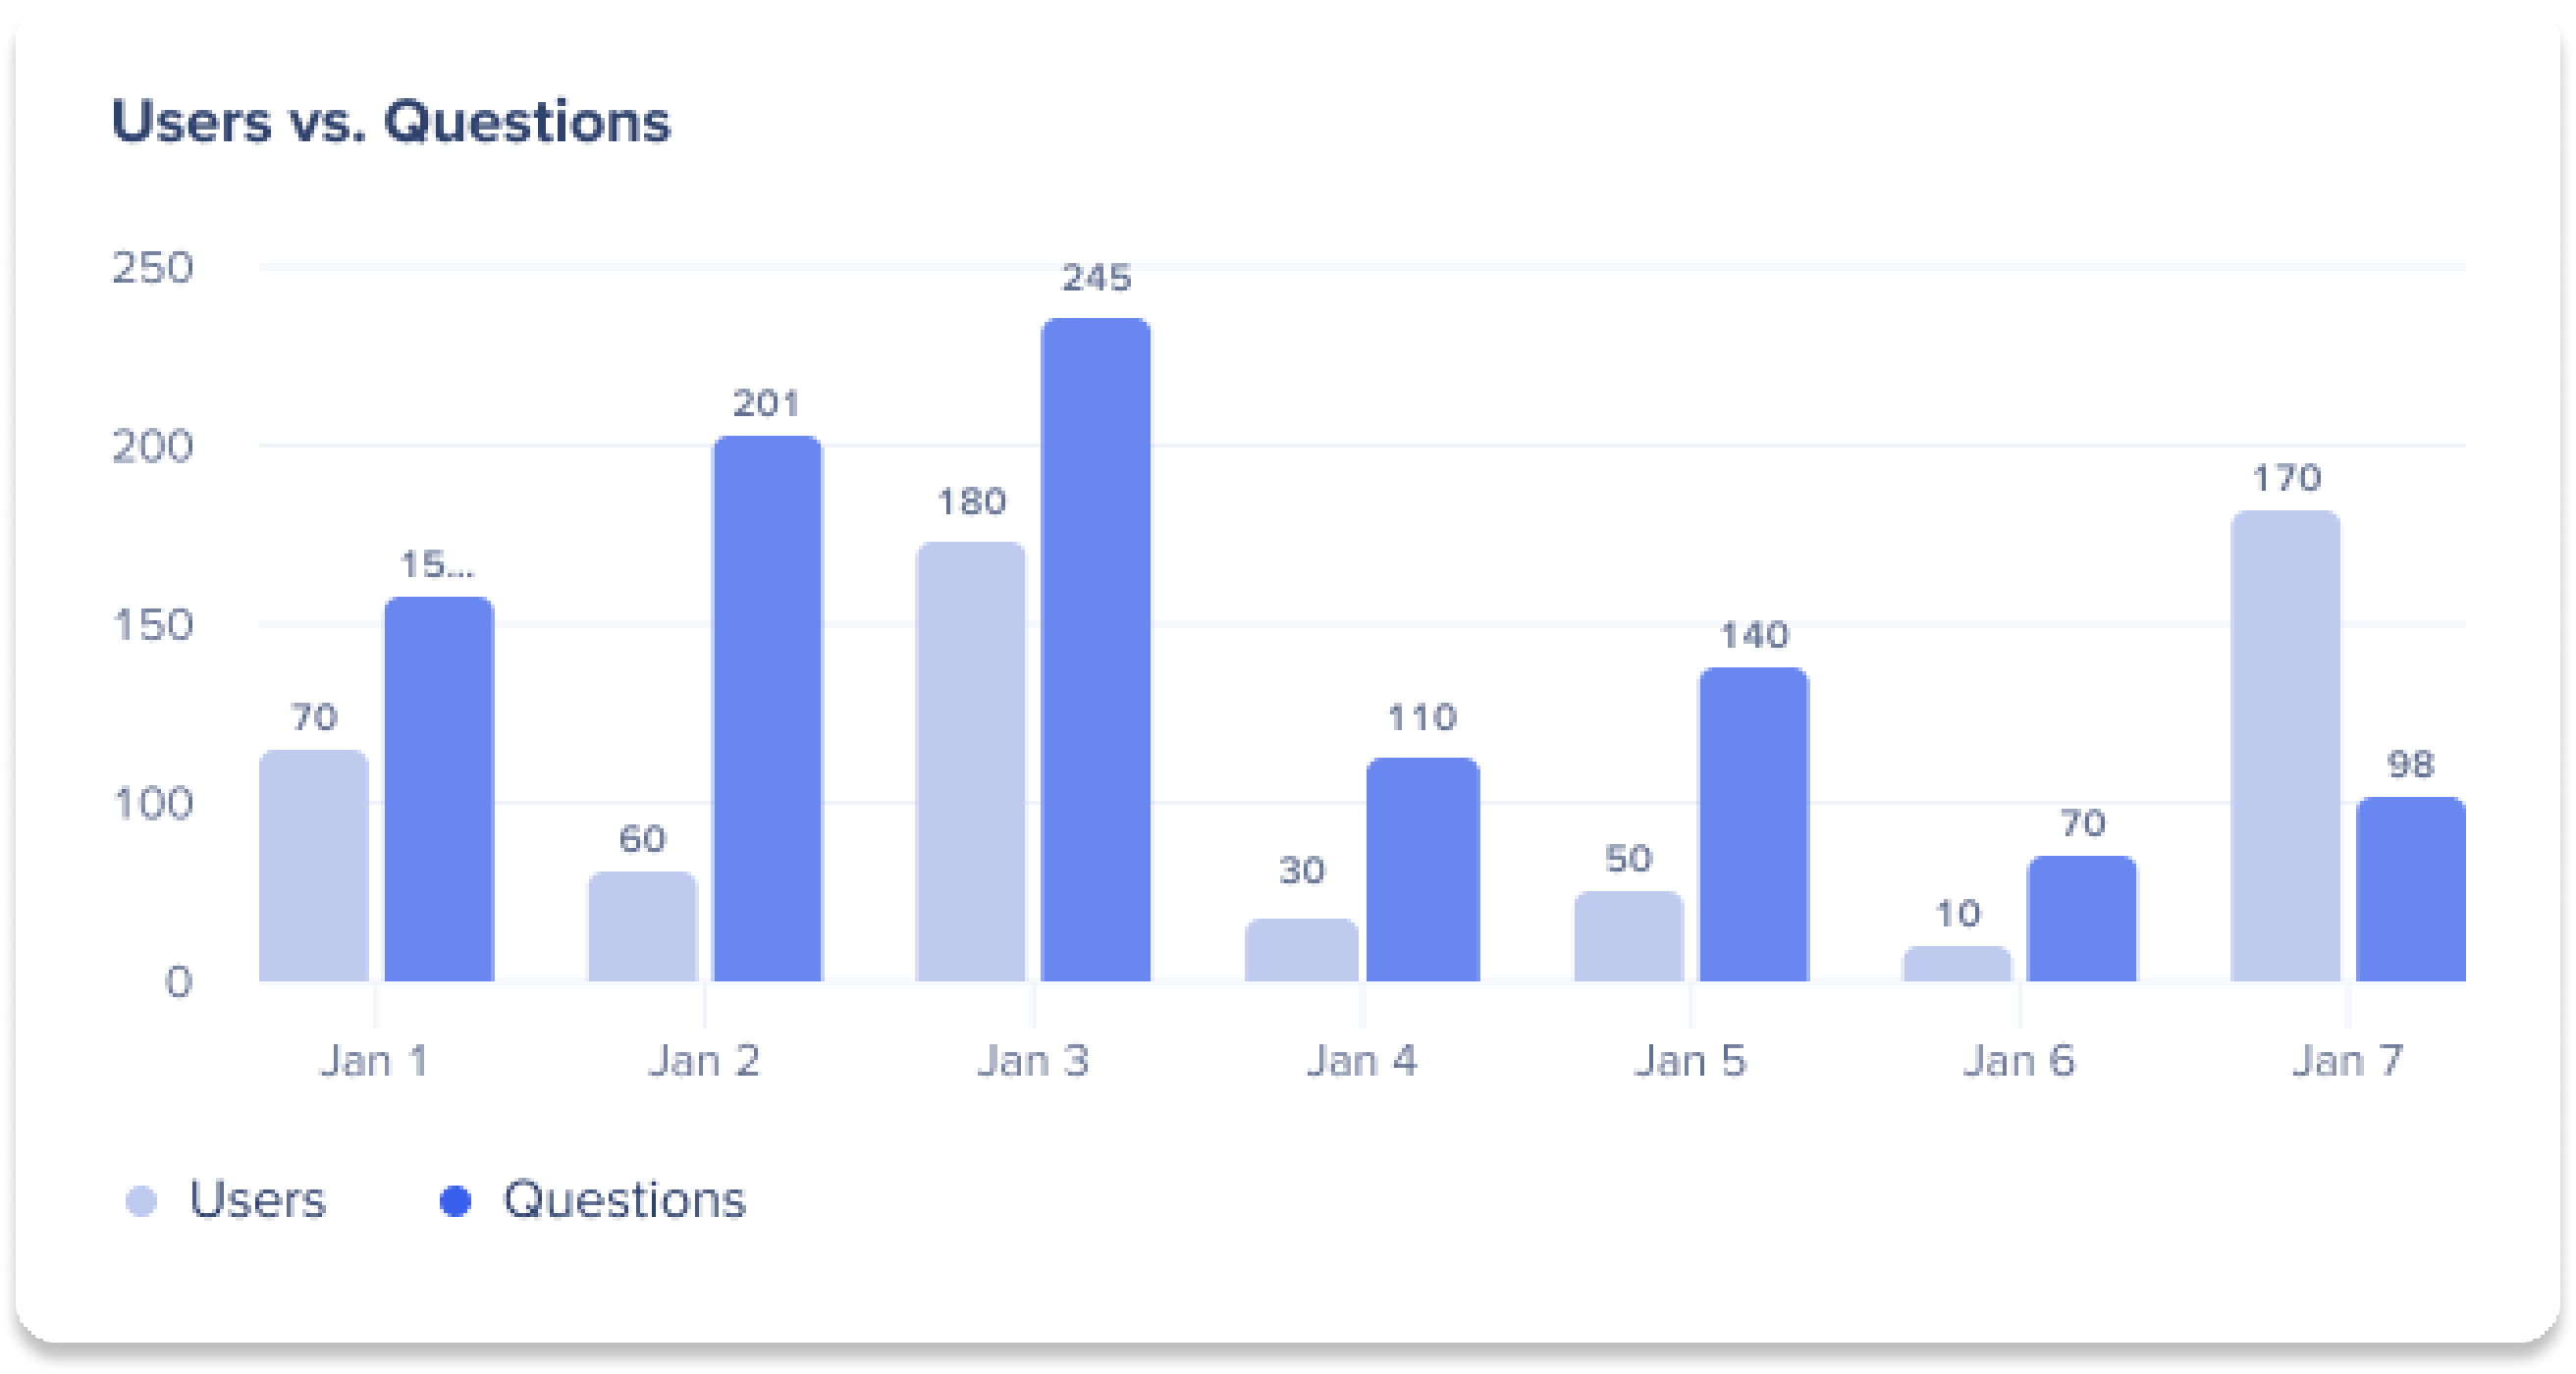
Track the total number of questions and users over time to understand usage trends.
Hover over a date in the graph to see the exact number of users and questions for that time.
Most popular topics
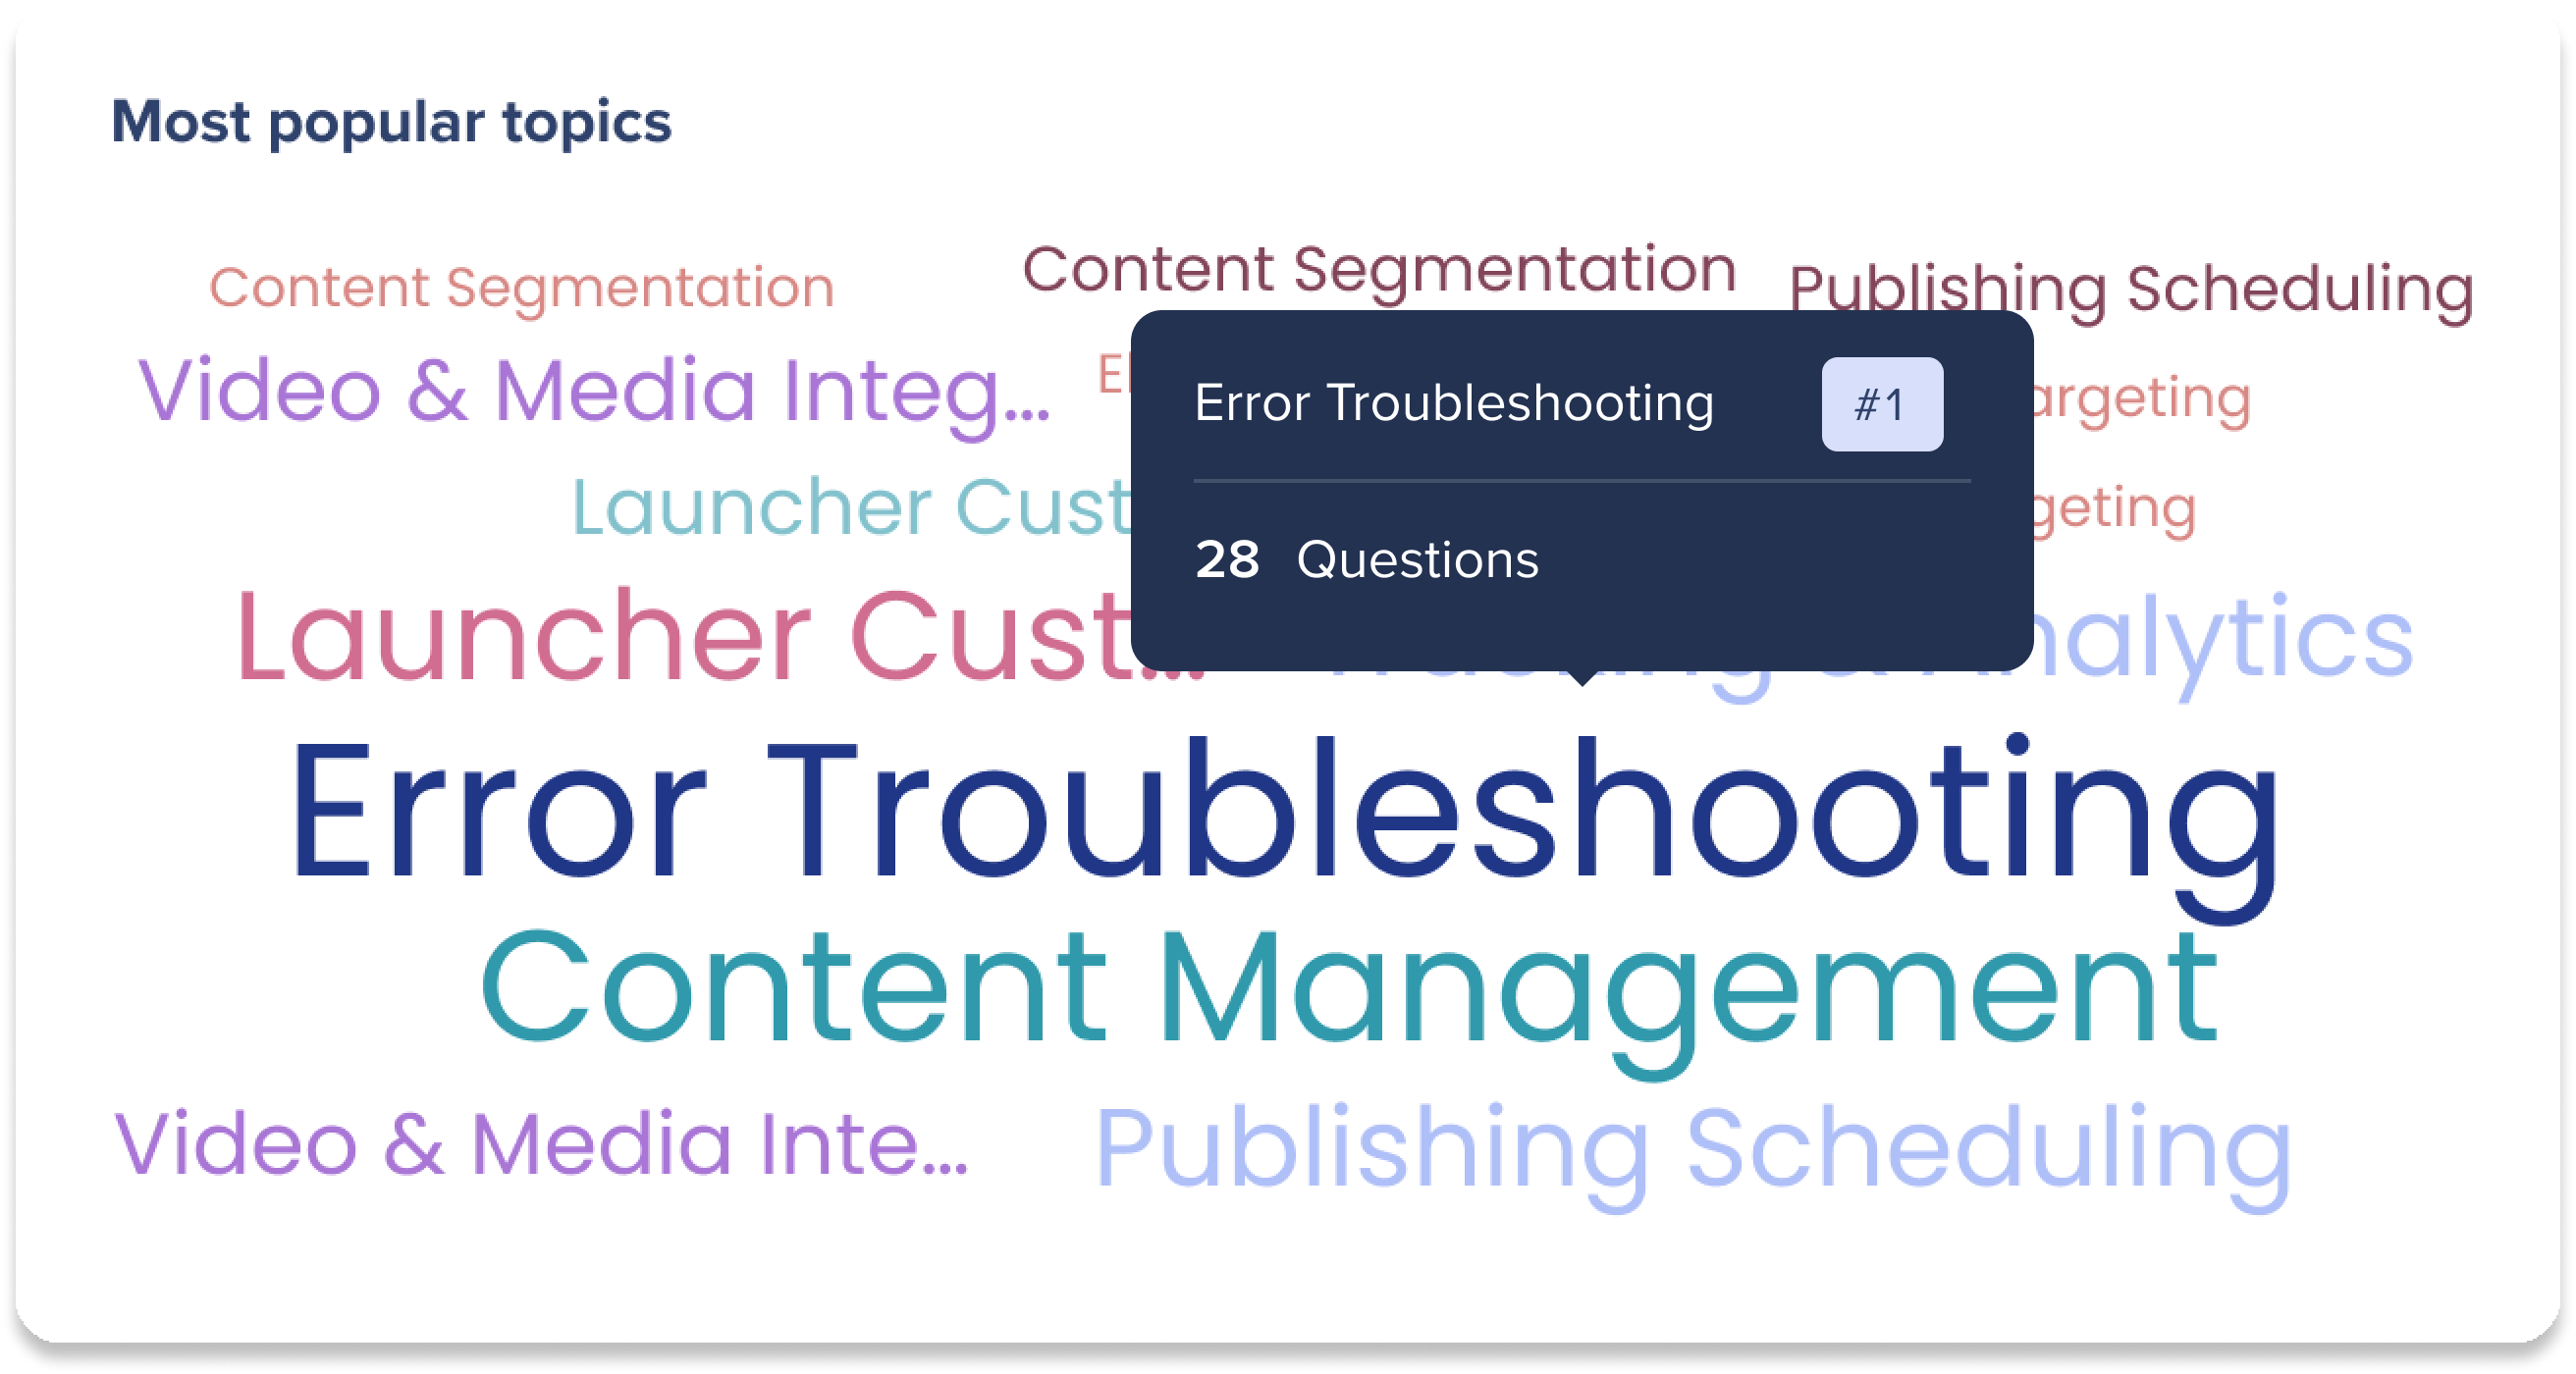
View a word cloud to see which topics users need help with.
Topics overview
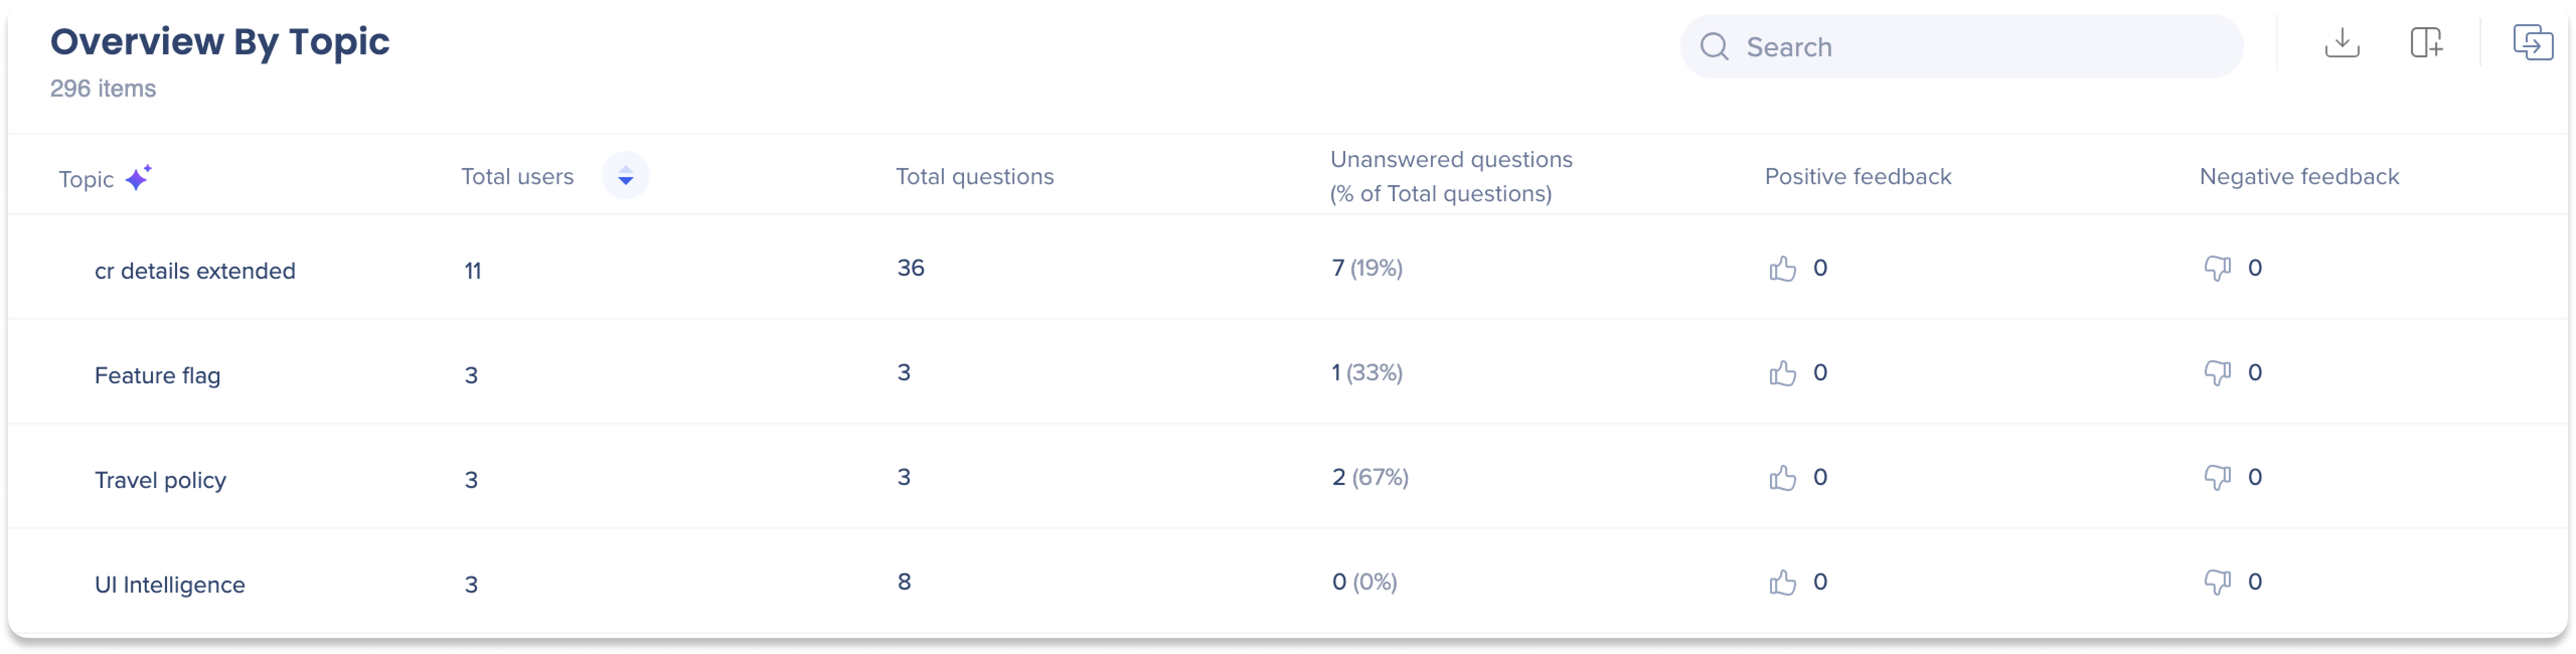
View a summary table of users, questions, and chats to understand usage per topic.
-
Topic: A list of AI-generated topics based on all user chats, providing an overview of common themes discussed during interactions with AI Answers
- Please remember that AI-generated content may be incorrect
- Total users: Total number of unique users that had a question that contained this topic
-
Total questions: Total number of questions containing this topic
-
Failed answers: Total number of failed answers related to the this topic
-
Positive feedback: Total positive feedback clicks for this topic
-
Negative feedback: Total negative feedback clicks for this topic
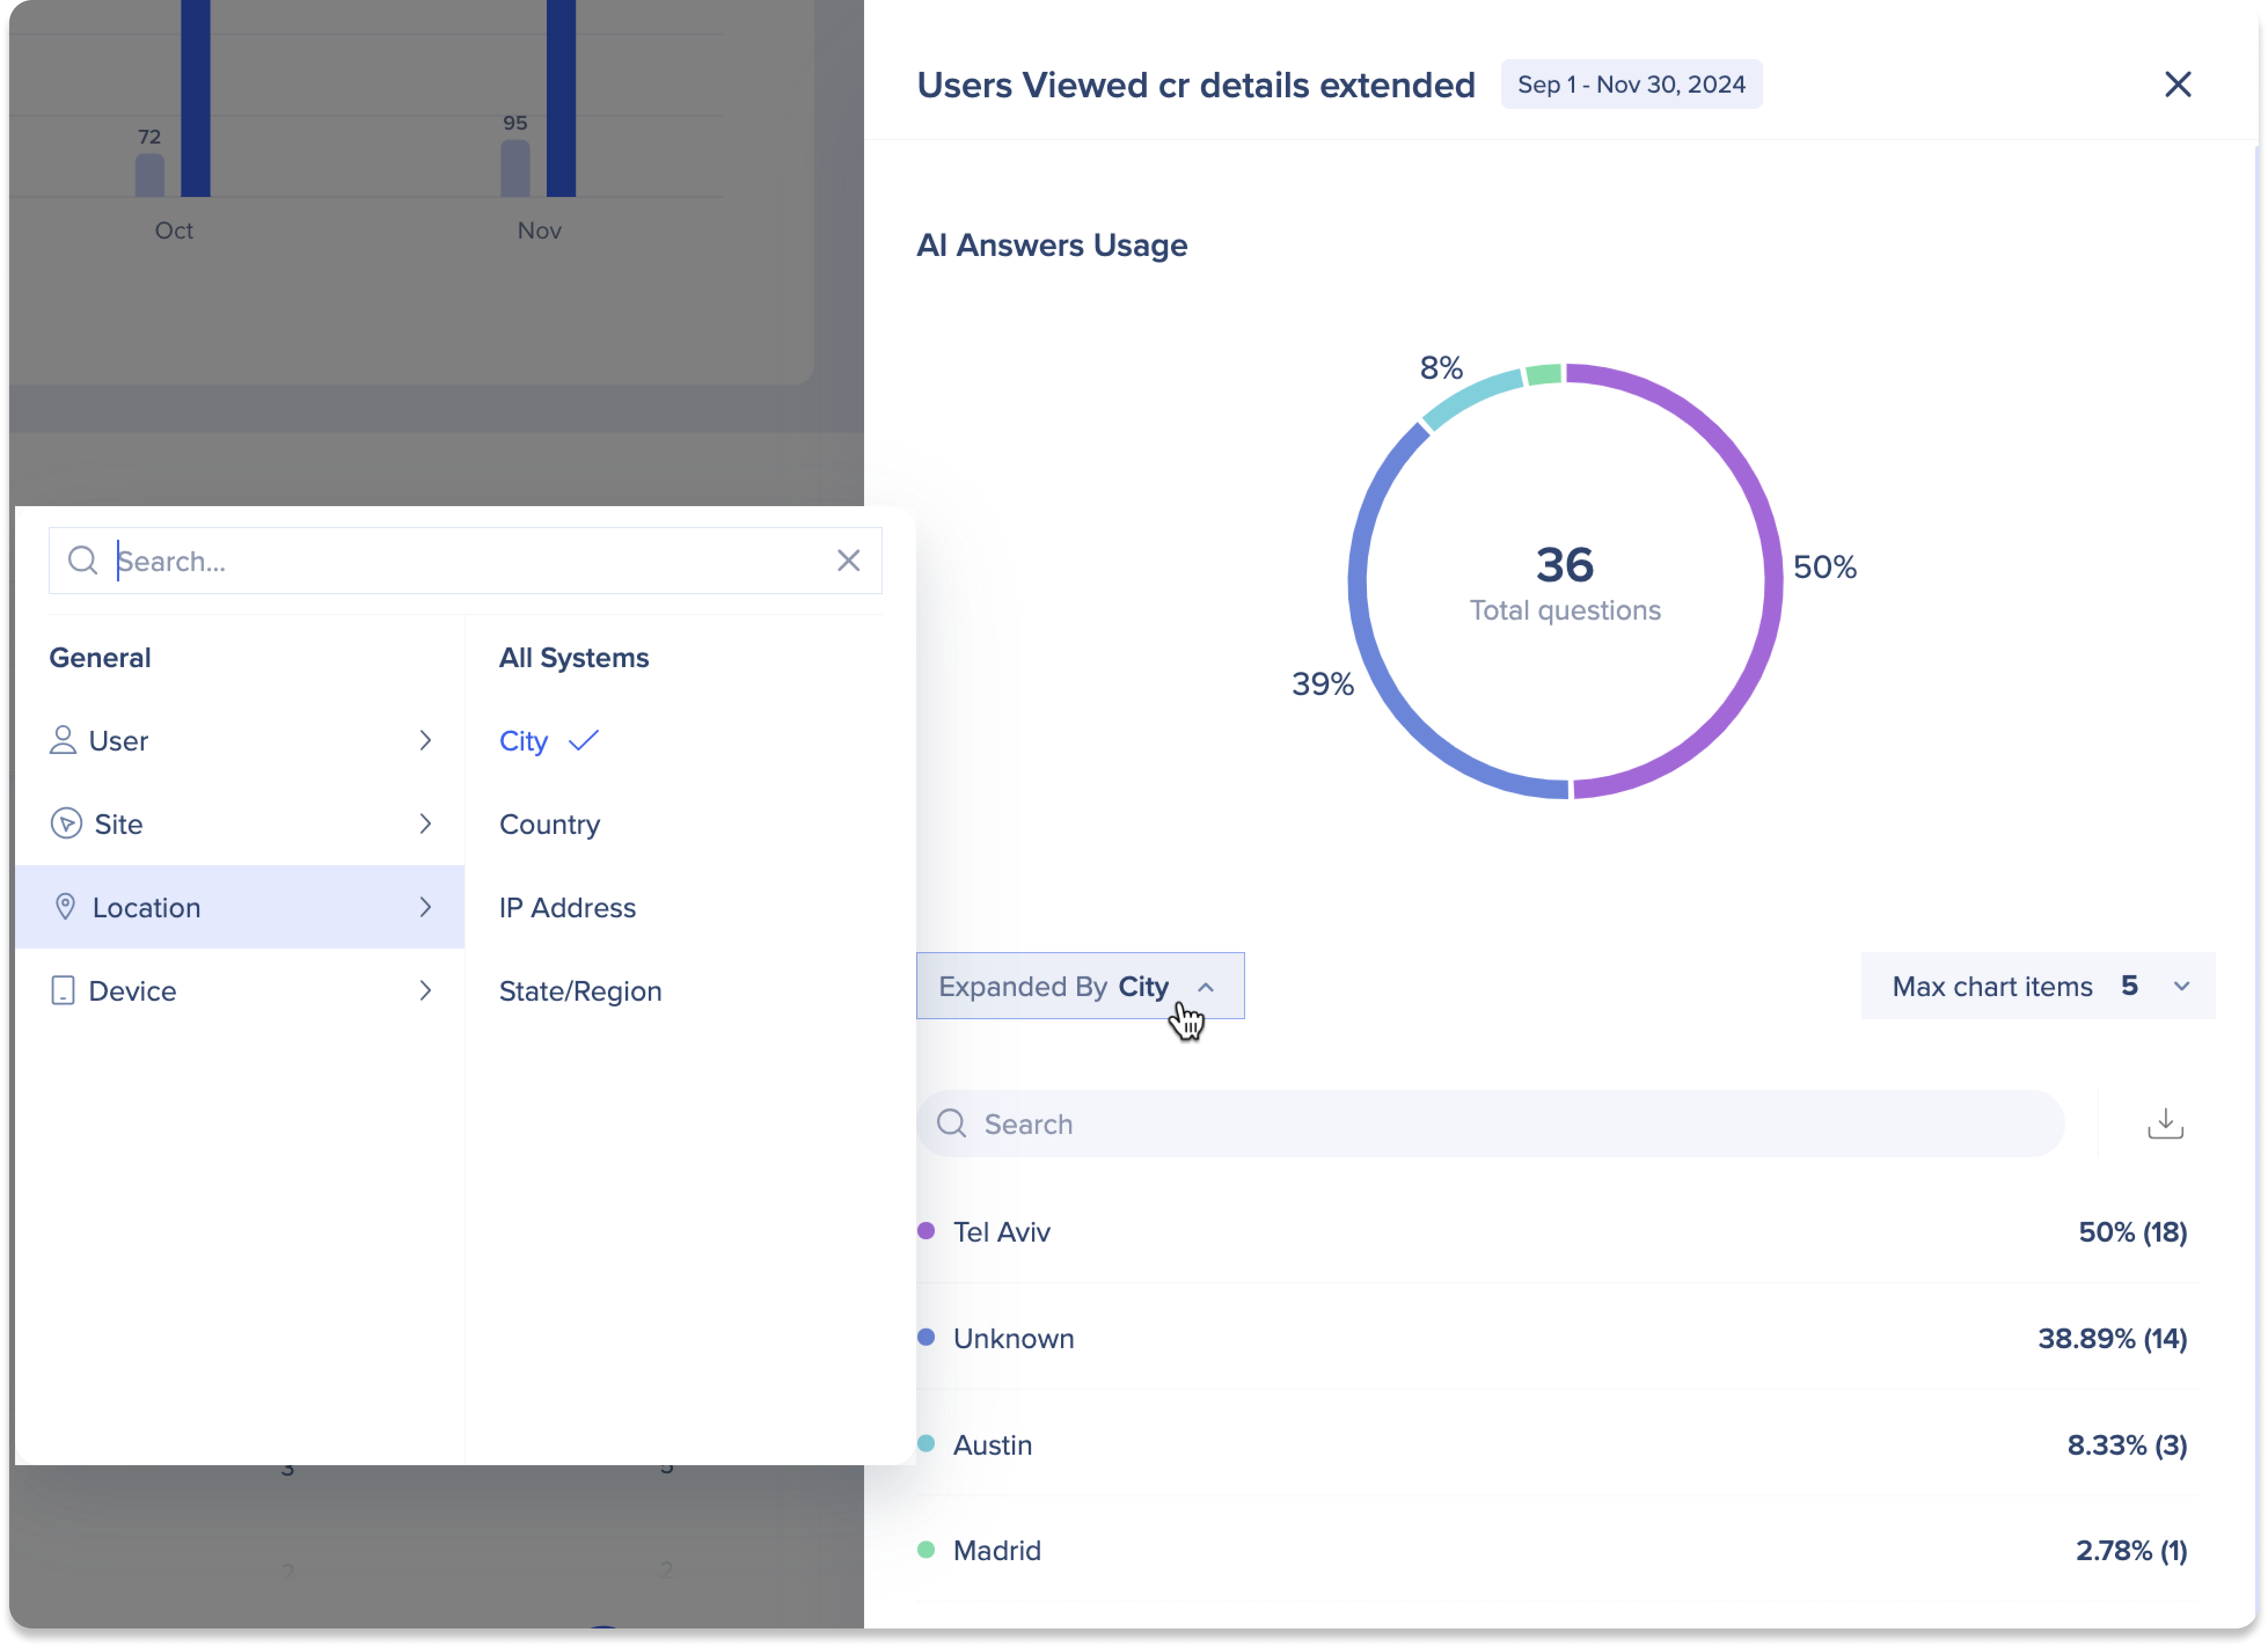
Topic deep dive
Click the total users number in the table to view a pie chart showing the total users and the percentage of unique users who asked questions about that topic.
AI Action Bar Dashboard
User analysis funnel
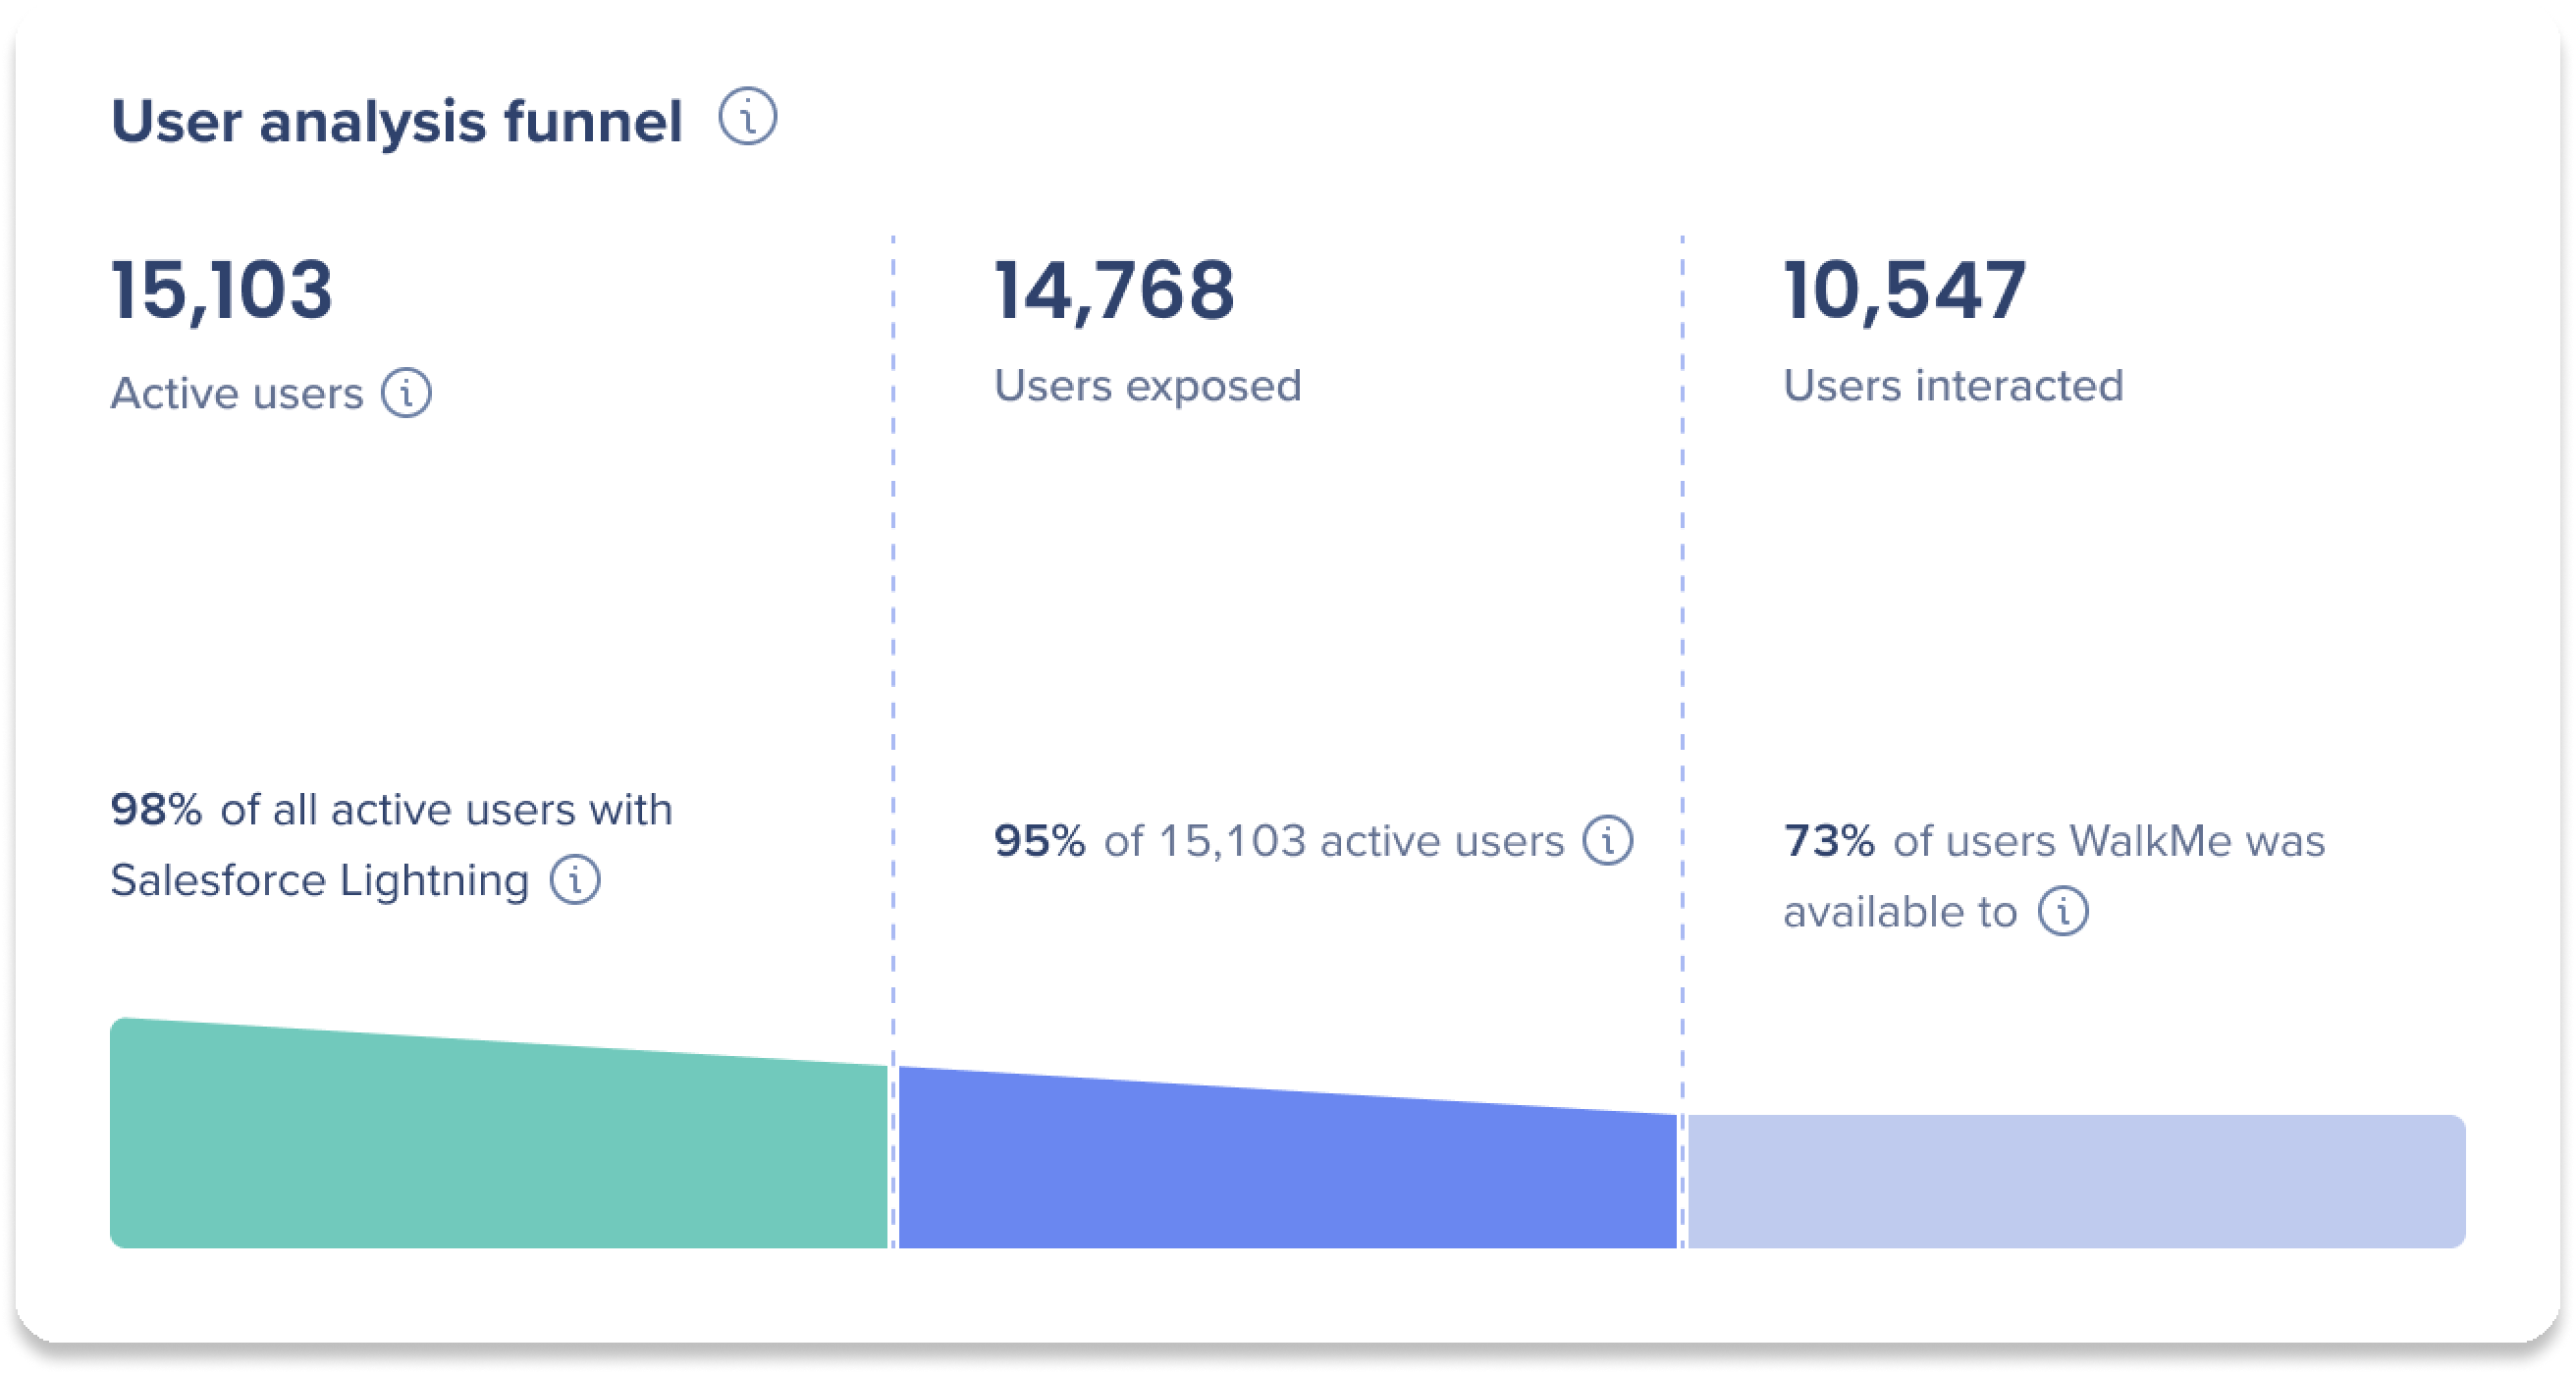
View a summary of active users, exposures, and interactions for quick insights into Action Bar usage.
-
Active users: The number of users who visited the system while WalkMe was loaded, regardless of interacting with a WalkMe item
-
 Users exposed: The number of unique users who were shown the Action Bar widget on screen
-
Users interacted: The number of unique users who clicked a Launcher in the Action Bar
-
Examples of Action Bar actions: generating suggestions, inserting generated text, asking follow-up questions, opening the Pro menu, creating a custom action… etc
Hover over the widget to view more metrics:
-
% of all active users within a system: Calculated by the total number of users with WalkMe loaded / total active WalkMe for MSA (Multi-system account)
-
% of total active users: Calculated by the total number of users who saw the Action Bar widget / total active users
-
% of users WalkMe was available to: Calculated by the total number of users who used an Action Bar action / total users who had Action Bar available to them
User adoption trend
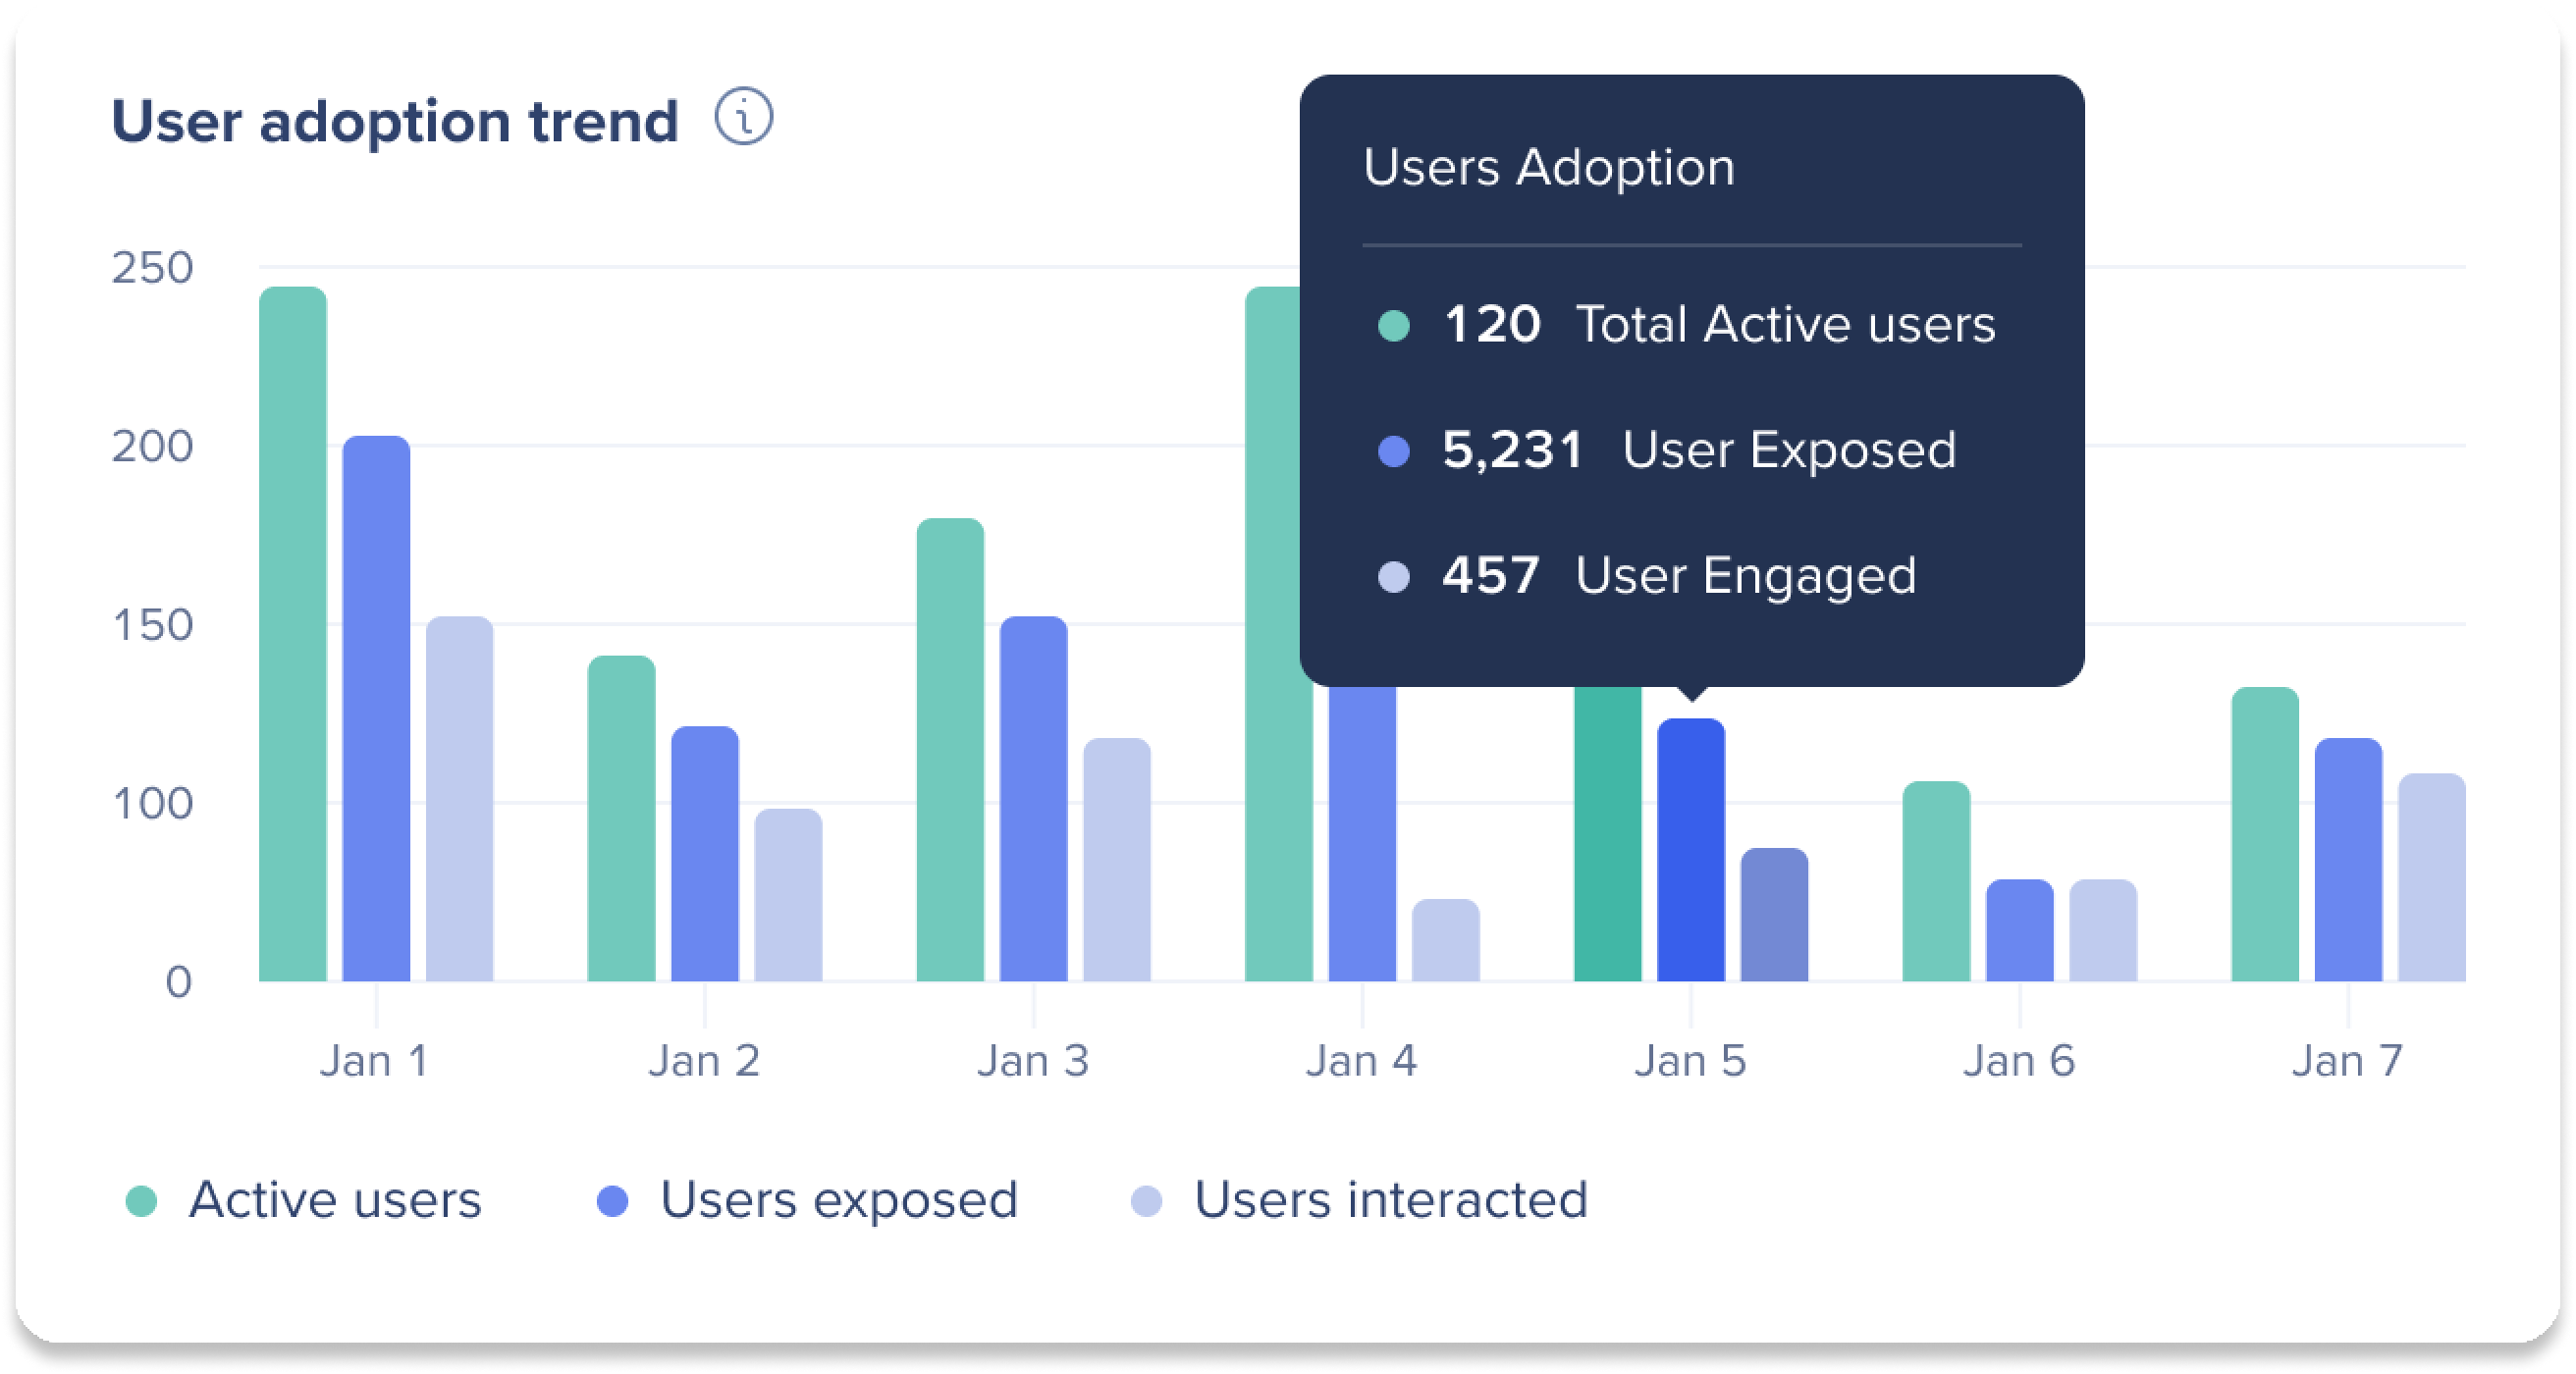
Track the total number of active users, exposures, and interactions over time to understand usage trends.
-
Active users: The number of users who visited the site while WalkMe was loaded, regardless of interacting with a WalkMe item
-
Users exposed: The number of unique users who were shown the Action Bar widget on screen
-
Users interacted: The number of unique users who used or opened an Action Bar action
Hover over a date in the graph to see the exact number of active users, users exposed, and users engaged for that time.
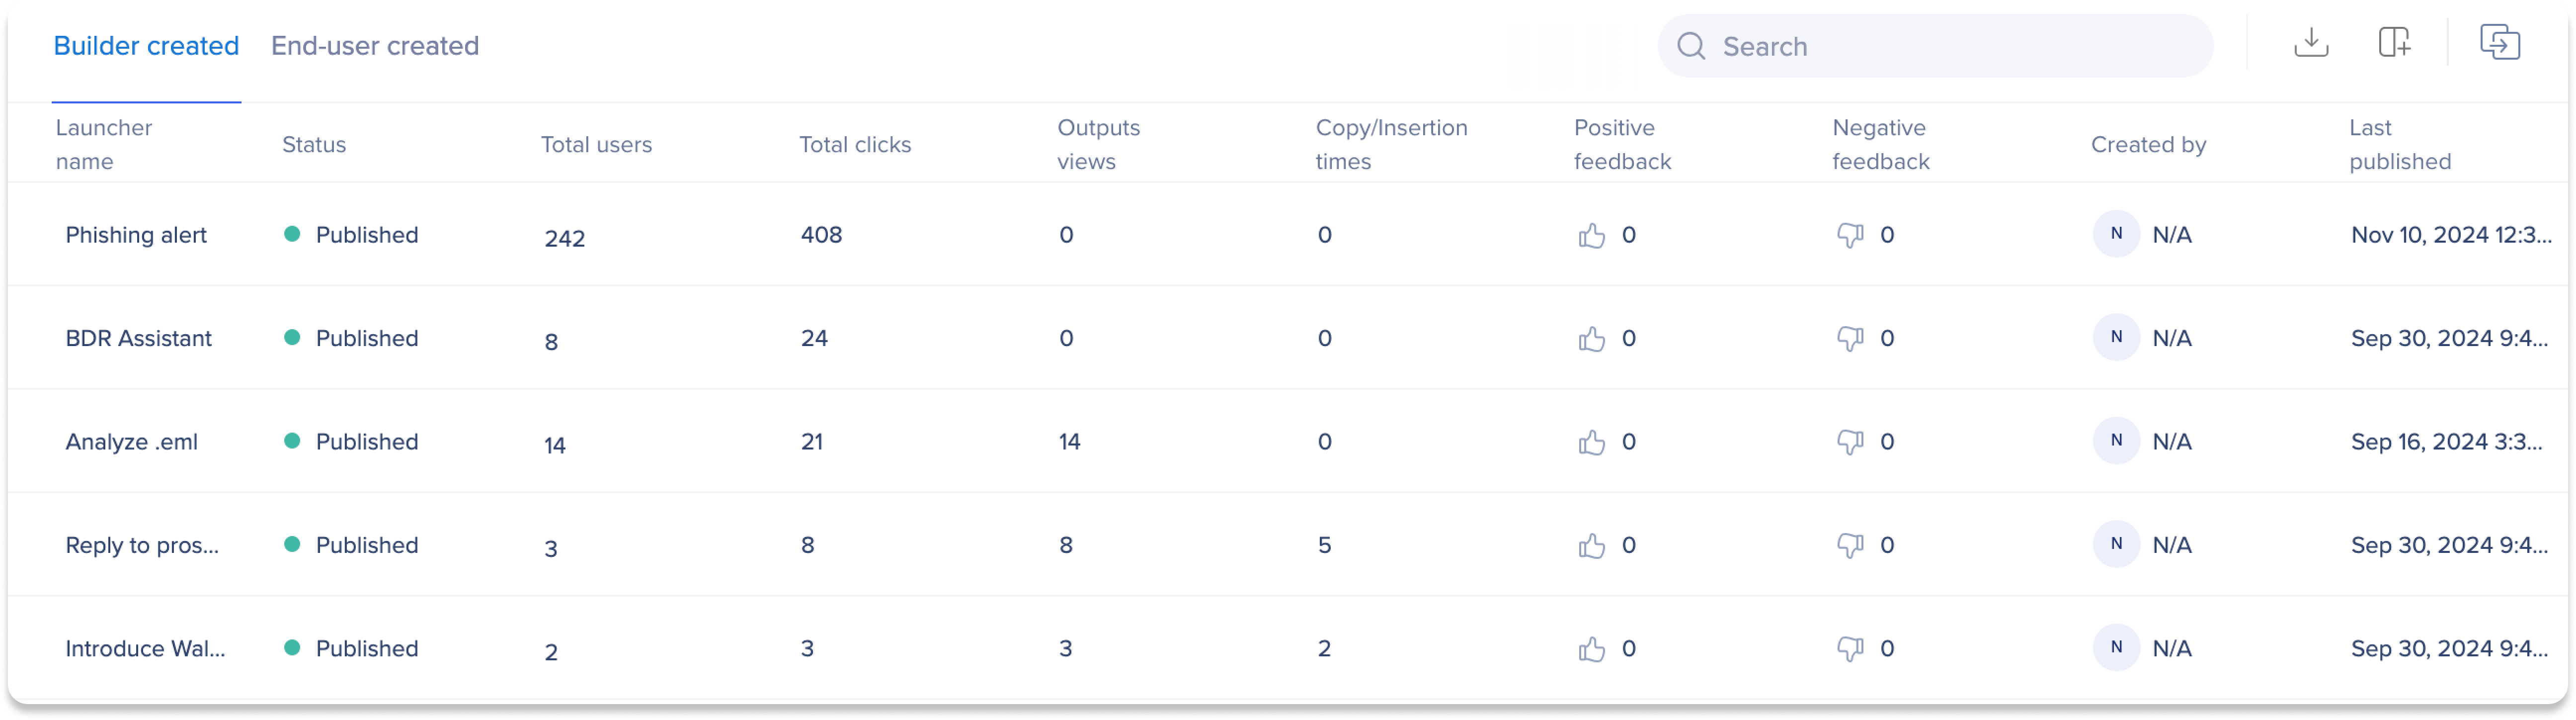
Launchers overview
View a summary table of all Action Bar launchers for detailed usage insights.
The table offers two different view:
-
Builder created: Includes out-of-the-box launchers and launchers created by the WalkMe builder in the console
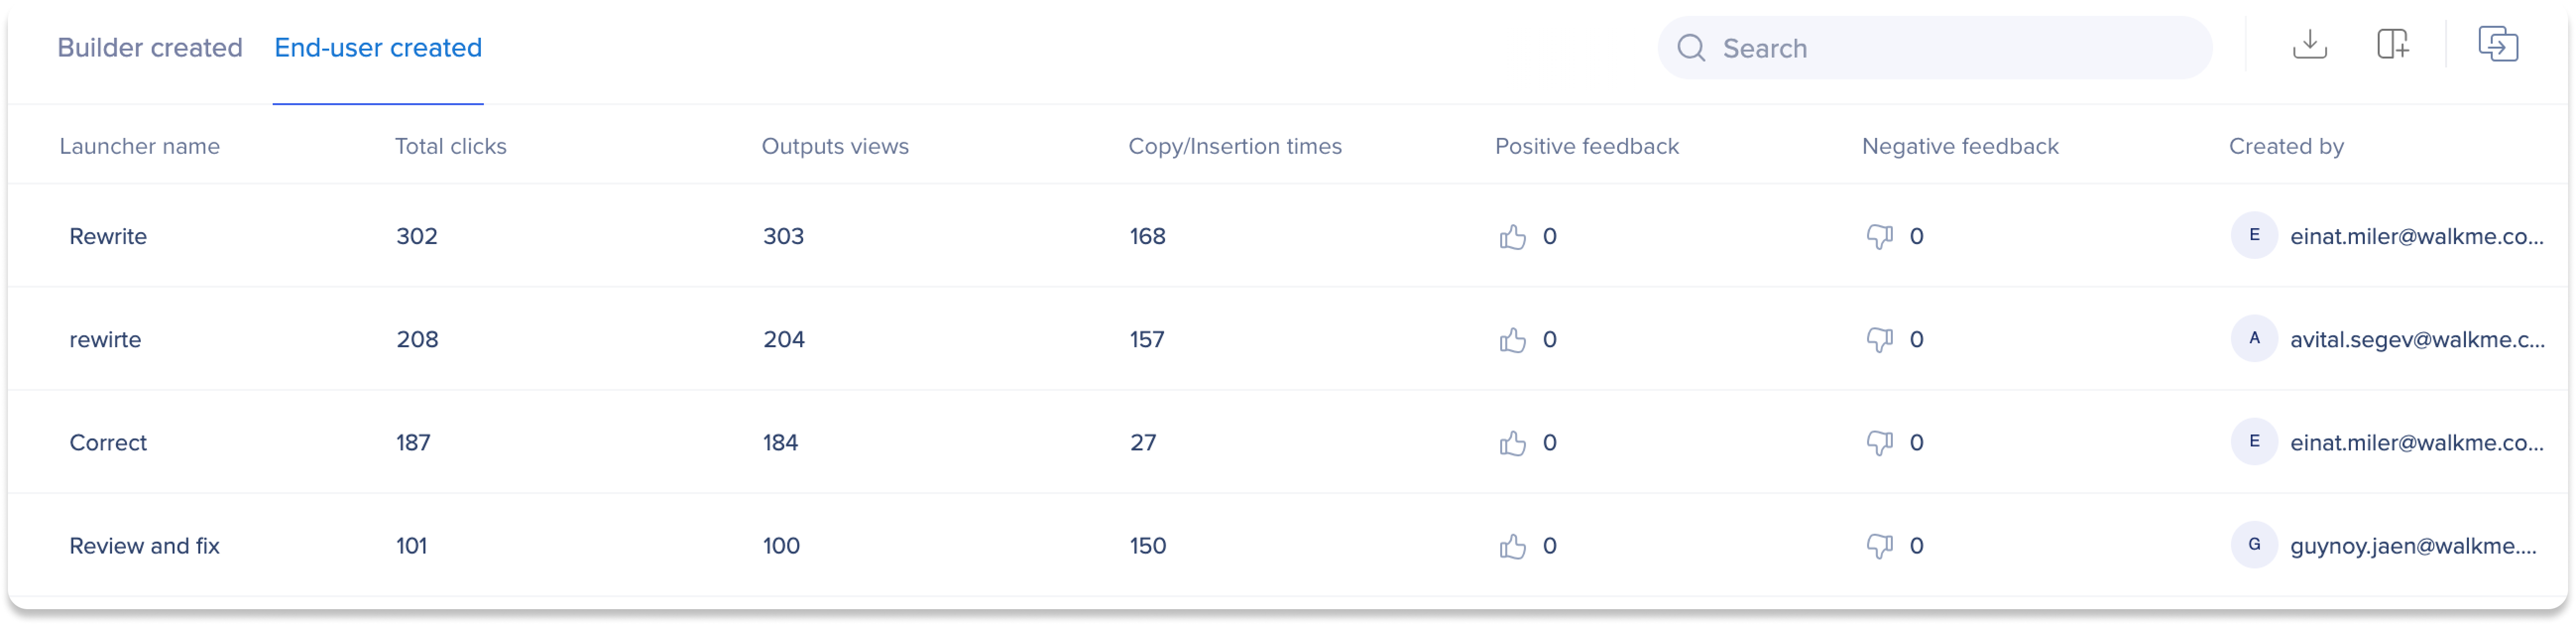
-
End-user created: Includes launchers created by end-users via create custom actions in the Action Bar
Change the view by selecting an option from the dropdown.
Table metrics for Builder created view
-
Name: Name of the launcher
- Status: The current state of the launcher's publication
- Green: Published - The item is live and available to users
- Grey: Archived - The item is no longer active but kept for record-keeping
- Red: Deleted - The item has been removed and is no longer available
- Orange: Draft - The item is still in development and not yet published
-
Total users: The total number of users who viewed this launcher
-
Total clicks: The total number of times this launcher was clicked
-
Outputs views: The total number of outputs created by this launcher (the generated output must be fully displayed to count)
-
Copy/insertion times: The number of times a generated output was copied/inserted by the user from this launcher
-
Positive feedback: The user clicked the positive feedback icon for this launcher
- Negative feedback: The user clicked the negative feedback icon for this launcher
- Created by: User that created the launcher
- Last published: Date when the launcher was last published
Table metrics for End-user created view
-
Name: Name of the launcher
-
Total clicks: The total number of times the user clicked on this launcher
-
Output views: The total number of outputs created by this launcher (the generated output must be fully displayed to count)
-
Copy/insertion times: The total number of times the output was copied or inserted
-
Positive feedback: The user clicked the positive feedback icon for outputs generated by this launcher
-
Negative feedback: The user clicked the negative feedback icon for outputs generated by this launcher
-
Created: The user that created the custom launcher
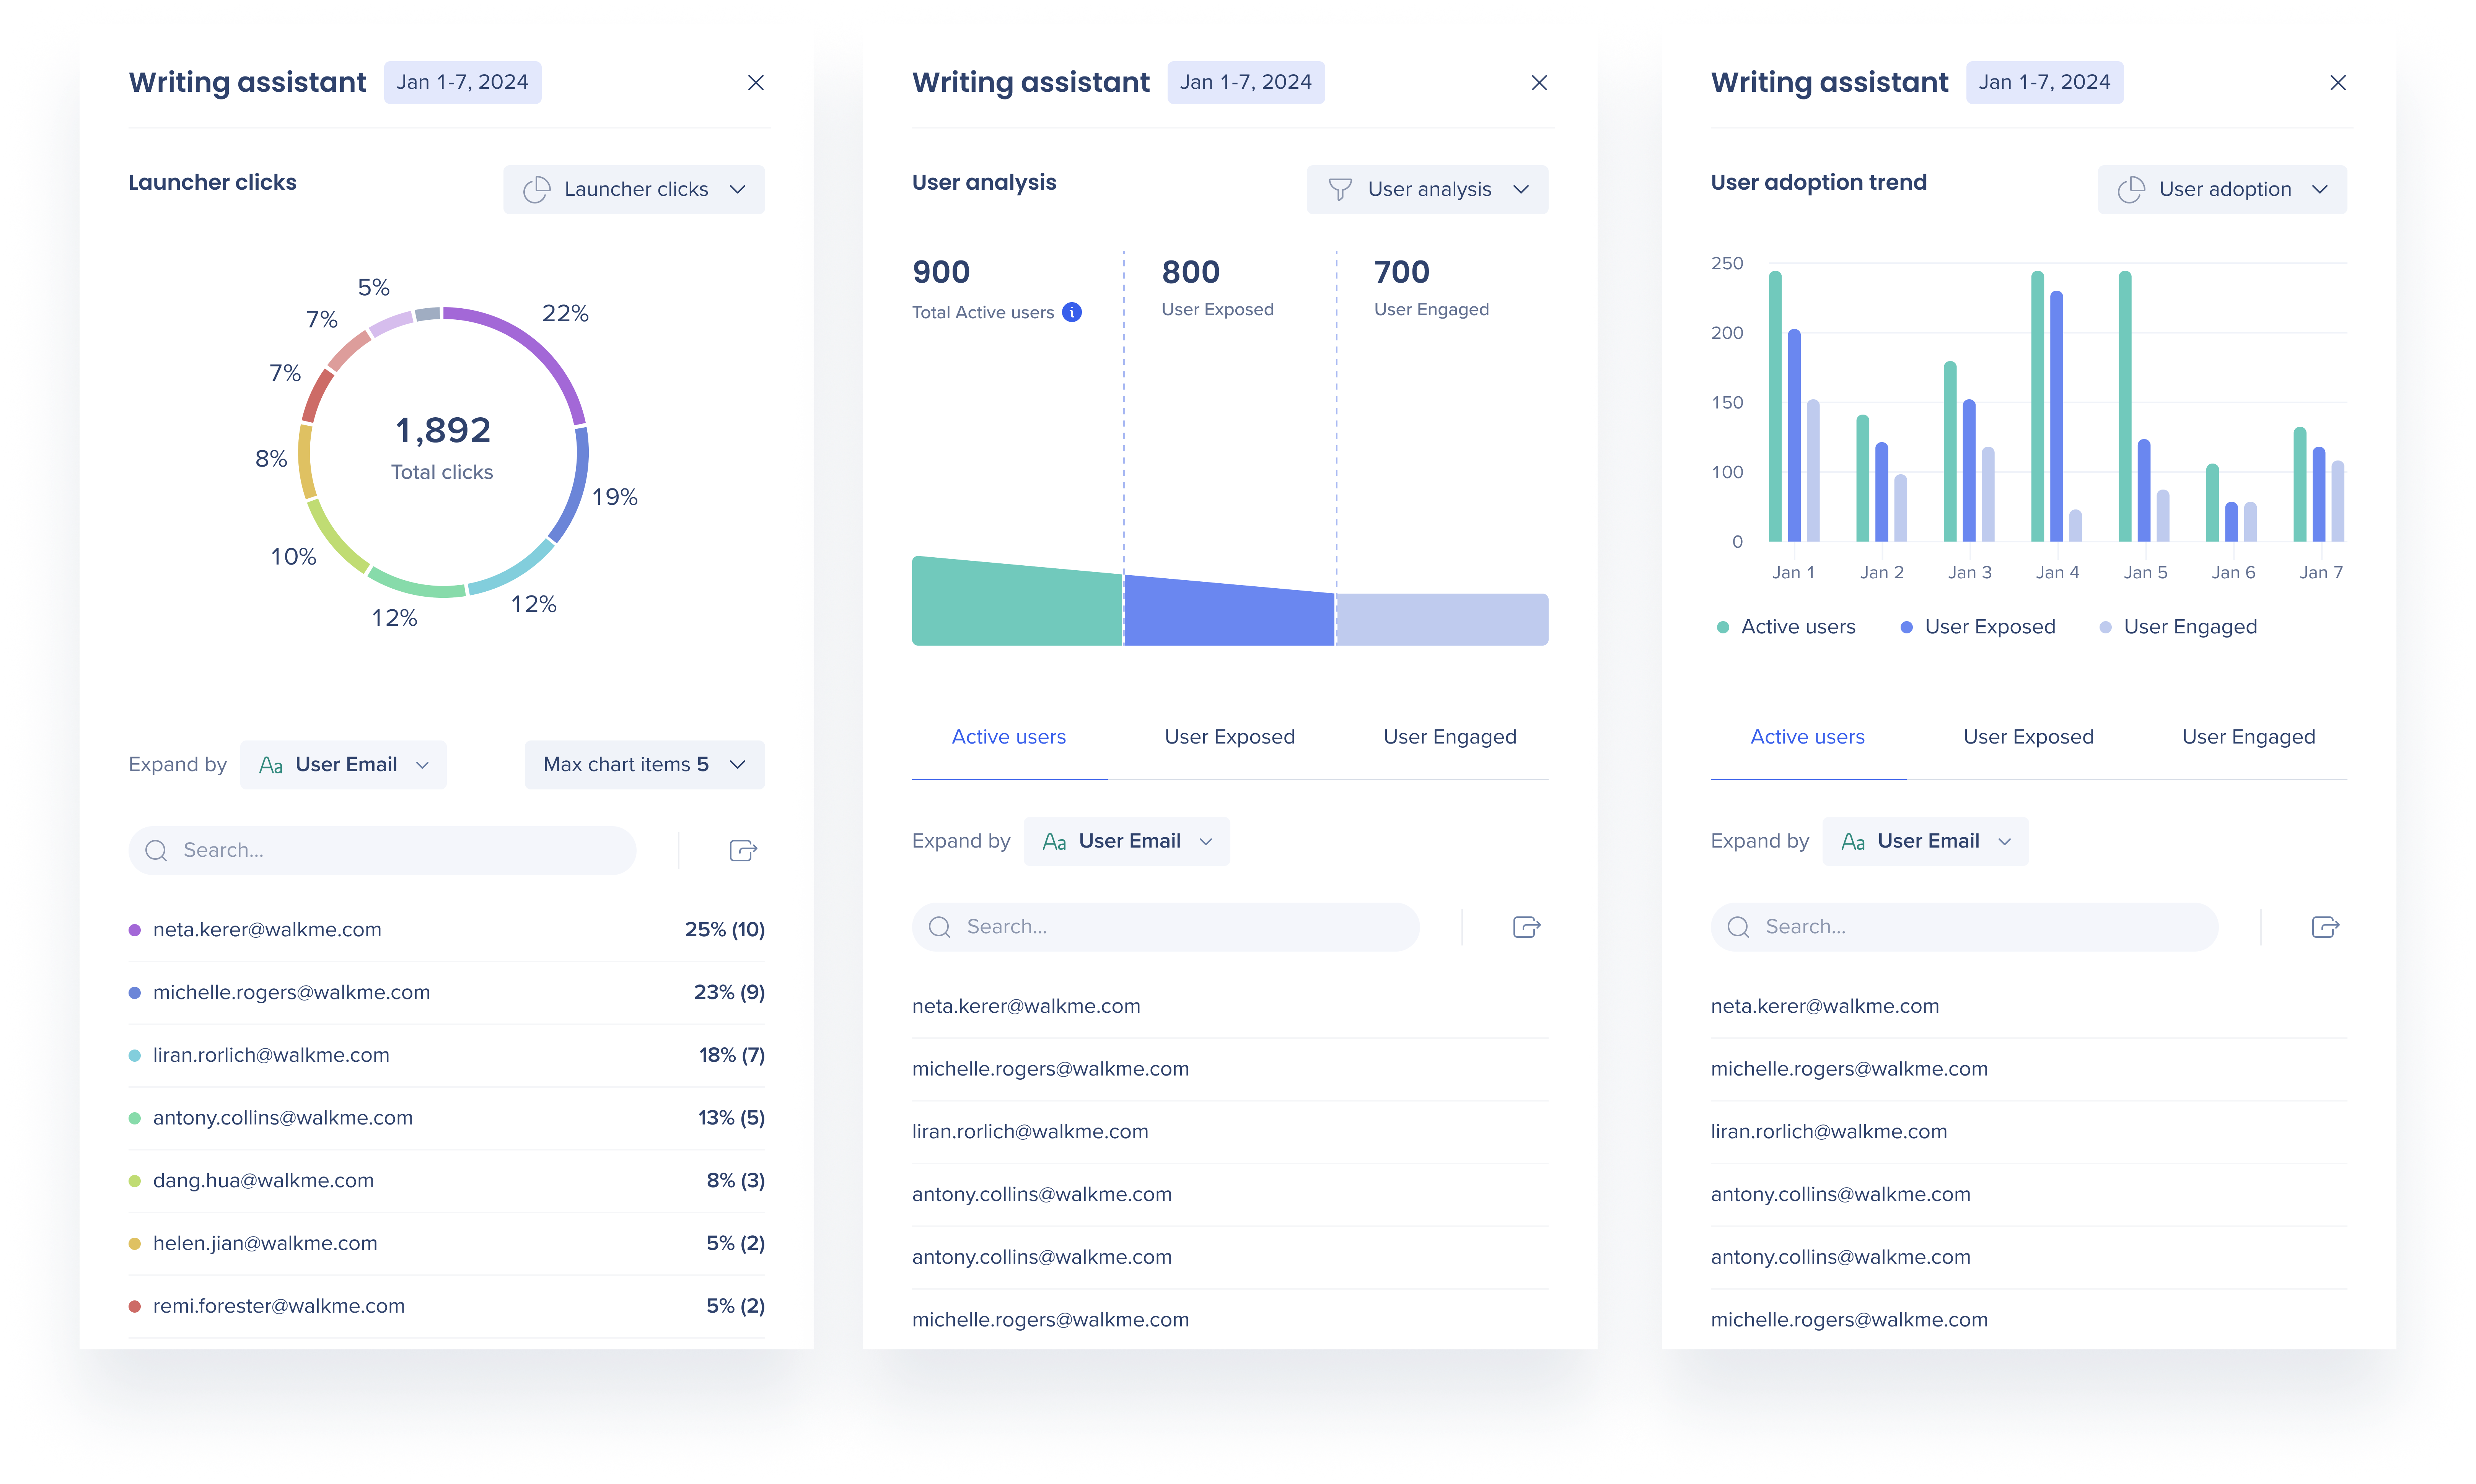
Launcher deep dive
Click the total users number from the table to open the deep dive side panel for more insights.
There are three different views for launchers: Launcher clicks, User analysis, and User adoption. Click the view dropdown to switch between views.
-
Launcher clicks: A pie graph displaying the total clicks on this launcher and the percentages of which unique user clicked the launcher
-
User analysis: View a summary of active users, exposures, and interactions for quick insights into a launcher's usage
-
User adoption trend: Track active users, exposures, and interactions over time to understand usage trends for a specific launcher
Writing assistant

-
 Total Writing Assistant users: The total number of unique users who were on the site while the Help me write button was available to them
-
Total Writing Assistant clicks: The total number of unique users who clicked the Help me write button in the action bar
-
Total Writing Assistant outputs: The total number of outputs produced by the writing assistant
AI SmartTips Dashboard
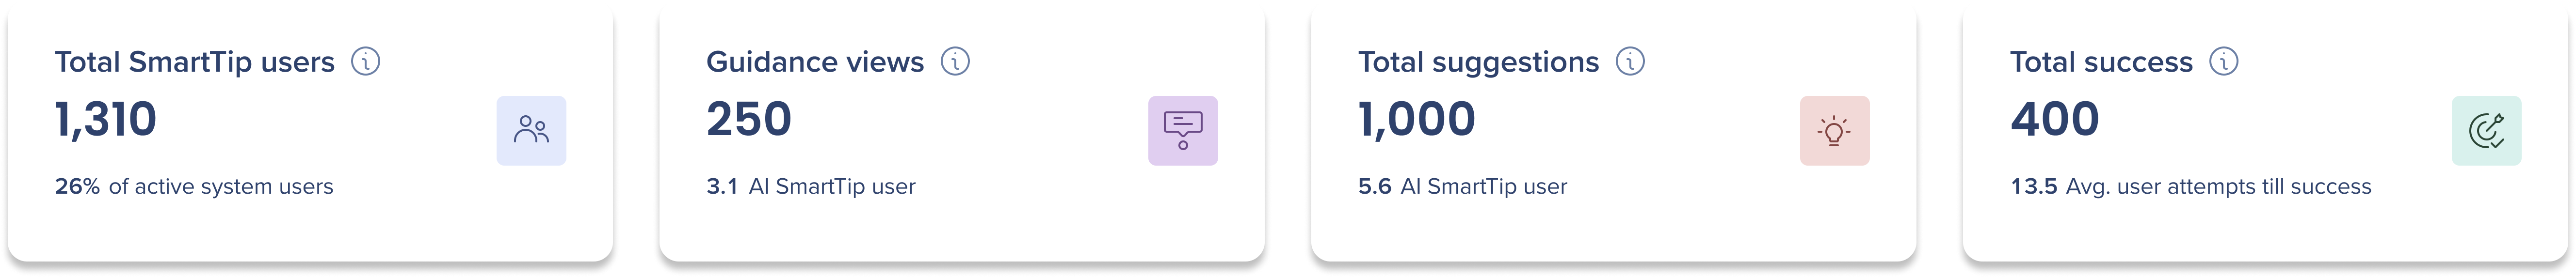
General metrics
-
Total SmartTip users: The number of unique users who either opened the SmartTip bubble or received a green/red feedback dot
-
Guidance views: The total number of times a SmartTip bubble was opened by a user
-
Total suggestions: The total suggestions generated to improve user inputs deemed insufficient by the AI
-
Total success: The total number of times the input met the requirements
Suggestions vs. Success
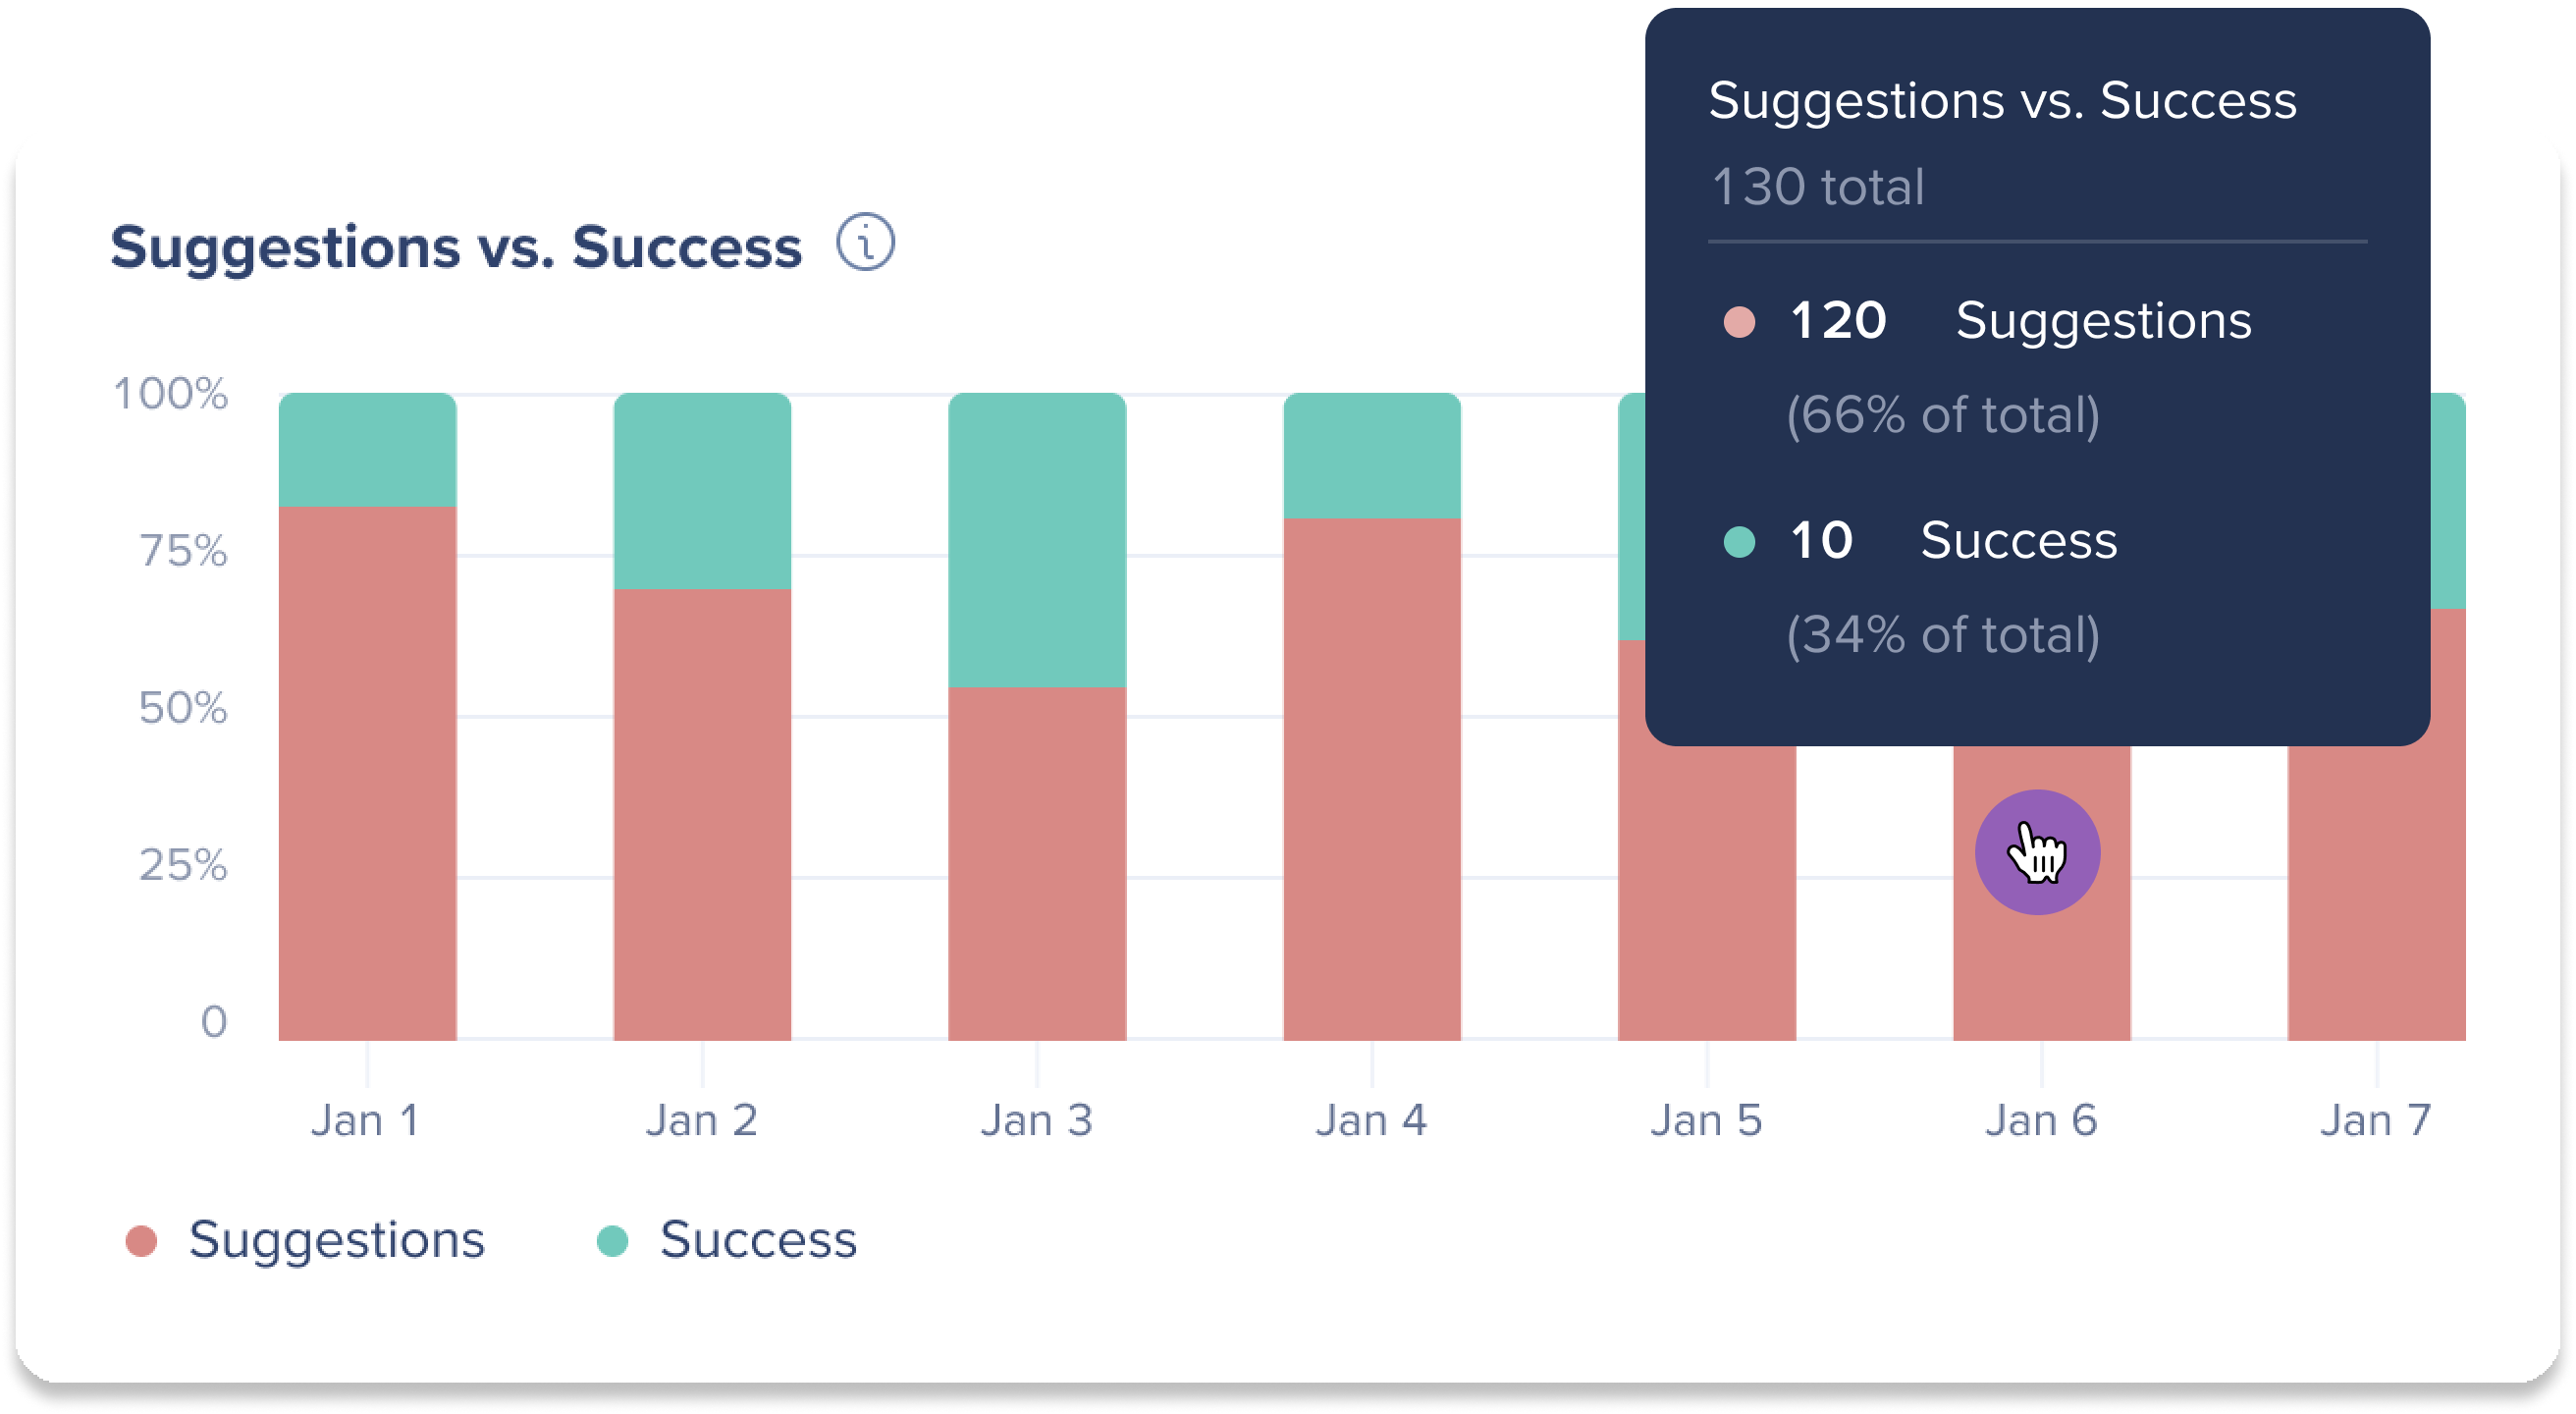
View a bar graph comparing suggestions and success rates to see if user success is improving.
Note
Hover over a bar in the graph to see the exact number of suggestions and successes for a specific date.
-
The total represents users who entered text in a field with AI SmartTips available
-
If the input was marked as success, it means that the AI SmartTip validated the input as sufficient (TRUE) from the first entry by the user
SmartTips usage trend
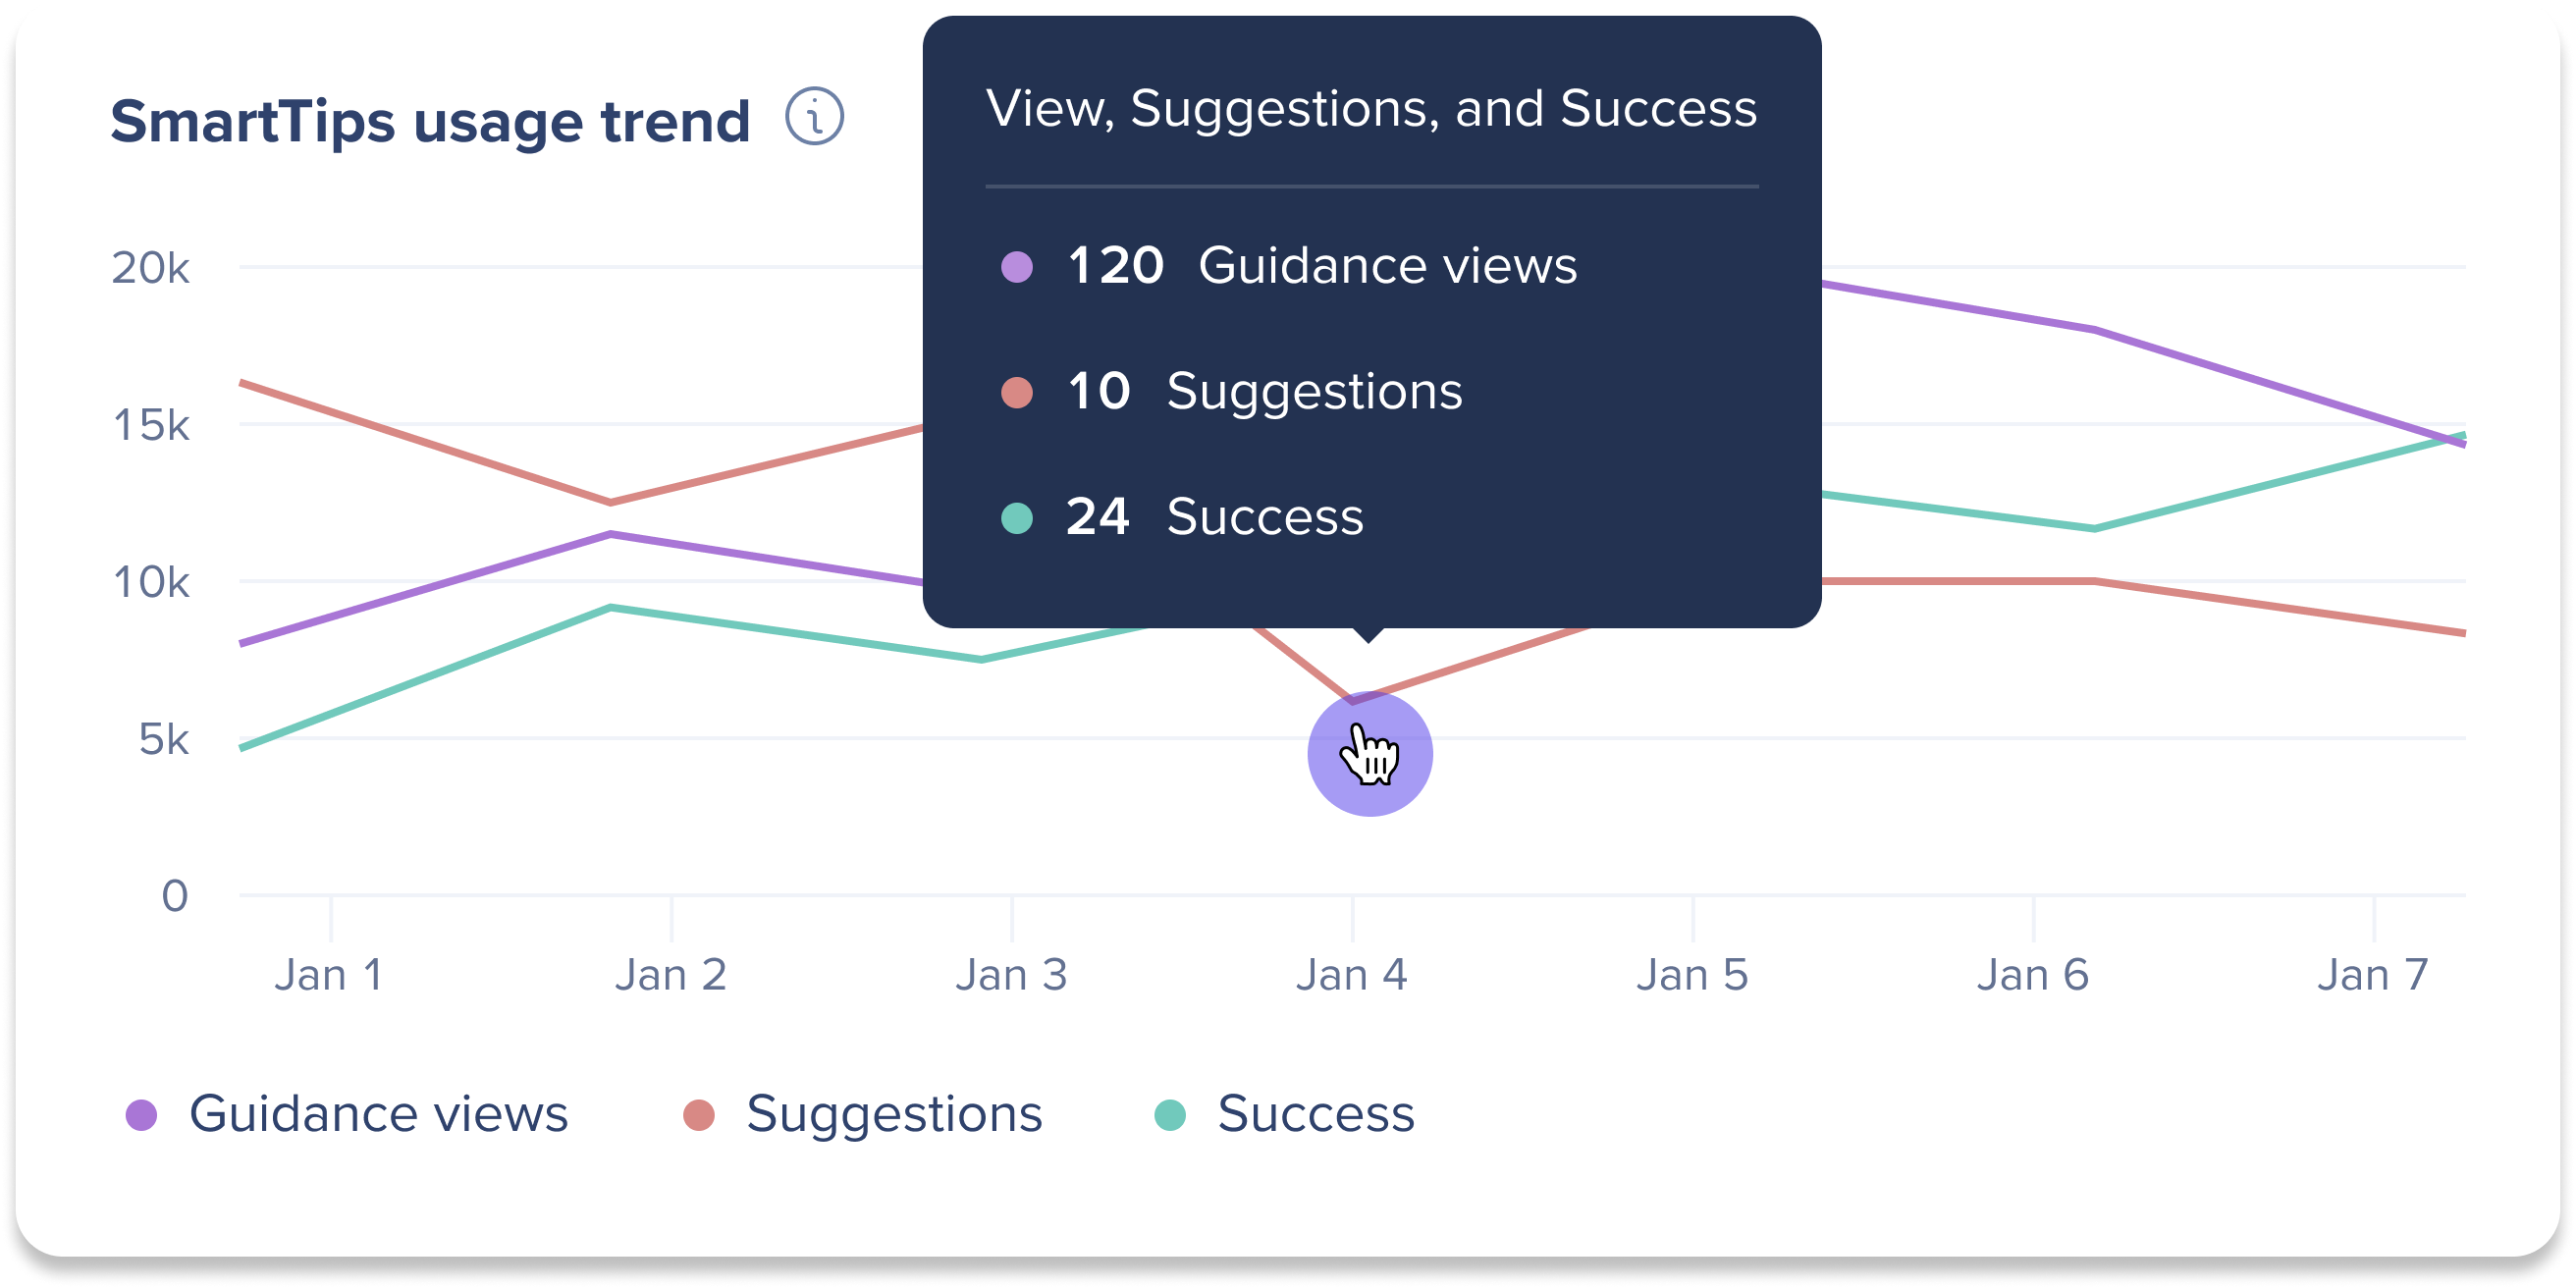
Visualize SmartTips usage through the raw counts and percentages of guidance views, suggestions, and successes.
Note
- Hover over a date in the line graph to see the exact number of guidance views, suggestions, and successes for that time
- A user does not need to open the smartTip bubble to receive a suggestion/success
SmartTips Overview
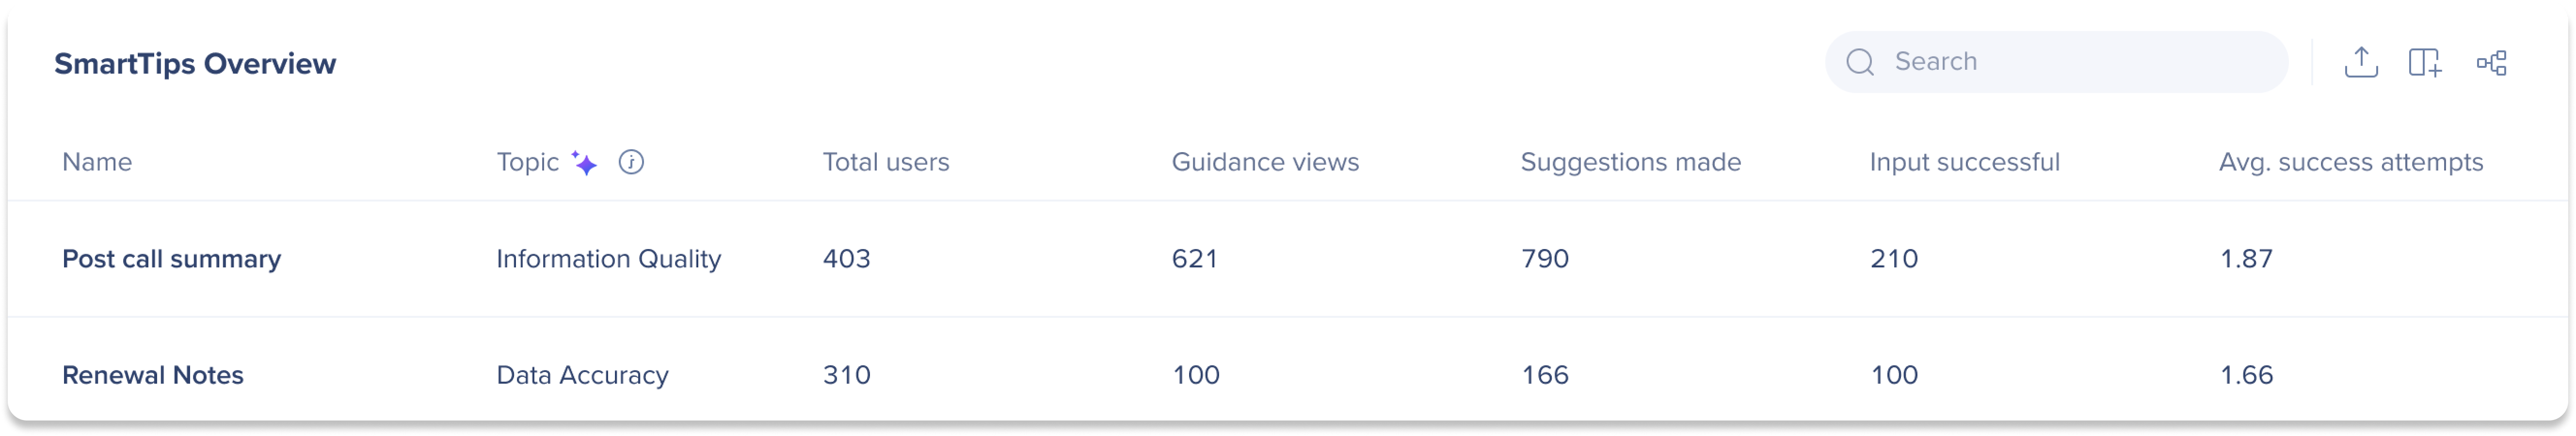
View detailed insights on each SmartTip's usage and effectiveness to understand their performance.
-
Name: The name of the SmartTip
-
Topic: AI-generated topics to summarize common themes. The AI-topic is based on the builder prompt for the AI SmartTip
-
Total users: The number of unique users who either opened the SmartTip bubble or received a green/red feedback dot
-
Guidance views: The total number of times a SmartTip bubble was opened by a user
-
Suggestions made: The total number of inputs deemed not to meet the validation requirements by the AI (FALSE)
-
Input successful: The total number of times the input met the validation requirements (TRUE)
-
Avg. success attempts: The average amount of inputs attempts until the validation requirements were met (TRUE)
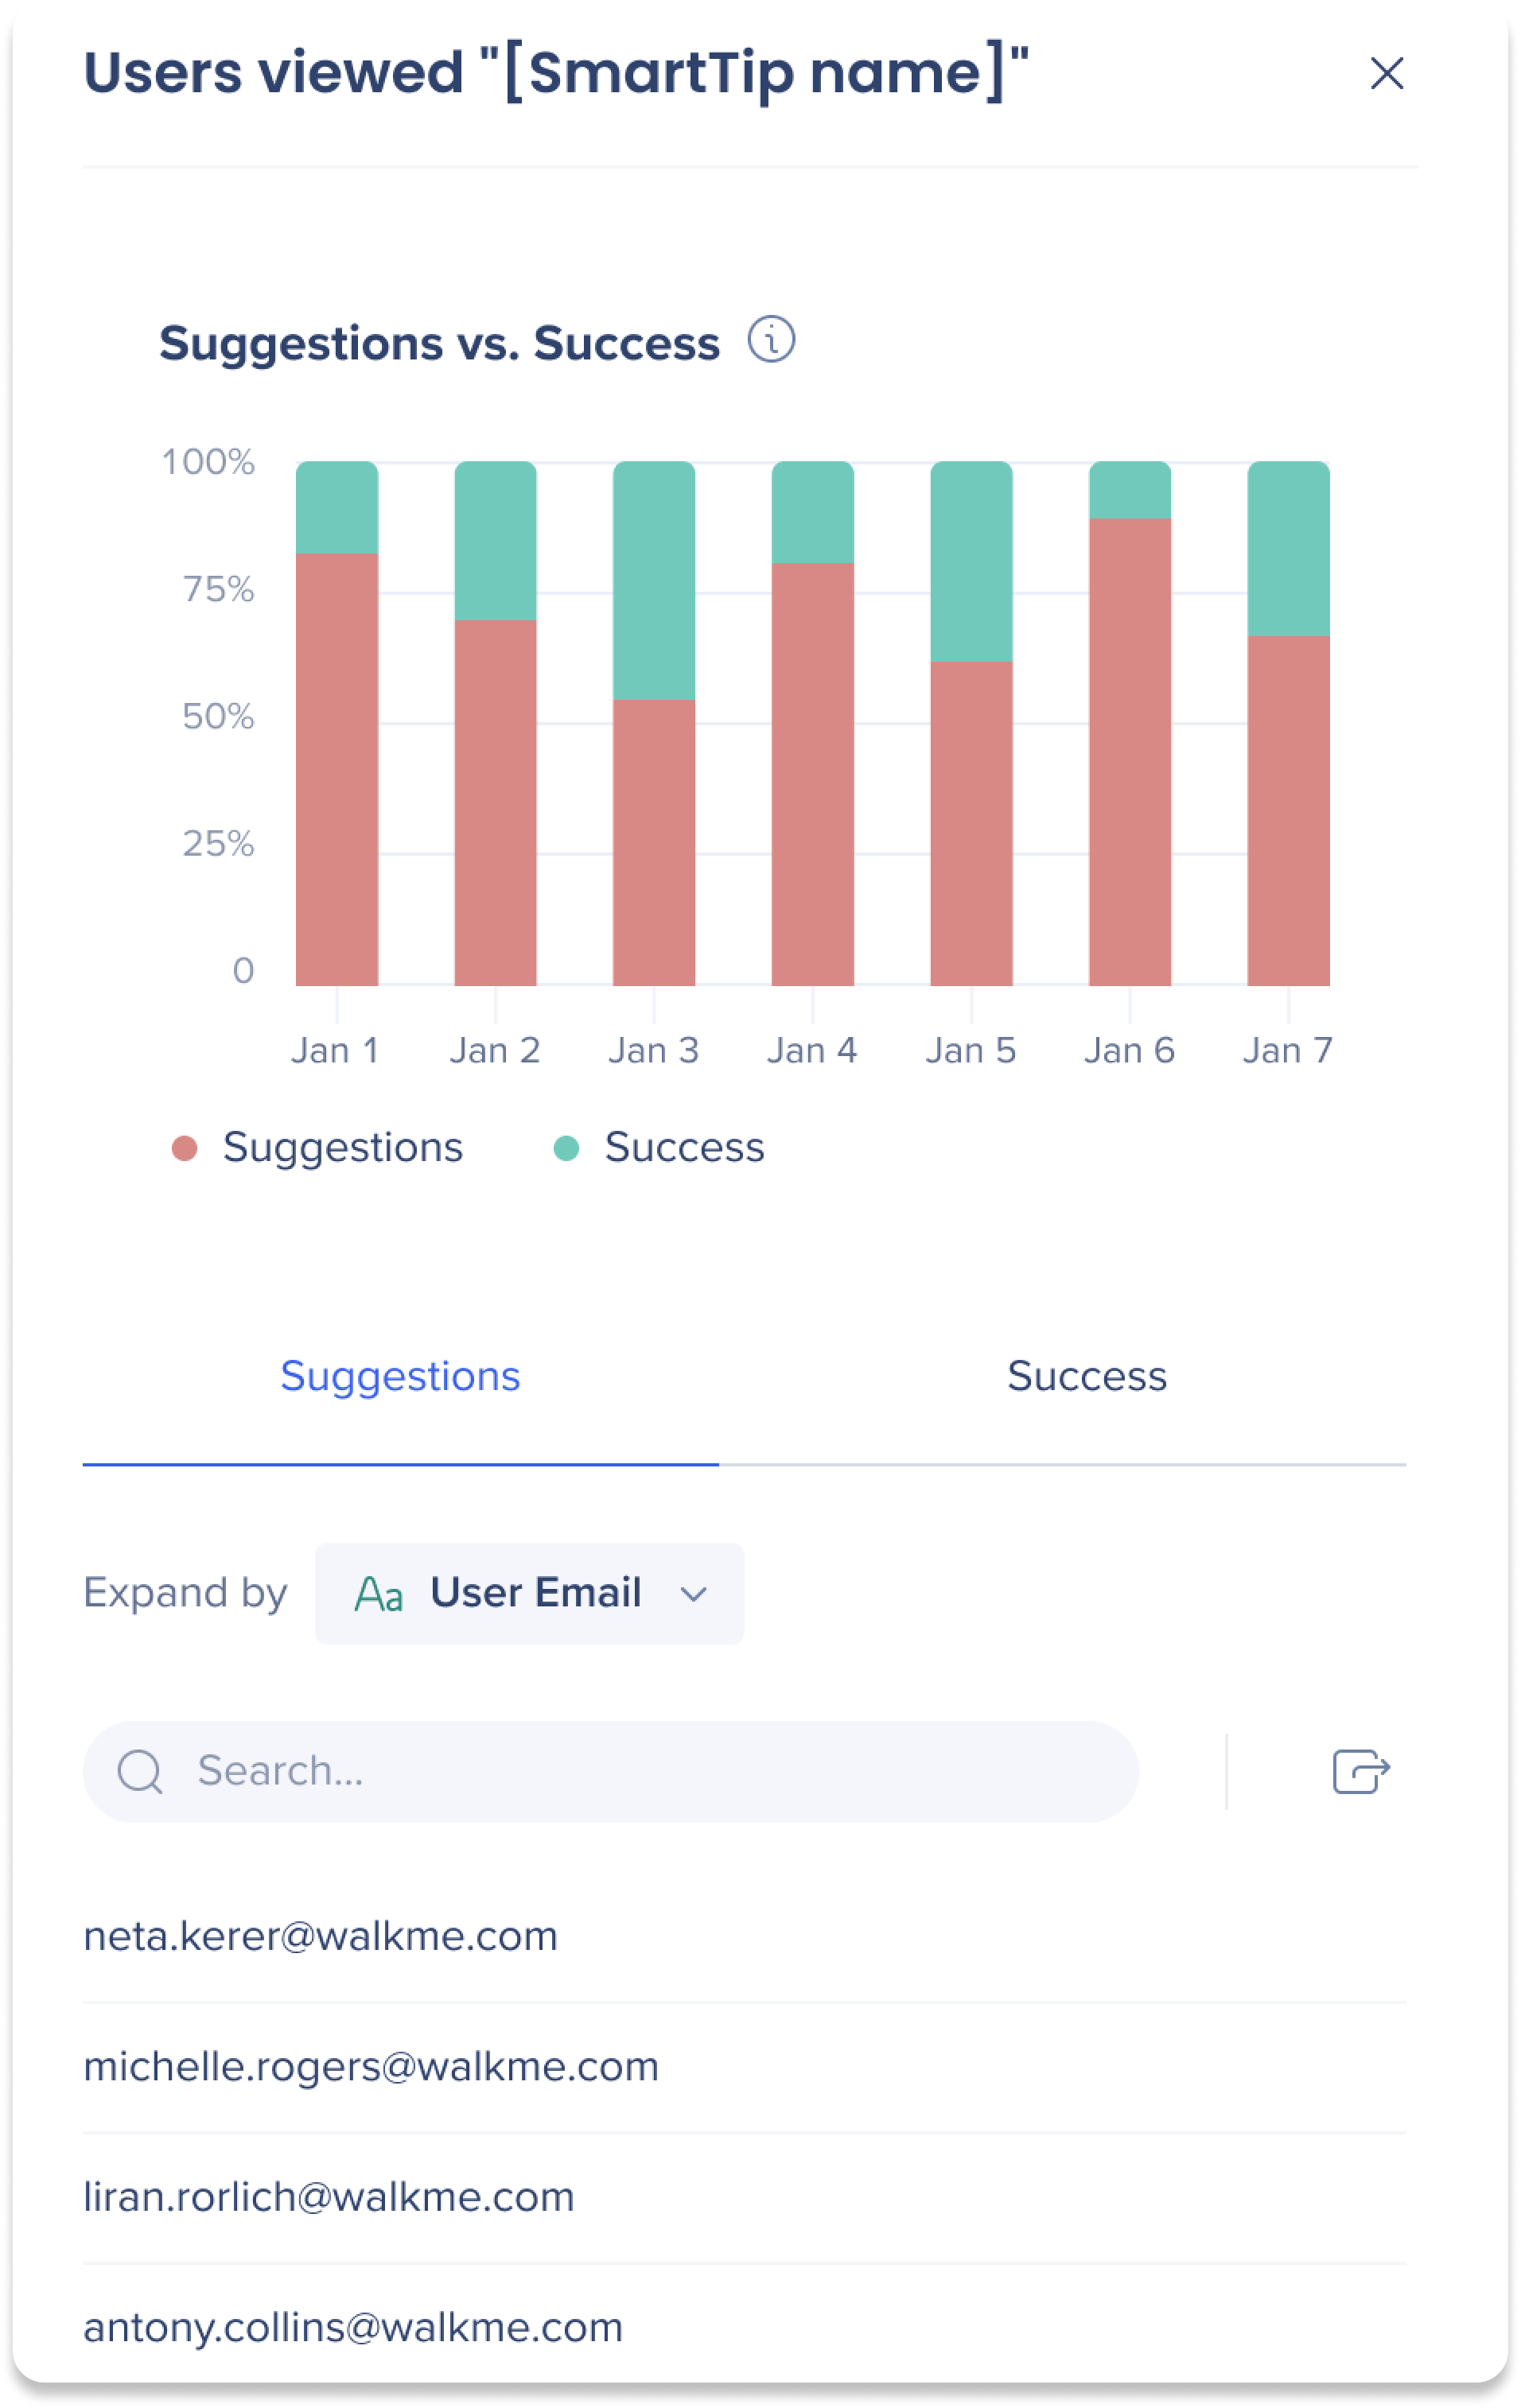
AI SmartTip deep dive
Click the total users number from the table to open the deep dive side panel for more insights.
-
Suggestions vs. Success: A bar graph comparing suggestions and success rates to see if user success improved for the specific SmartTips
-
Green = True validations
-
Red = False validations
-
Click the Suggestions / Success tabs to view details about the users
AI Rules Dashboard
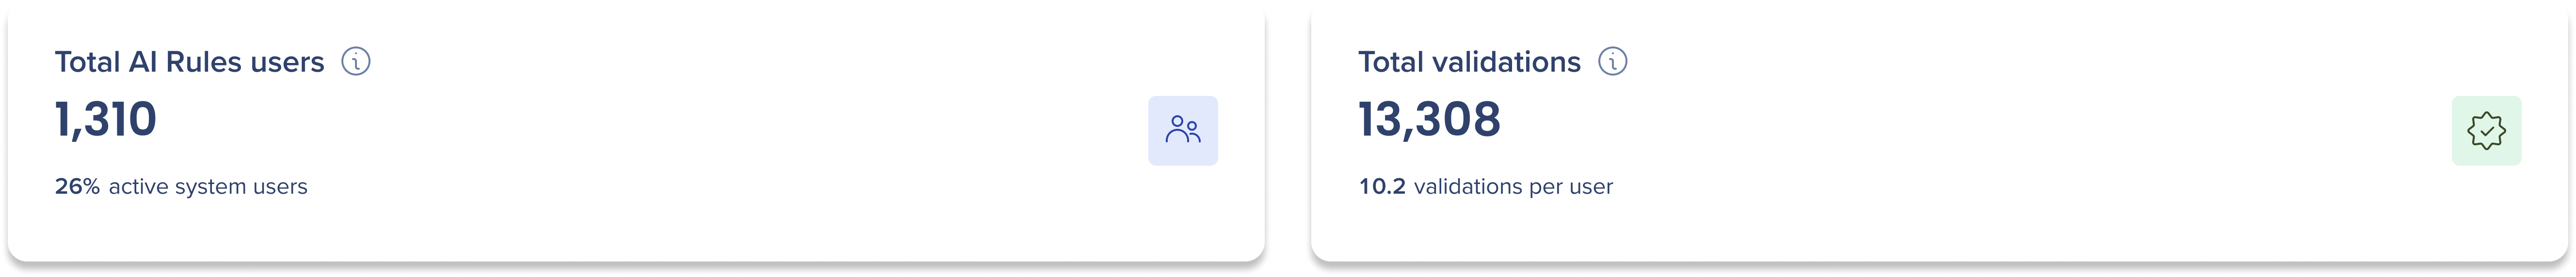
General metrics
Users vs. validations
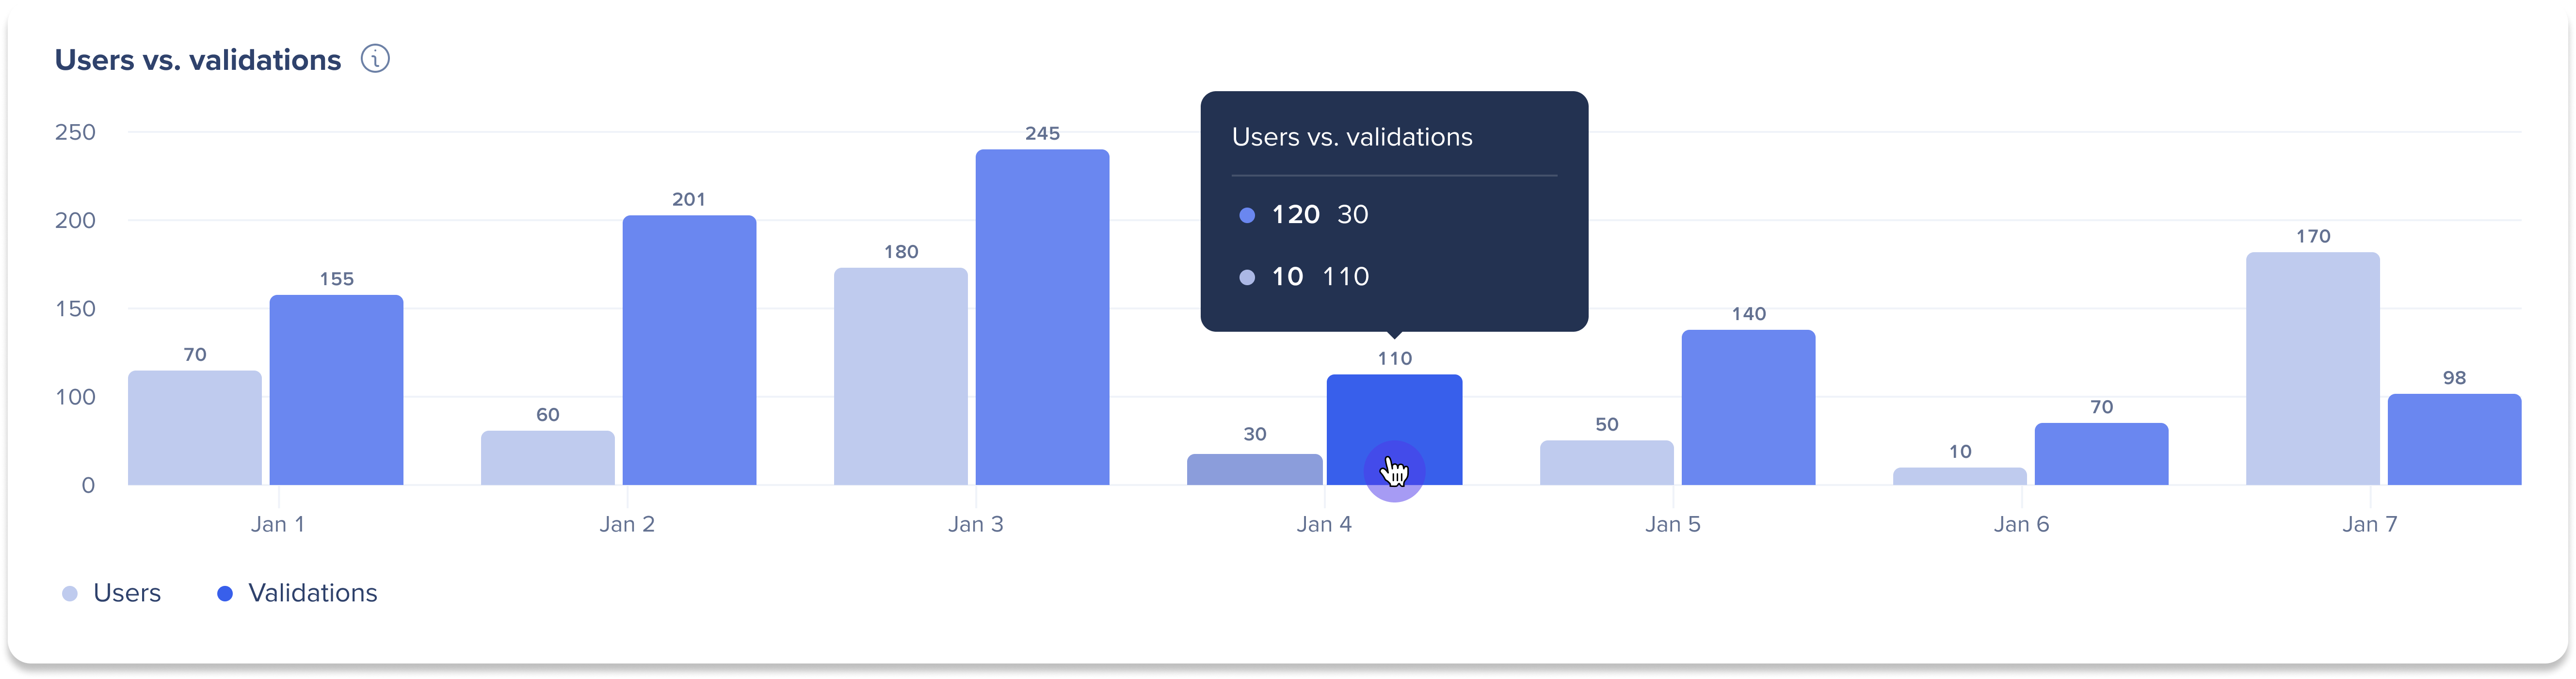
Track validation usage and number of users over time to analyze engagement with WalkMe rules.
Hover over a date in the graph to see the exact number of unique users and validations.
Rules overview
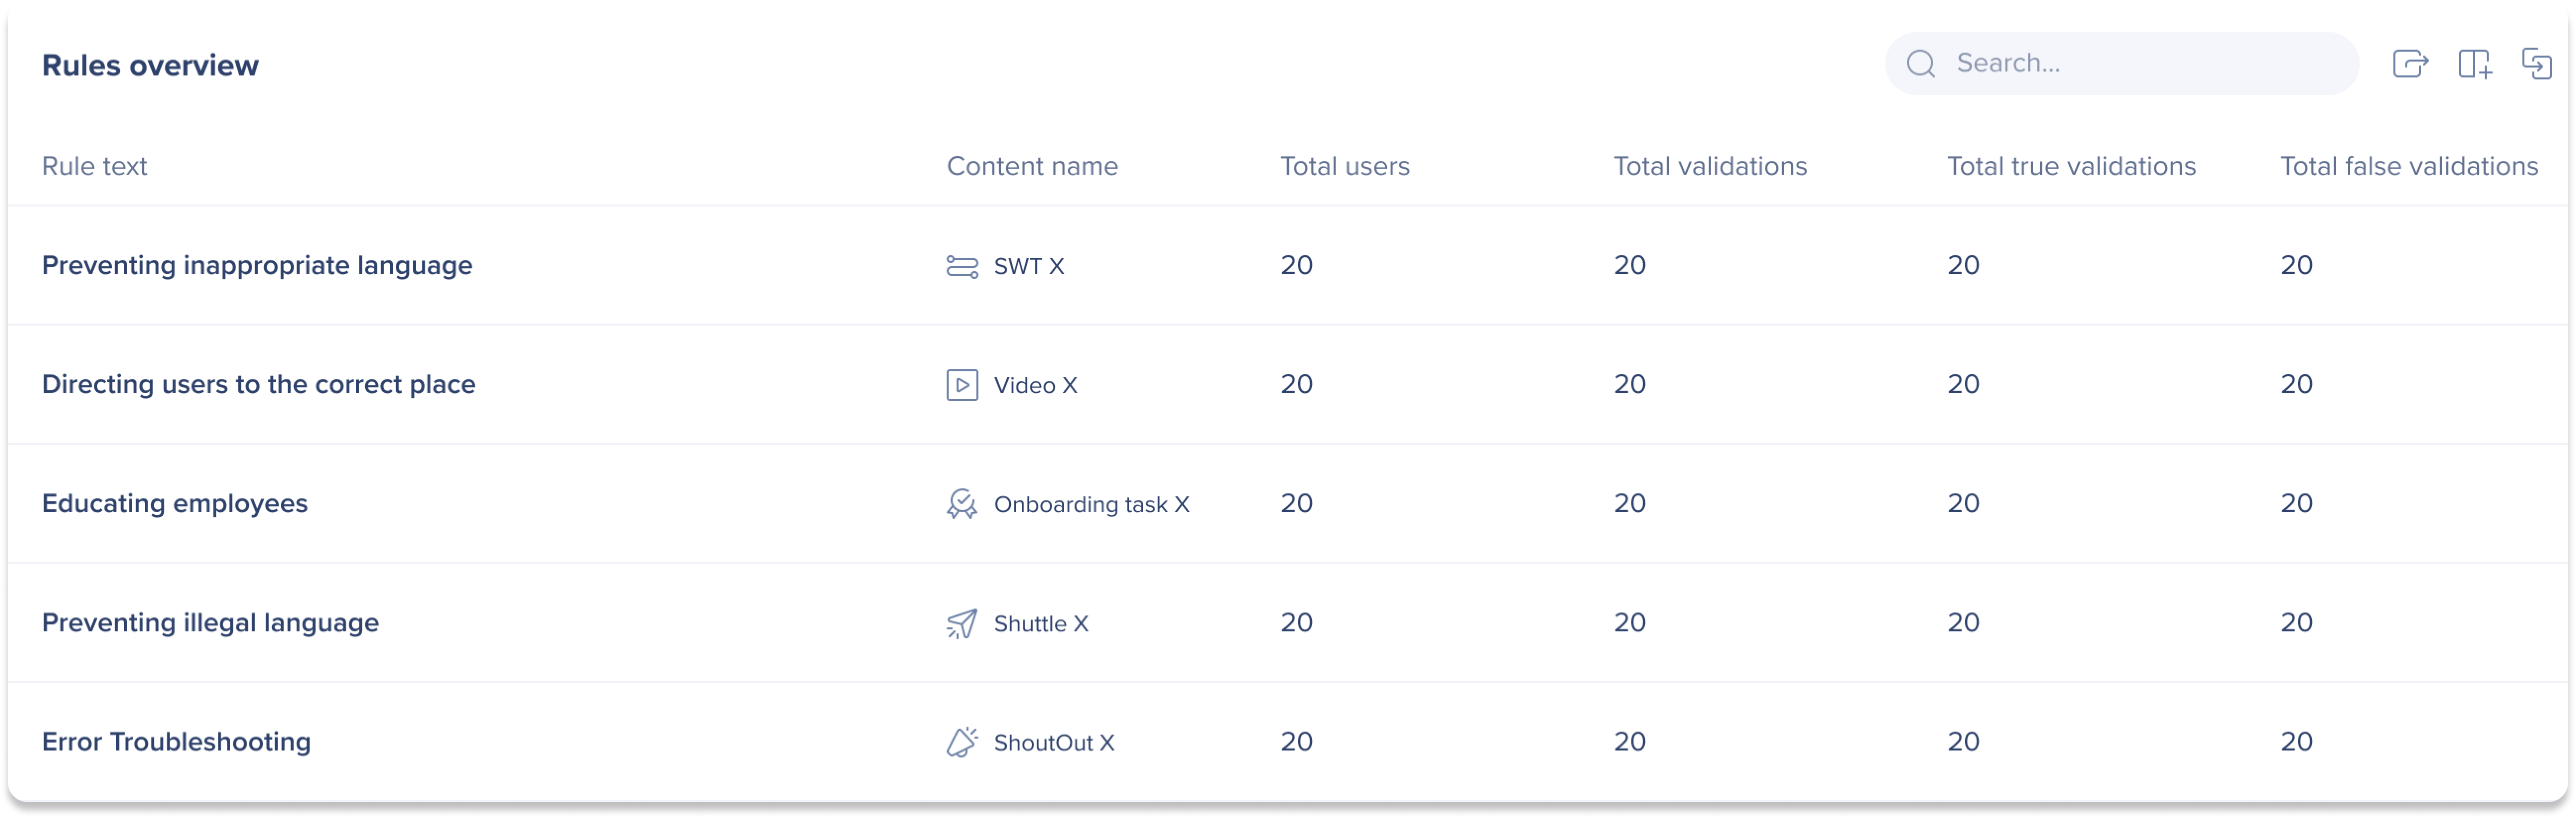
View detailed insights on each AI rule usage to understand their performance.
-
Rule text: The entered rule text to be evaluated
-
Content Name: The name of content this rule is attached to
-
Total users: The number of unique users that had this validation check performed for them
-
Total validations: The total number of times this validation check was performed
-
Total true validations: The total number of times this validation evaluated as true
-
Total false validations: The total number of times this validation evaluated as false
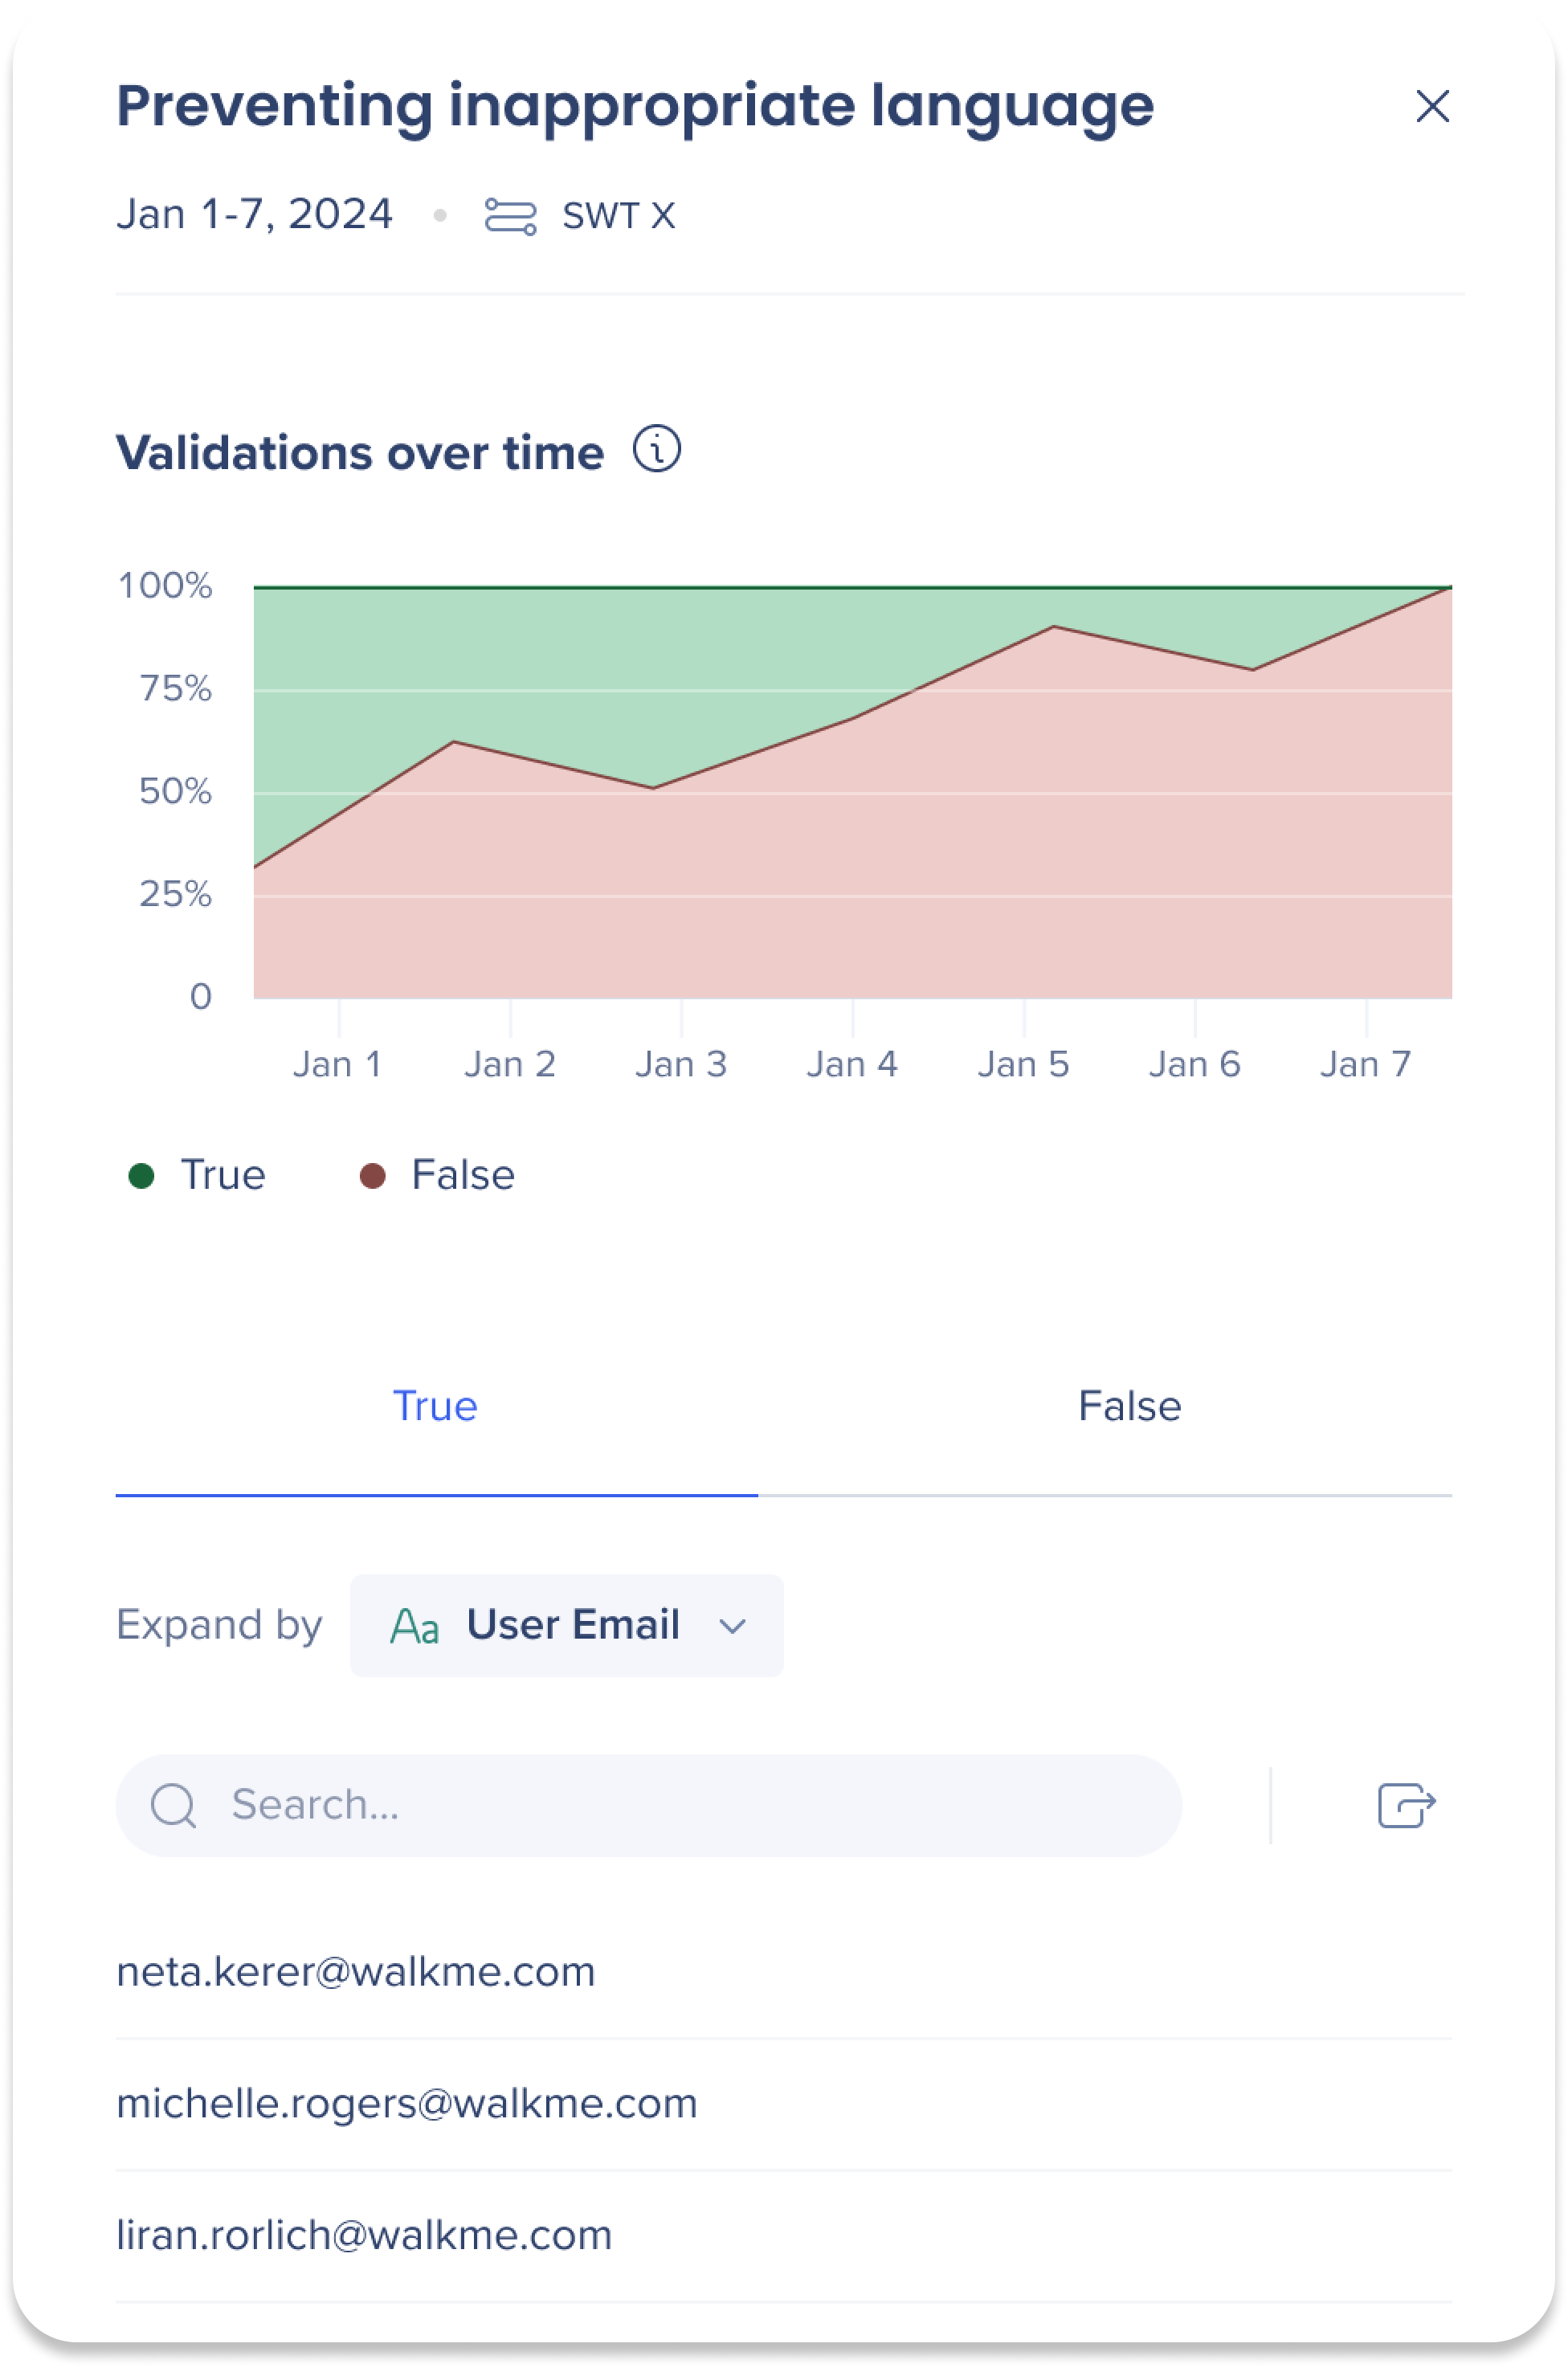
AI rule deep dive
Click the total users number from the table to open the deep dive side panel for more insights.
-
Validations over time: A line graph that compares the percentage of unique users who received True validations vs False validations over time
-
Green = True validations
-
Red = False validations
-
Click the True / False tabs to view details about users who received True or False validations
Tip Tuesday Video
Technical Notes
Prerequisites
-
These dashboards are only available to customers that purchase either a specific AI feature or Contextual AI Assistance
-
Each user can only view AI dashboards they have permission for, as controlled by their WalkMe admin
Limitations
-
These dashboards have the same limitations as the standard deployable dashboards. See limitations here
-
None of the AI deployables will be available in Tracked Events, Filters, Custom Widgets, Flows or any other areas of Insights - only the dashboards they are found in
-
Desktop/Mobile menu ai chat data is not supported
Additional Notes
-
AI Answer numbers are based on answers and not questions
-
We use third party LLMs to summarize and provide topics for AI Answers and AI SmartTips
- Although AI Action Bar launchers may appear as launchers in the WalkMe Editor in Insights, they will be shown under the AI Action Bar tab and not the normal Launcher tab
-
AI Answers requires 48 hours to process data for the dashboard


