Upcoming End of Life (EOL)
The Digital Adoption Projects Dashboard will reach EOL and be removed in the Q1 '26 release.
Brief Overview
The Digital Adoption Projects Dashboard allows you to view the status and progress of your digital adoption initiatives.
Management can easily and intuitively define their business KPIs here—without needing any prior knowledge of Insights.
Initiatives are tracked and measured, providing a holistic view of business KPIs across all monitored systems.
Use Cases
- The CIO wants to track system utilization compared to the investment in a new system (for instance, reaching 85% system utilization indicates that investing in the technology was worthwhile)
- Measure employee efficiency by tracking the completion of a business process (target: 90% process completion for quote submissions in DealHub)
- Track adoption of new paid features (understand how many users click “Upgrade”)
- An executive wants to see whether projects across applications are progressing according to plan
- When launching a new project or initiative (rolling out a new system, introducing new processes within an existing system, and so on)
- To track and measure application adoption, user satisfaction, WalkMe content engagement, training, onboarding, and process completion
Note
To view or edit a project, users must have the following access rights
- Insights: Permission set to Read or Write
- Access to all systems within the project
If a user lacks access to at least one of the systems in the project, they will see “Access Restricted”.
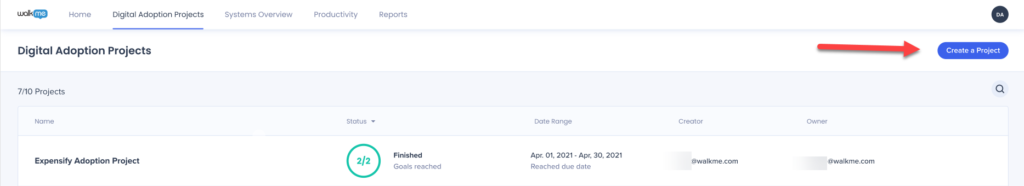
Main Dashboard View
After logging into Insights, open the Digital Adoption Projects Dashboard.
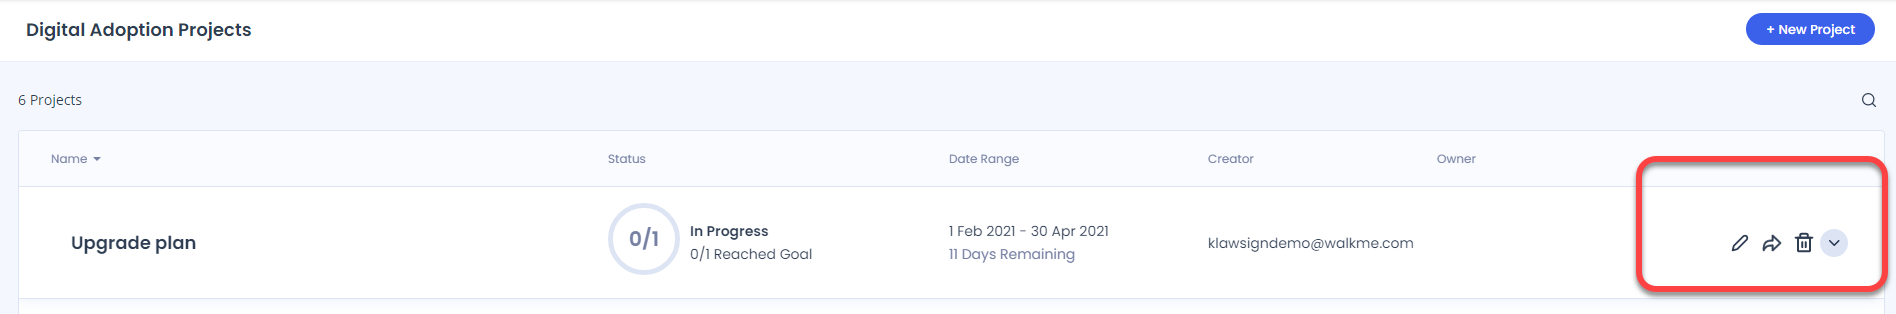
Each row represents a project. For each project, you can see the project name, status, date range, creator, and owner, as well as additional features described below.
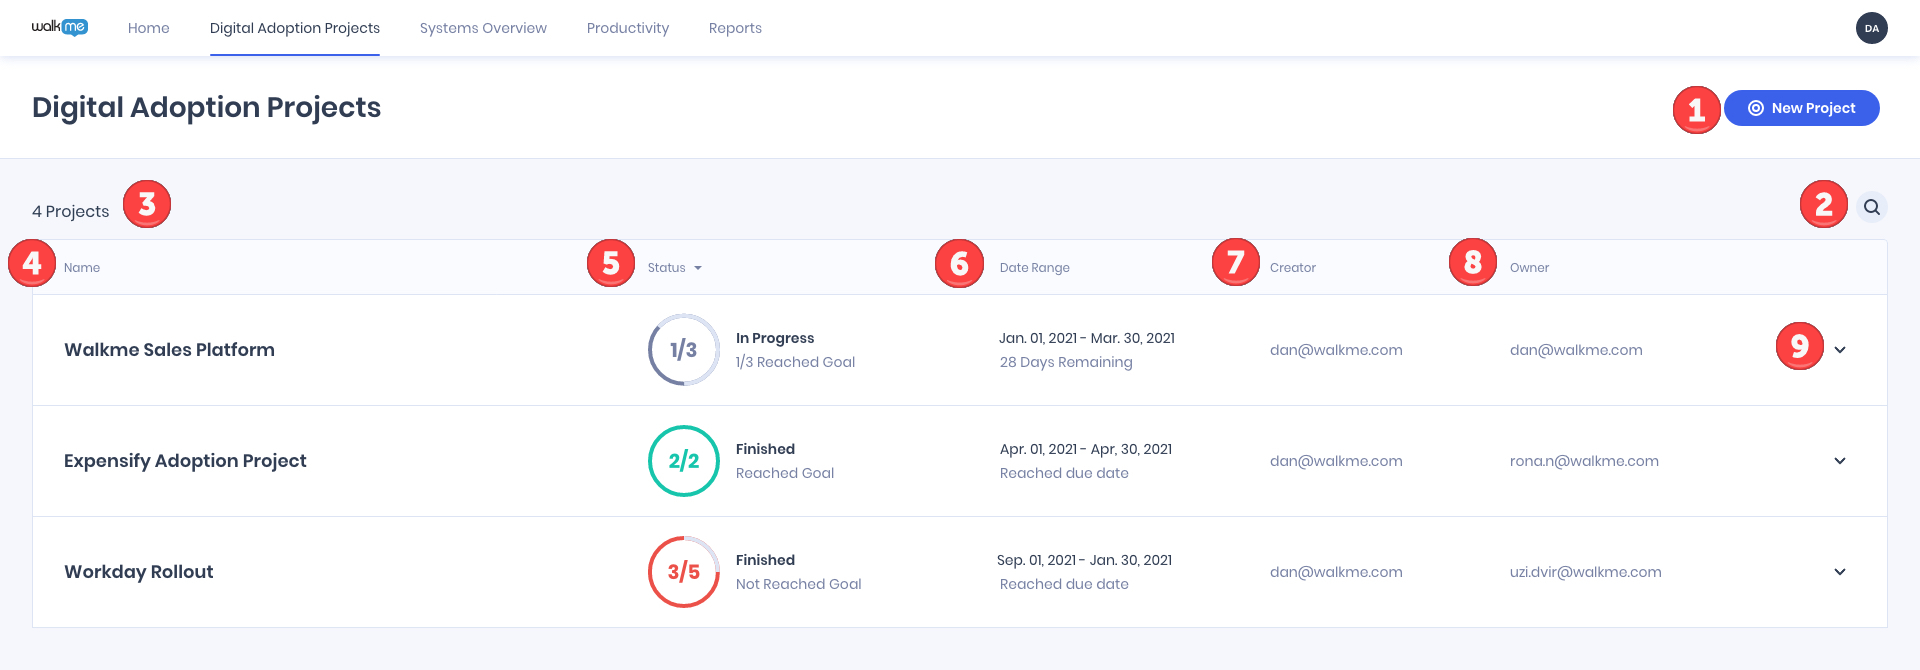
Dashboard elements
- New Project button: Create a new project
- Search: Quickly find what you're looking for
- Project Number: Shows the total number of projects (for instance, 4)
- Project Name: Displays the project name as defined during setup
- To edit it, hover over the row and click the Edit icon
- Project Status: Indicates where the project's objectives stand relative to the defined date range
- Objective Gauge
- Gray: Due date not reached and KPIs not yet achieved
- Green: All objectives reached their KPIs
- Red: Due date passed and at least one objective was not reached
- Timeline Status
- Finished: All goals achieved
- In Progress: Due date not yet passed; goals still pending
- Not Defined: None of the objectives are marked “Completed”
- Access Restricted: User lacks access to at least one system
- Date Range: Shows the project's date range and remaining time to the due date
- Creator: Displays the WalkMe user who created the project (cannot be changed)
- Owner: Displays the project owner as defined during setup
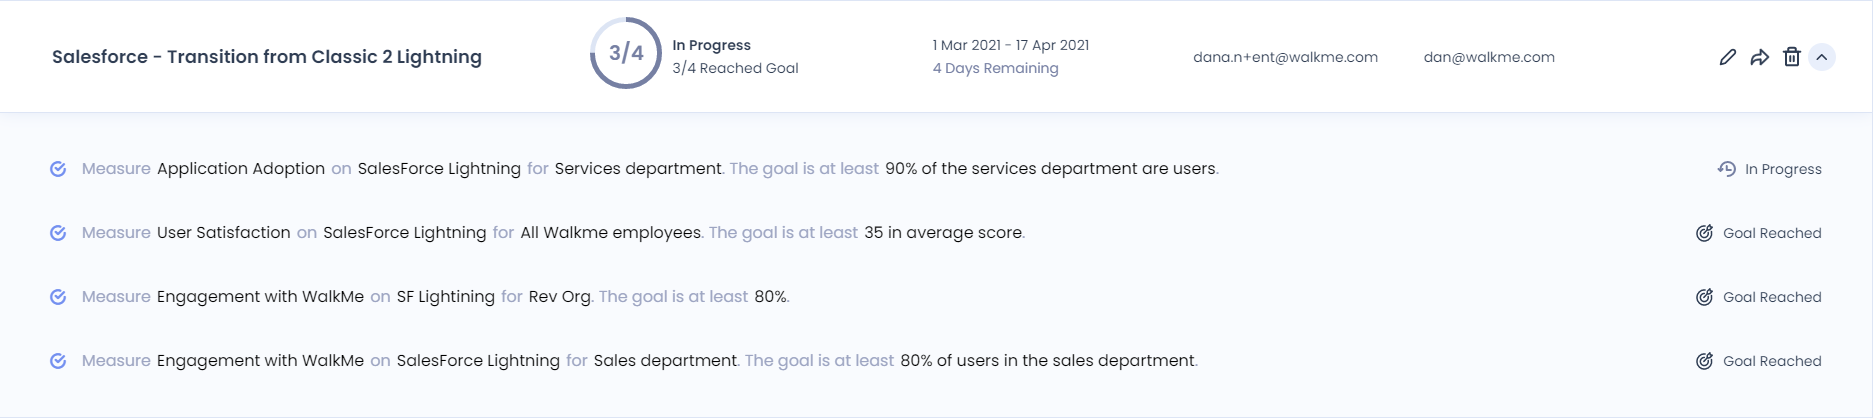
- Dropdown Arrow / Objective Brief: Expand to view all project objectives and what each measures
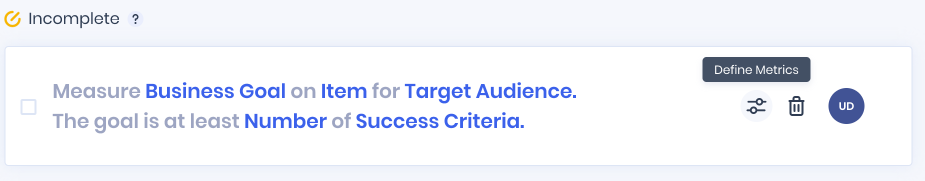
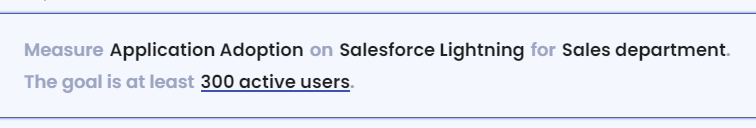
Objective Brief
Defines the purpose of a goal in simple business terms for non-technical users.
Example: Measure application adoption in Salesforce Lightning for the service department, targeting at least 90% adoption.
- Measure Business Goal: Can be selected from predefined options or entered manually
- Element, Audience, Count, Success Criteria: Entered as free text
- Recommended but not required to describe the main business goal
- Objectives start as Incomplete and become Completed once fully defined using the “Define Objective” form
Hover options
- Edit: Modify the project
- Share: Share project status
- Delete: Remove the project
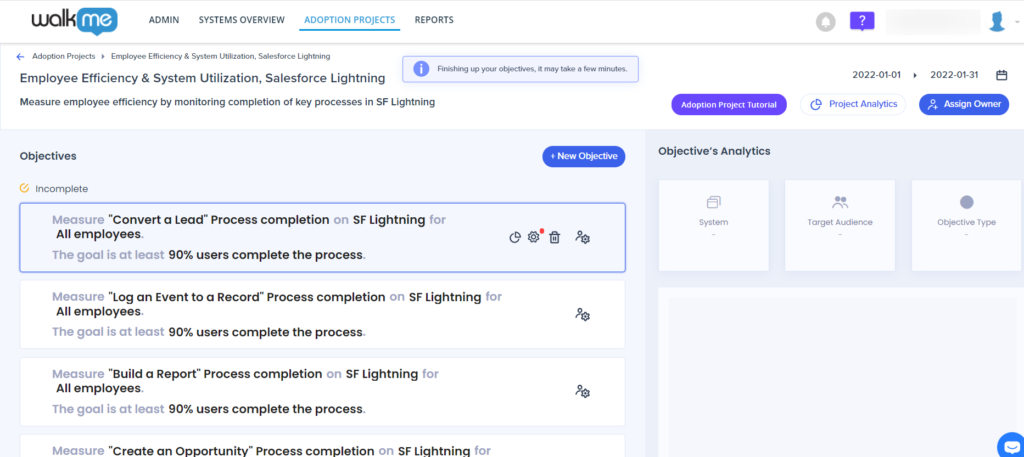
Analytics View
Access the Analytics View by selecting a project row. This is the most detailed view showing each objective's status.
You can:
- Edit project details: Click the Edit icon to open project setup
- Share analytics: Click the Share button to send analytics by email
Note
Viewing analytics also requires access to Insights and all project systems.
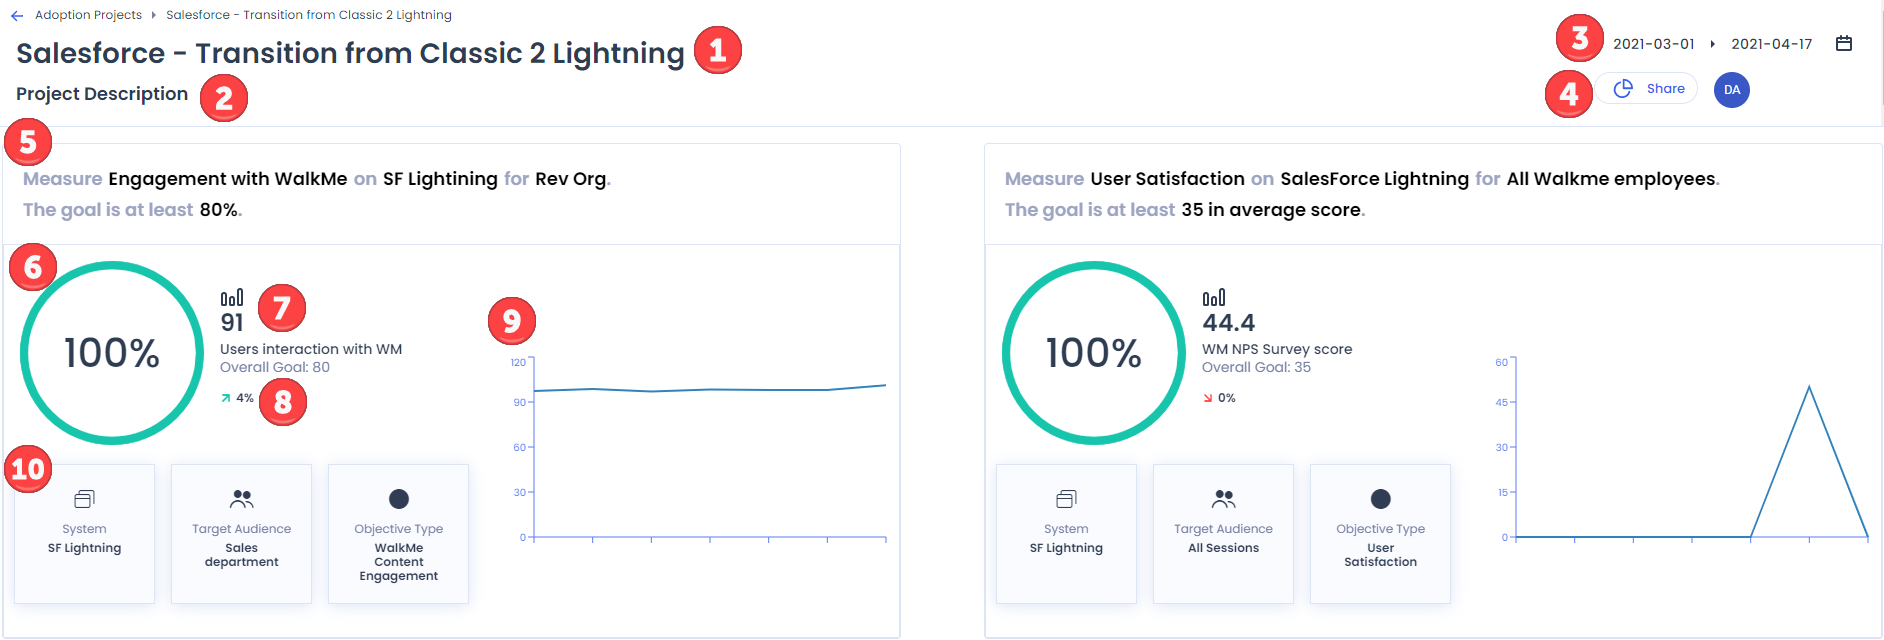
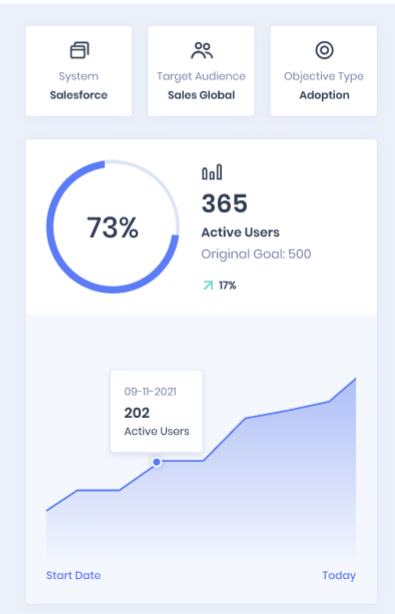
Analytics overview
- Project Name:The name of the projecy
- Description: Optional short description
- Date Range: Displays the project's defined period; analytics are based on this
- Share: Share analytics with your team
- Objective Brief: Shows the defined objective description
- Progress Percentage: Visual progress compared to success criteria
- Progress Metrics: Numeric comparison of current vs. target KPI
- Trend Percentage: Shows increase or decrease relative to the start date
- Trend Graph: Visual representation of the KPI trend
- System, Audience, Objective Type: Displayed as defined in setup
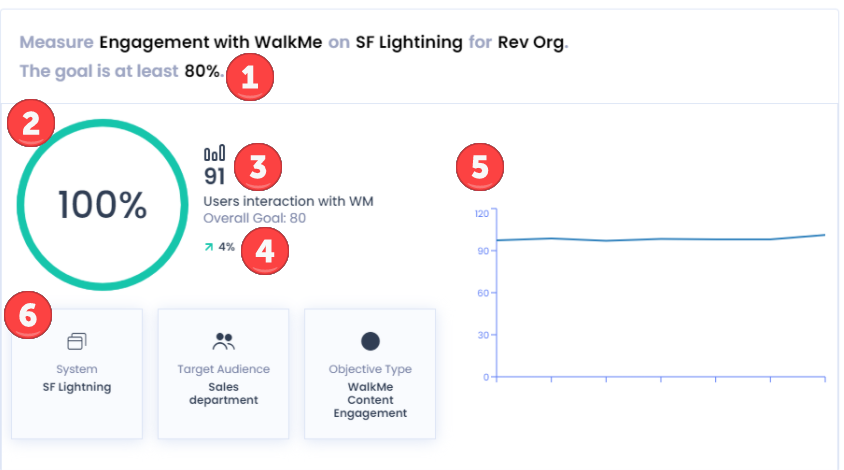
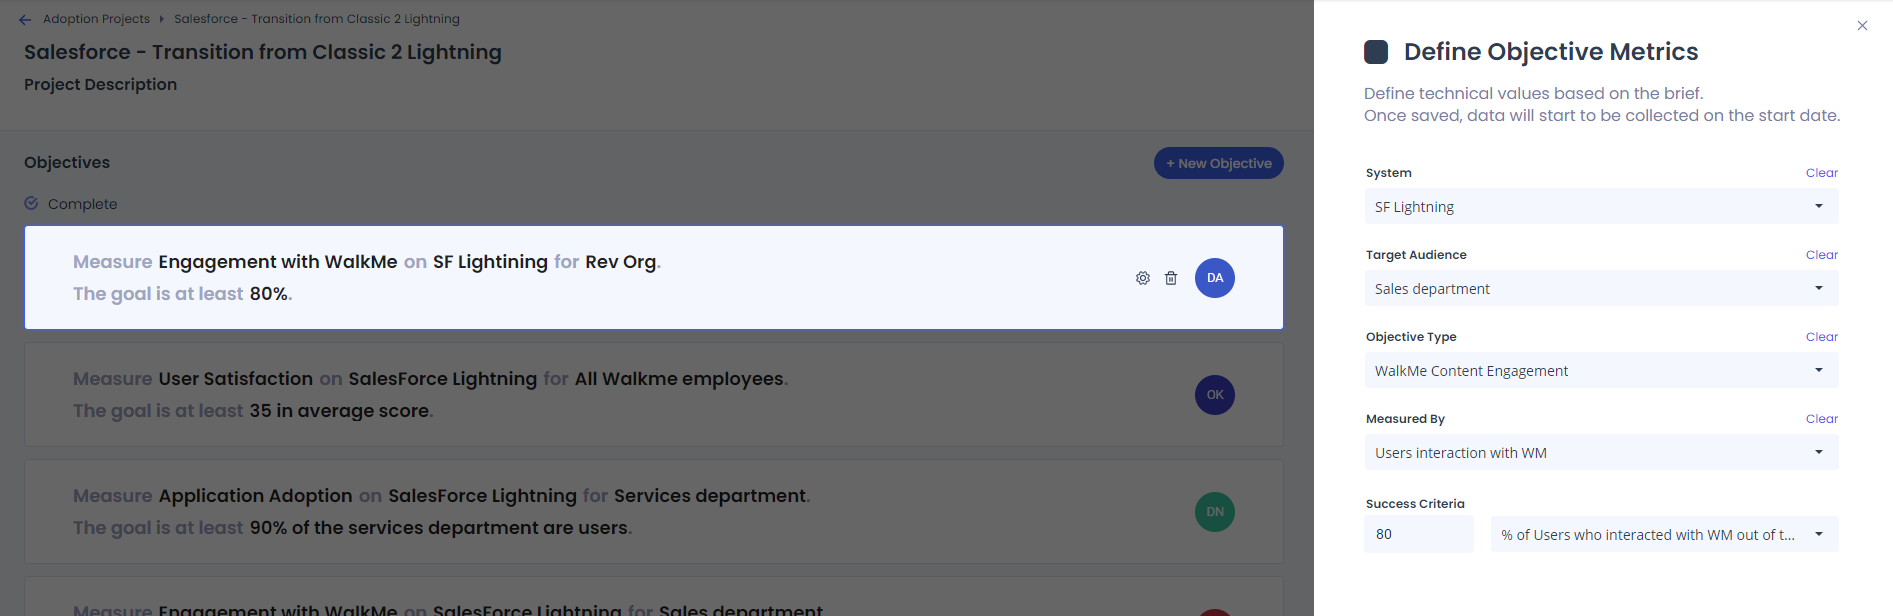
Analytics breakdown example
- Objective: Measure engagement with WalkMe on SF Lightning for Revenue Org users
- Success Criteria: 80% of users engage with WalkMe
- Current KPI: 91% – target reached (100% achieved)
- Trend: 4% increase compared to the defined success criteria
- System: SF Lightning
- Audience: Sales Department
- Objective Type: WalkMe Content Engagement
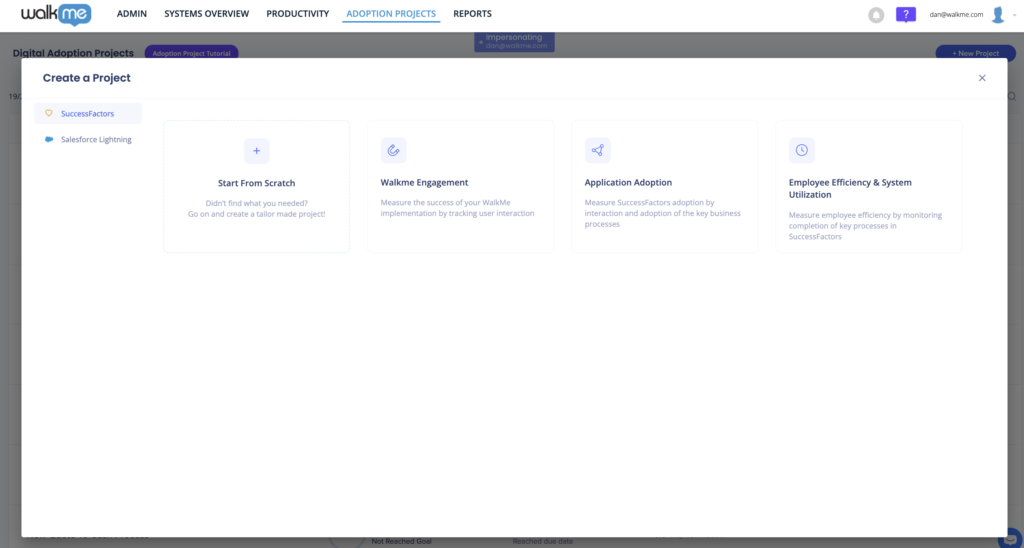
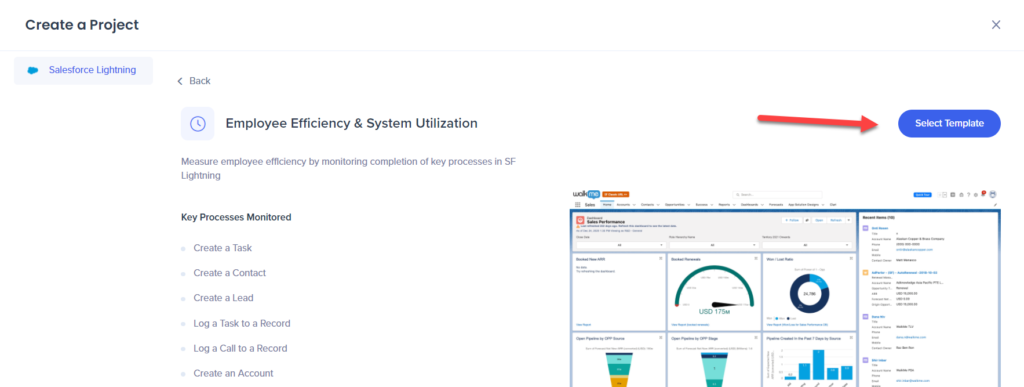
Creating a Project
- Select Create a Project
- Explore the objectives included in your chosen template, and then click Select Template
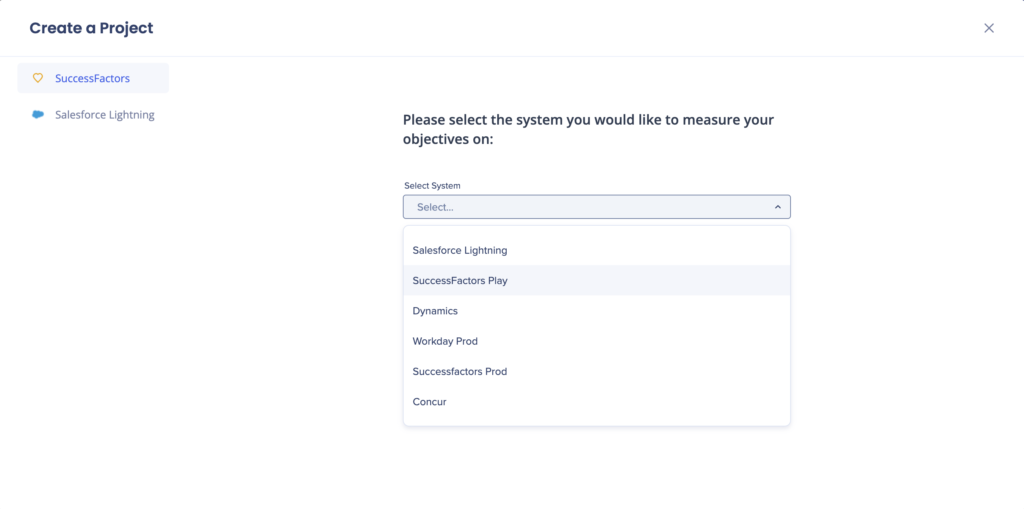
- Select the system that you will measure project objectives on
 If you chose to create a template from scratch, you must define the Project Name and Date Range, and add an optional description if desired - these can be edited later.
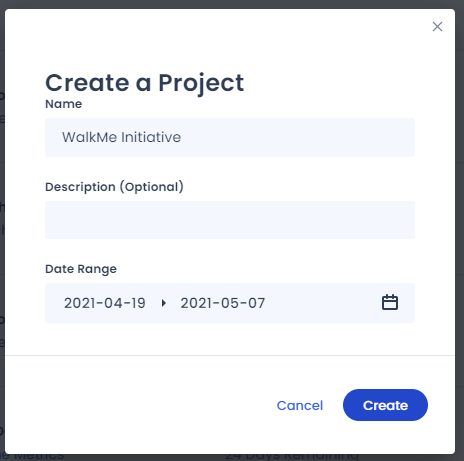 Note: The "Project Creator" field will automatically be the user that created the project (this cannot be edited).
- Your objectives will be filled in.
- Tip: You can change your project name and description, if desired, and check that the project dates are correct.
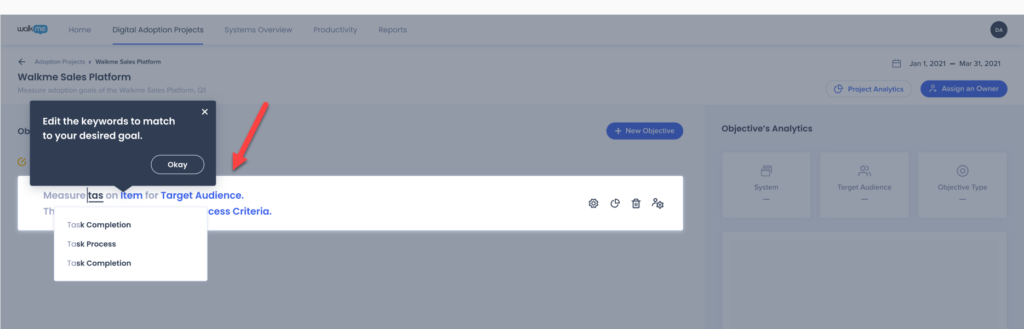
- If you chose to create a template from scratch, instead define the Objective Brief by completing each of the blue text fields
- Tip: You can enter keywords to match your goal by typing and selecting from the most commonly used options in the dropdown.
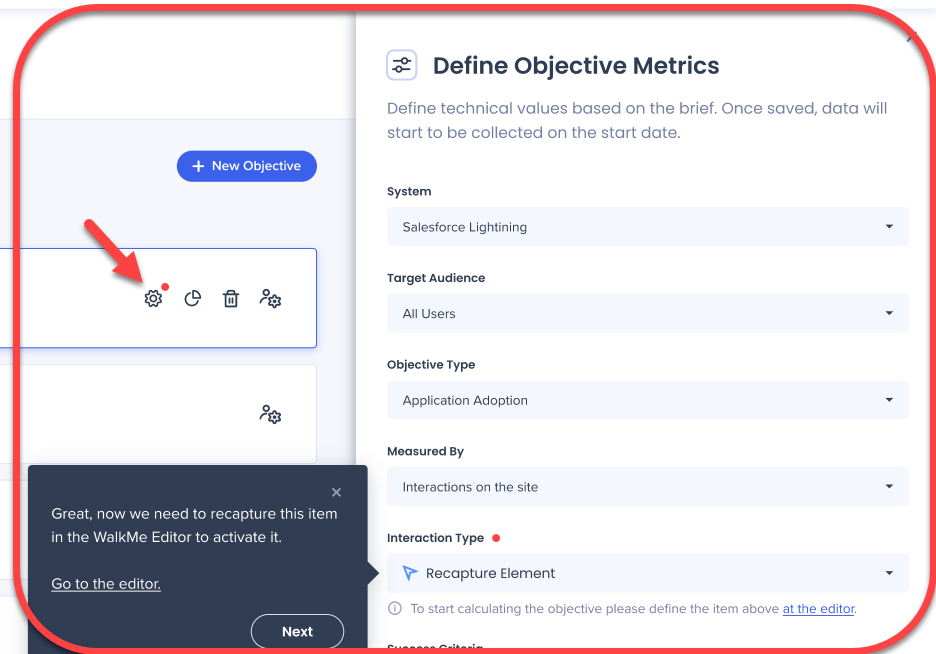
- Click on Settings to review your objective metrics and recapture any interaction elements in the editor if needed
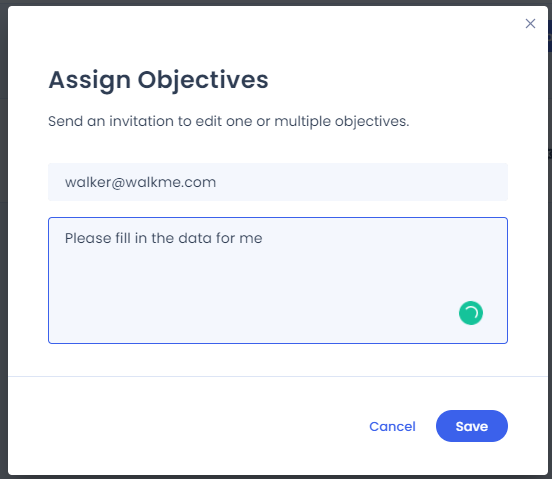
- Select Assign to assign objectives and Project owners

- Note: Once an objective owner is assigned it overrides the default owner value that was defined with the Project owner setup. Reassigning the objective owner is recommended, but not mandatory.
- Define the project owner as you want it to be displayed in the Digital Adoption Projects dashboard
- The Assignee will receive an email notification to complete the objectives
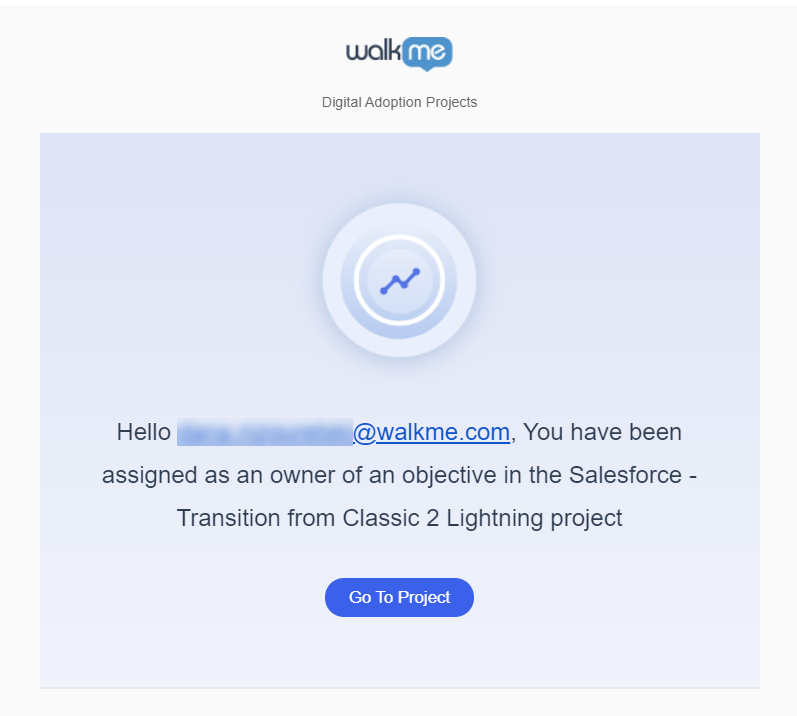
- Click Save - from this point the objective status can be measured and calculated
Technical Notes
- Desktop systems are not supported (web only)
- No drill-down available in Insights
- Maximum of 20 projects allowed at a time
- No limit on the number of objectives per project
- Data collected only in production
- Project data updated daily
- Templates available only for Salesforce Lightning and SuccessFactors