Brief Overview
The Analytics page helps you track adoption, engagement, and performance across your learning content. Use it to monitor completion rates, quiz scores, and certificate progress — and drill into individual courses or learning journeys for a closer look at learner activity.
Use Cases
- Monitor overall learner engagement across all content types
- Identify which courses or learning journeys have low completion rates
- Track certificate progress across your organization
- Compare quiz performance across learning items
- Review individual learner progress within a specific course or learning journey
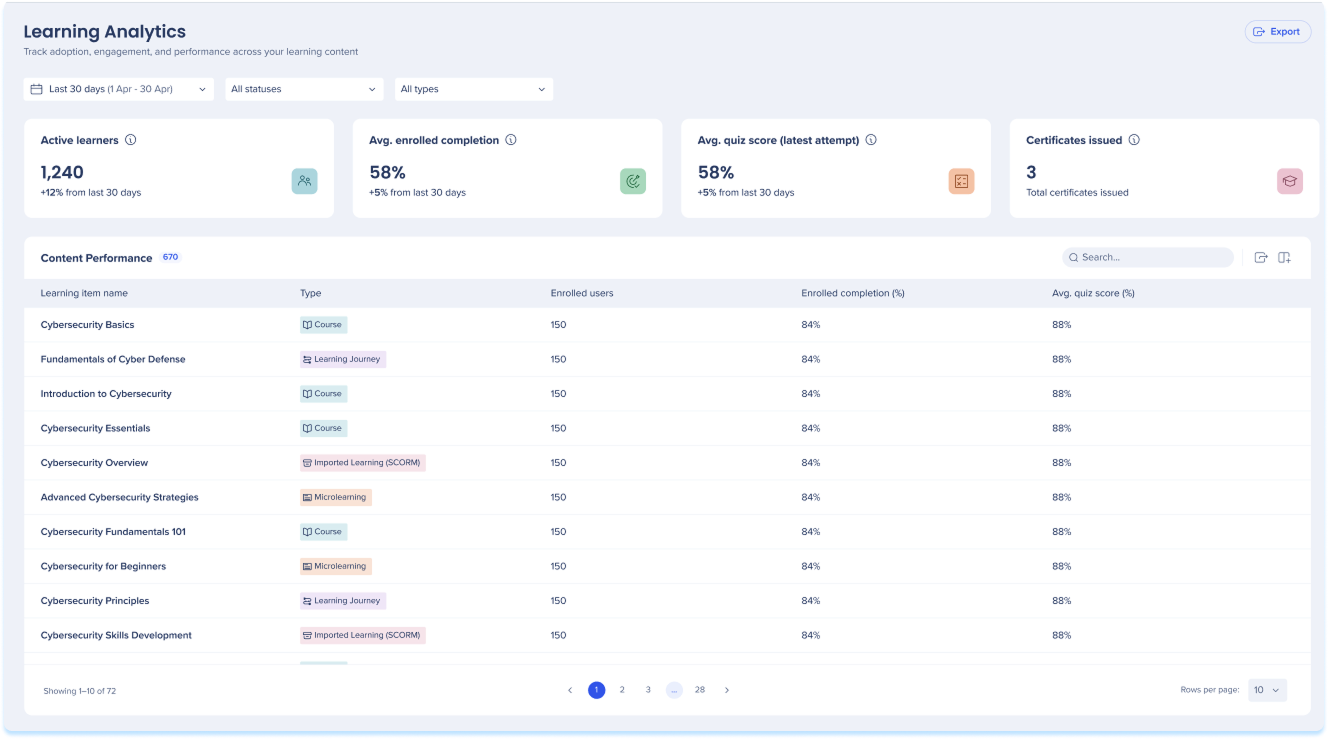
Analytics Page
The Analytics page gives you a high-level view of learning activity across your organization. Use the summary widgets and content table to understand engagement and performance at a glance.
Active learners
The number of distinct learners enrolled in the selected period who started or completed at least one learning item
Avg. enrolled completion
The average completion rate across items for assigned learners and self-enrolled learners who started within the selected period
Avg. quiz score (latest attempt)
Average score across all quizzes, counting only the learner's latest attempt.
Certificates issued
The total number of certificates issued within the selected period.

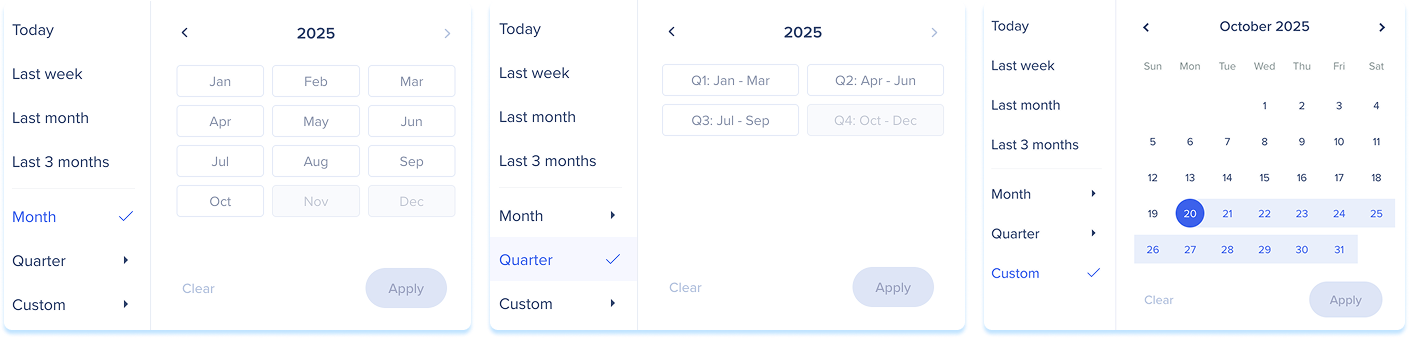
Filters
The dashboard filters enables users to view and analyze a smaller part of your data set.
Users have the following filter options:
- Today: This filter shows data from the current day
- Last week: This filter shows data from the previous day
- Last month: This filter shows data for the previous month
- Last three months: This filter shows data for the last three months

- Month: This filter shows data from the selected month and year
- To use this filter, Last month or Last three months needs to be selected first
- Quarter: This filter shows data from the selected quarter and year
- To use this filter, Last month or Last three months needs to be selected first
- Custom: This filter allows you to select a custom date range to view data
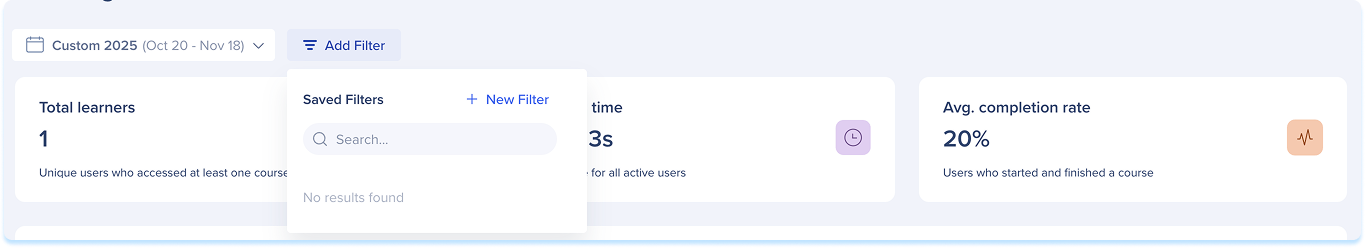
Add filters
Use the Add Filters feature to streamline your search and find information faster.
Export
Click the Export button to download a PNG file
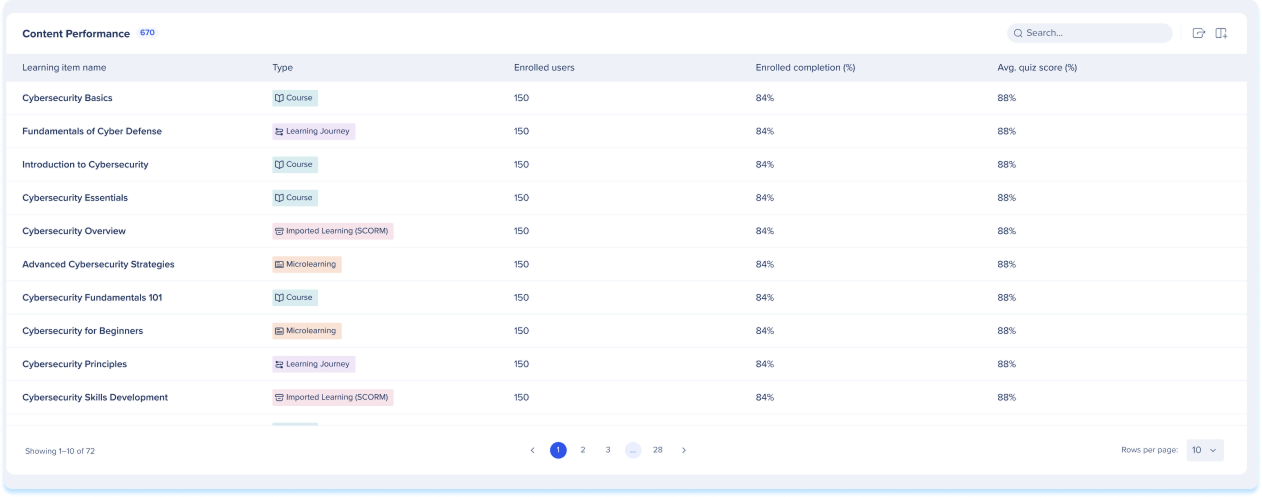
Content Performance table
The Content Performance table lists all learning items and their performance data.
Table columns
- Learning item name: The name of the course, learning journey, or microlearning
- Type: The content type
- Enrolled users: The number of learners enrolled in the item
- Enrolled completion (%): The percentage of enrolled learners who completed the item
- Avg. quiz score (%): The average quiz score across all learners for this item
Select any row to open the item's inner page and view detailed learner-level data.
Manage Columns
- Remove or add columns from the table
- Click the Manage columns icon
- Select which columns you'd like to have in the table
- Click Apply
Search bar
- Use the Search bar to quickly find the learner you need
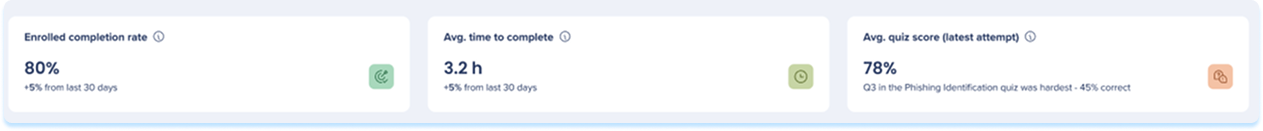
Course Inner Page
Select a course from the Content Performance table to open its inner page. This page shows completion, time, and quiz performance data for that course.
Enrolled completion rate
The completion rate for this learning item among assigned and self-enrolled learners in the selected period
Avg. time to complete
The average time between starting and completing this item
Avg. quiz score (latest attempt)
The average score across all quizzes within this item, counting only the first attempt
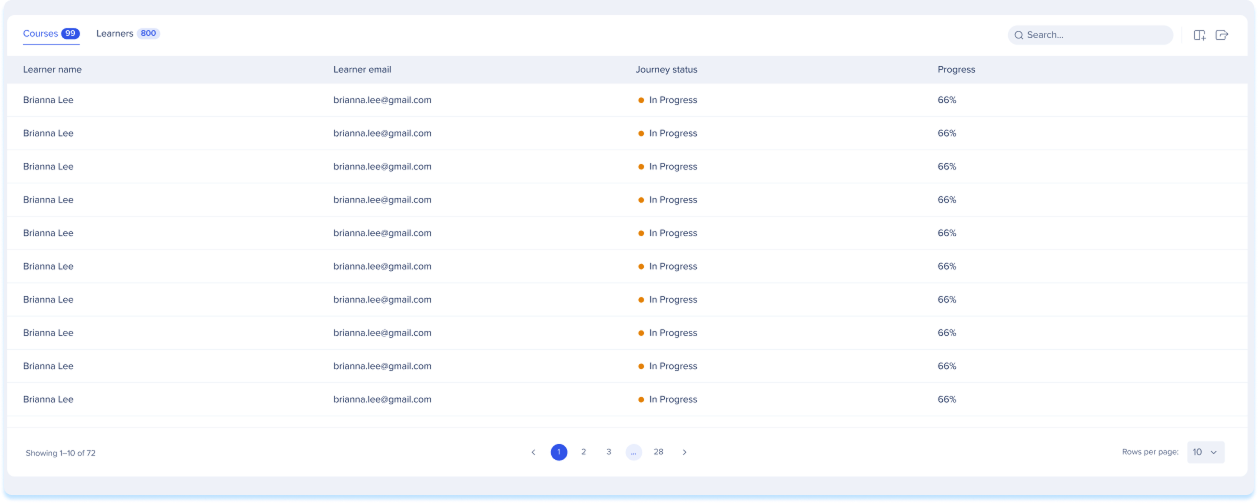
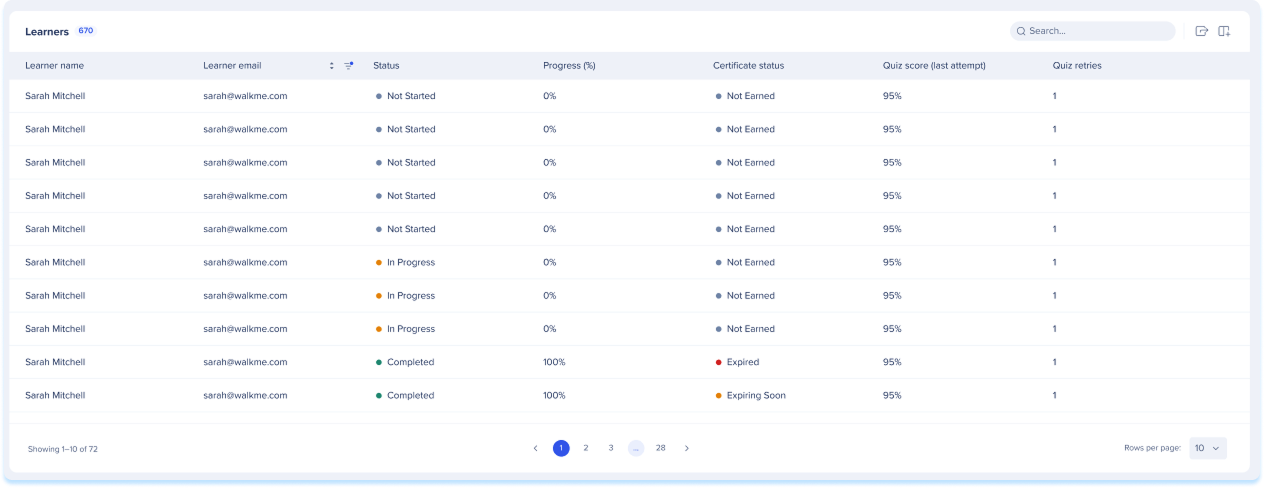
Learners table
The Learners table shows individual performance data for each enrolled learner.
Table columns
- Learner name: The learner's full name
- Learner email: The learner's email address
- Status: The learner's current course status
- Progress (%): The learner's completion progress as a percentage
- Certificate status: The learner's certificate status
- Quiz score (last attempt): The learner's most recent quiz score
- Quiz retries: The number of times the learner has retried the quiz
Learning Journey Inner Page
Select a learning journey from the Content Performance table to open its inner page. This page shows completion, time, and quiz data for the journey as a whole, with separate tabs for course-level and learner-level views.
Journey completion rate (enrolled)
Percentage of enrolled learners who completed this journey in the selected period.
Avg. time to complete
The average time learners take between starting and completing the learning journey in the selected period
Avg. quiz score (latest attempt)
Average score across all quizzes in this learning journey, using each learner's latest attempt in the selected period

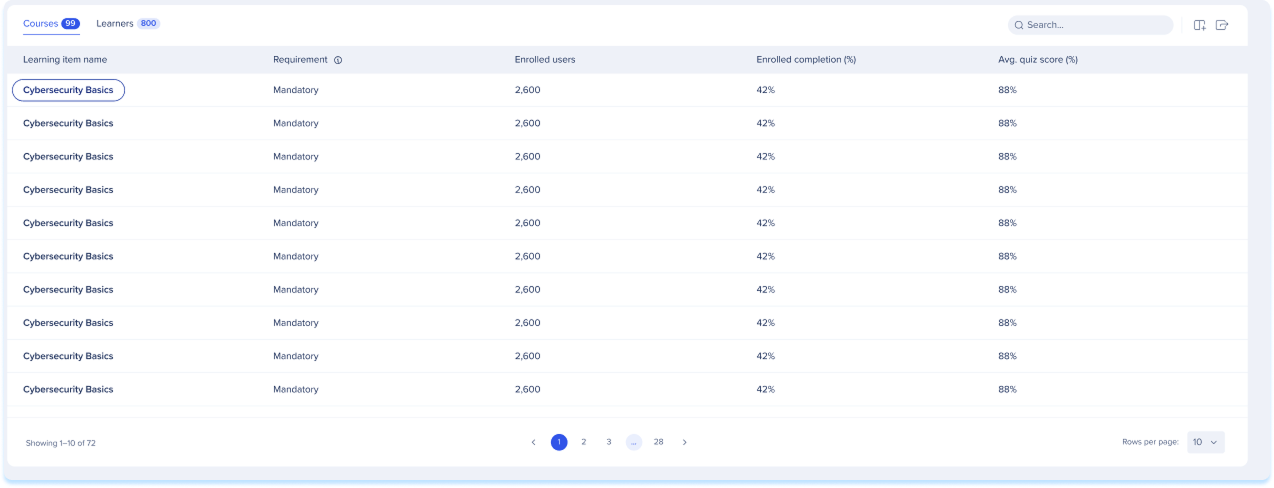
Courses tab
The Courses tab lists the individual courses within the learning journey.
Table columns
- Learning item name: The name of the course within the journey
- Requirement: Whether the course is Mandatory or optional
- Enrolled users: The number of learners enrolled in the course
- Enrolled completion (%): The percentage of enrolled learners who completed the course
- Avg. quiz score (%): The average quiz score for this course
Learners tab
The Learners tab shows individual progress data for each enrolled learner.
Table columns
- Learner name: The learner's full name
- Learner email: The learner's email address
- Journey status: The learner's current status in the learning journey
- Progress: The learner's overall progress through the journey