Brief Overview
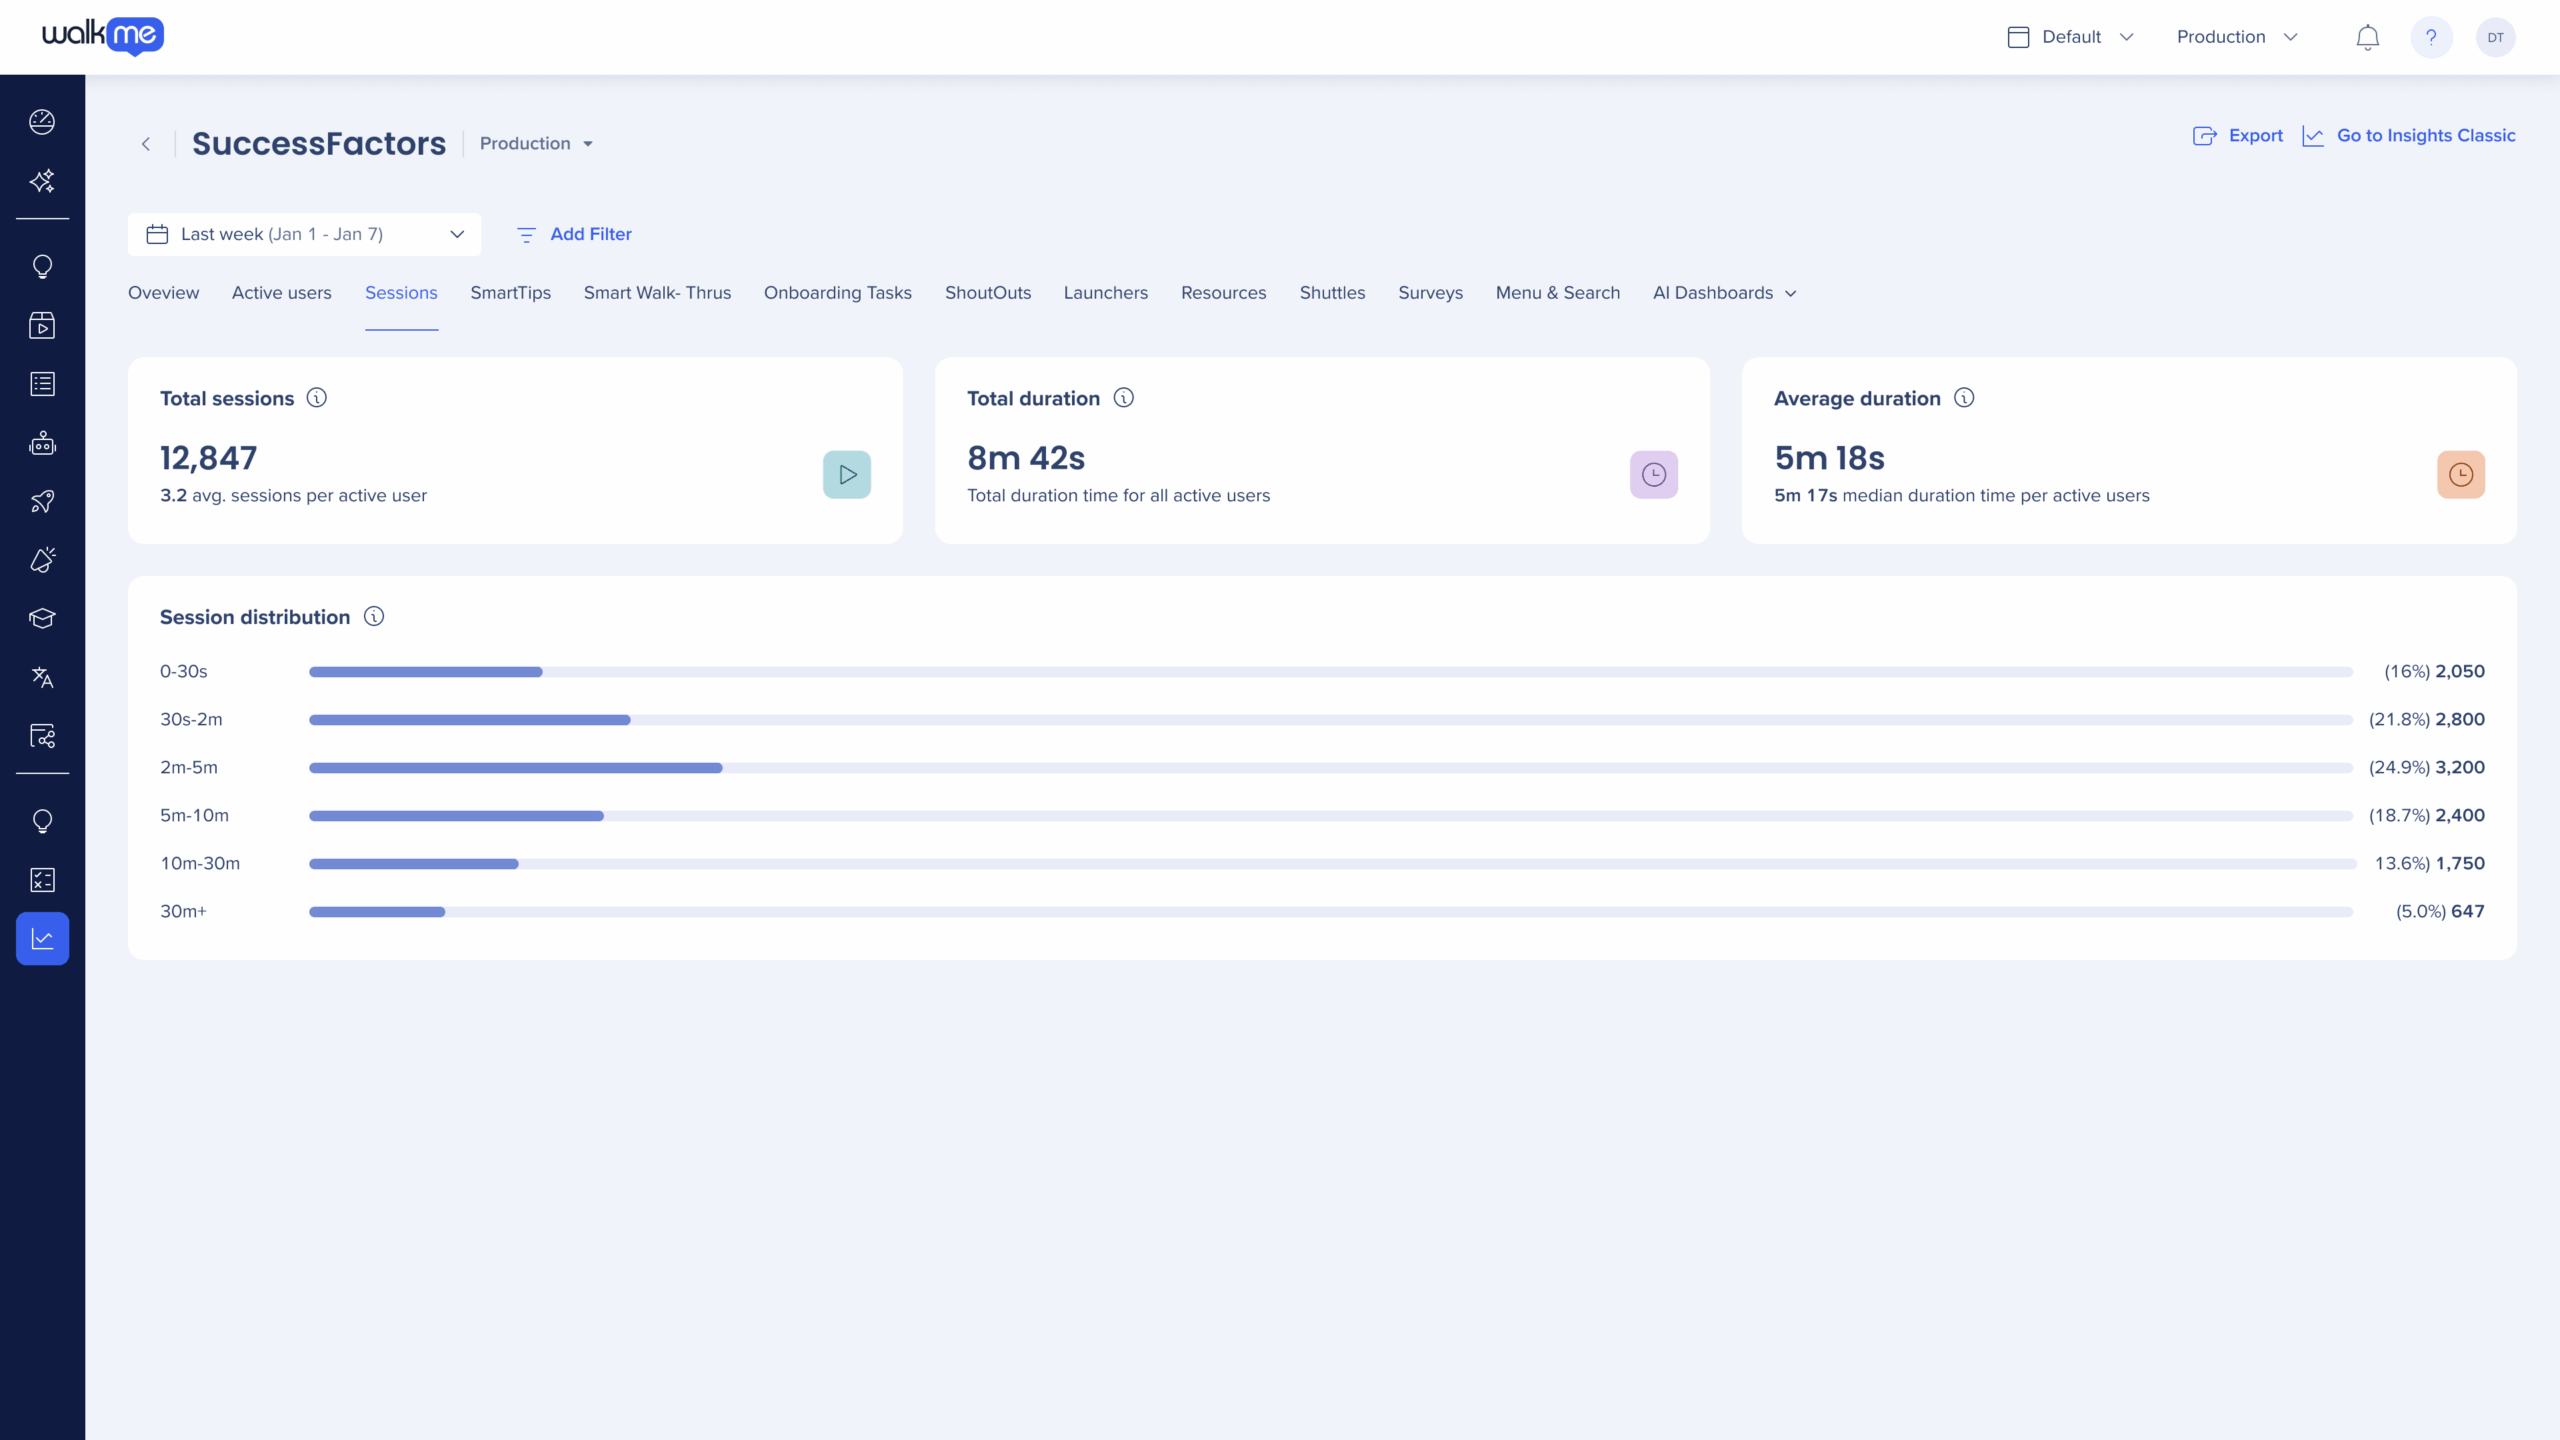
The Session tab in WalkMe Insights provides an overview of user activity within sessions, helping you analyze session volume, frequency, and engagement time.
These widgets give visibility into how often users return, how long they stay active, and how activity varies across your selected time range.
Use this tab to:
-
Identify session trends and activity levels
-
Compare average and median session times
-
Understand typical user engagement duration
Access
- Go to WalkMe Console
- Select the Insights tab from the left navbar
- Choose a system from the Monitored Systems widget
- Select the Sessions tab
The dashboard updates automatically according to your selected filters and date range. Some filters may not be supported in the Sessions tab.
How It Works
What is a session?
Insights considers a session to be a single visit of a user to your website or application; a session must contain one or a series of events.
A session begins when a user reaches your website/application, and it lasts until there is 30 minutes of inactivity, or for up to 12 hours, whichever comes sooner.
If a user is idle during a session for more than 30 minutes and then becomes active again, the subsequent activity is part of a new session.
Note
A session will continue even if users navigate between different tabs or subdomains (For example, from http://www.example.com to blog.example.com), so long as the WalkMe snippet is installed on both websites.
General session metrics
Analyze total session activity and frequency of user visits over the selected time period.
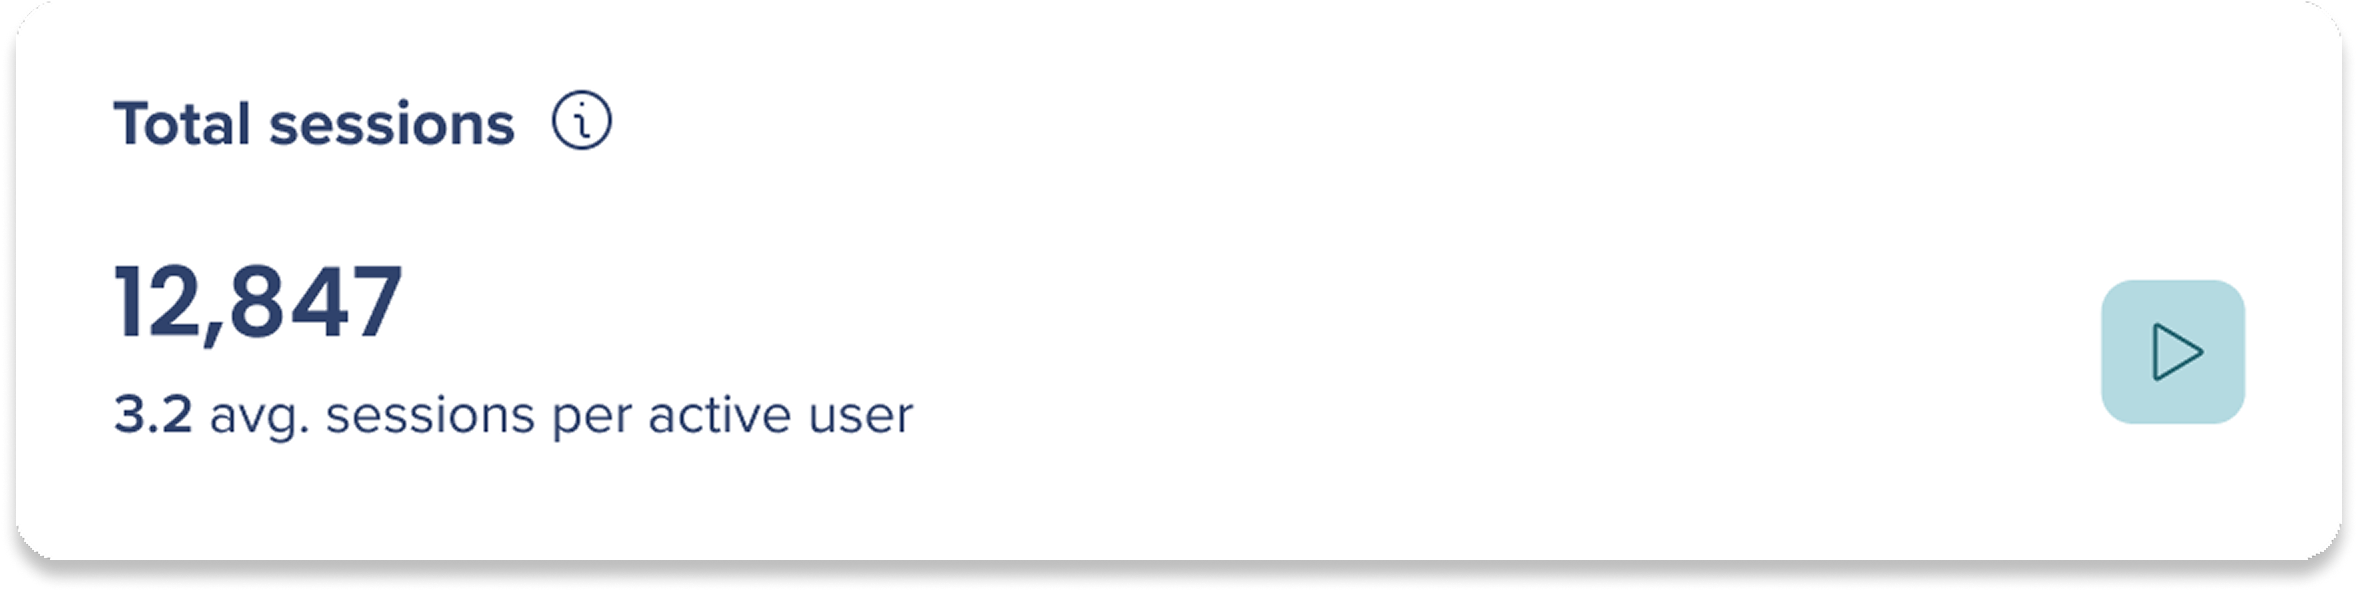
- Total sessions: Total number of sessions that match the filter and date criteria
- Average sessions per active user: Average number of sessions per unique active user during the selected time range
- Calculation: Total number of sessions / Total number of unique active users
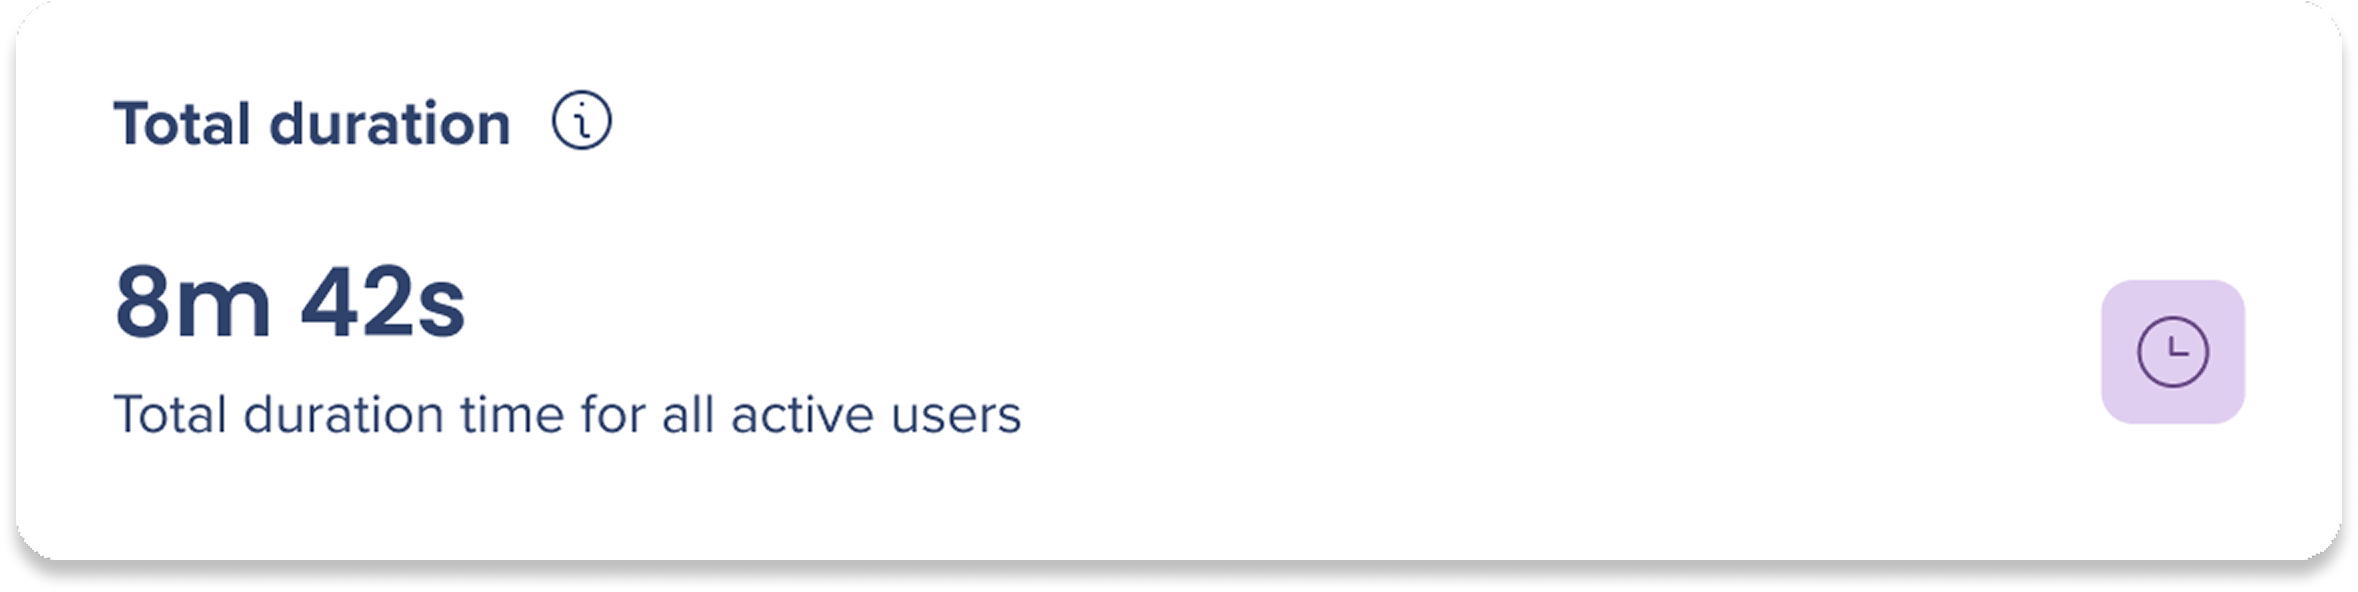
- Total duration: Total time users spent across all sessions that match the filter and date criteria
- Average duration: Average session duration per active user that match the filter and date criteria
- Calculation: Total session time / Number of active users
- Median duration time per active user: Midpoint of all users' average session duration when comparing shortest to longest

Session distribution
Analyze the distribution of session lengths that match the filter and date criteria.
- The chart groups sessions into six equal time buckets, from shortest to longest, so you can see whether most users have short or extended sessions
- Calculation: (maximum session length − minimum session length) / 6
- Each bucket count represents the number of sessions whose duration falls within that range

Additional Features
- Clicking the number of sessions opens a right-hand panel showing sessions by User ID
- All session widgets are also available in the Widget Gallery → Sessions section, and can be added to Custom Dashboards
Session Data Elsewhere in Insights
Session-based metrics are available in additional Insights locations, helping you view session engagement in context across the platform.
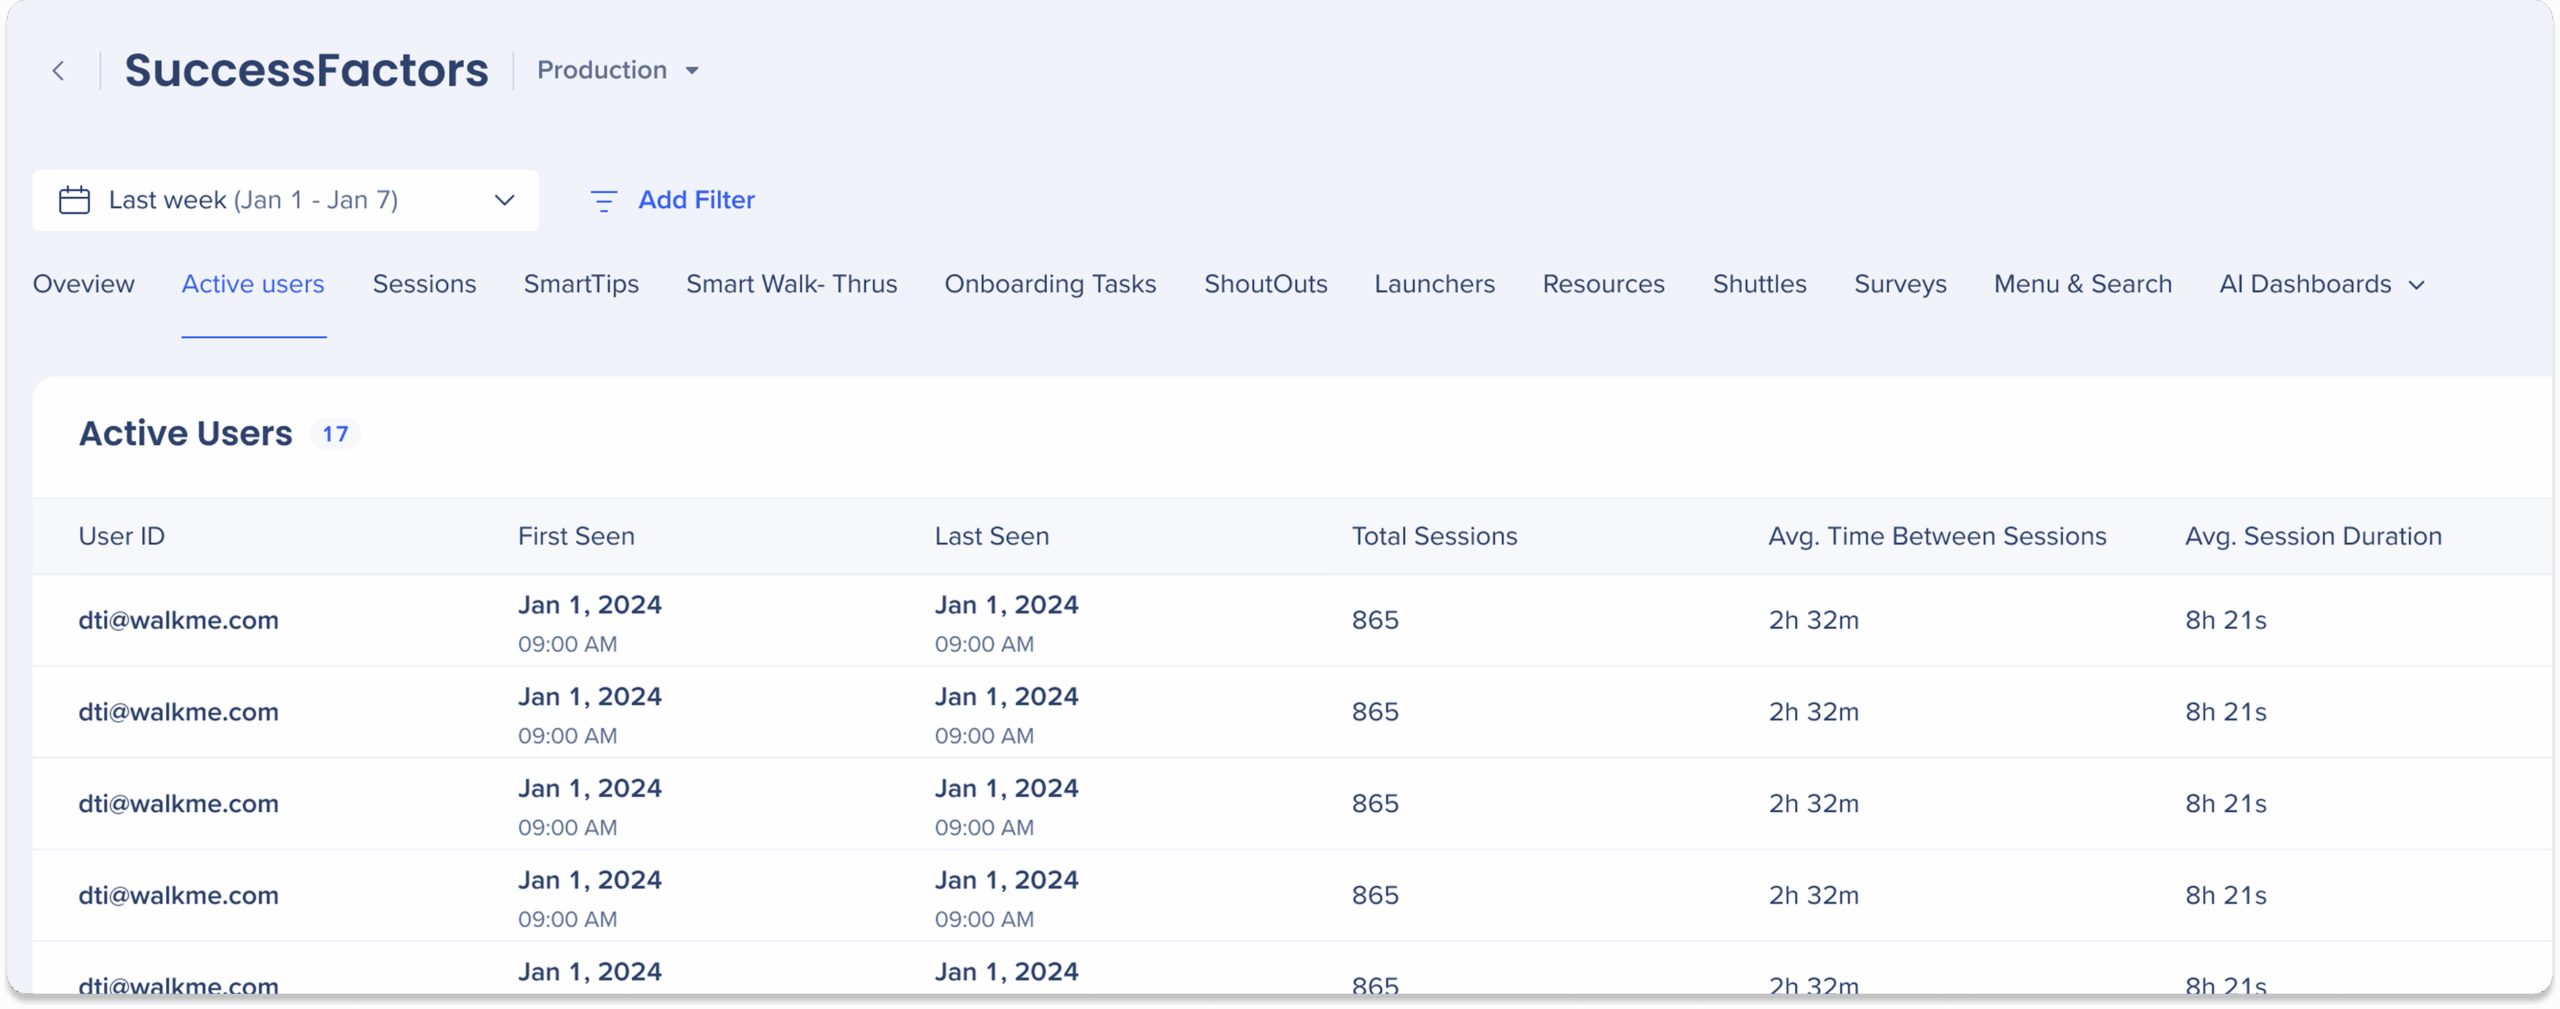
Active users tab
Display session-level details per user directly in the Active users table.
Three columns are available in the Active users tab for session data:
- Total sessions: Total number of sessions per user that match the filter and date criteria
- Average time between sessions: Average time elapsed between consecutive sessions for each user
- Calculation: Sum of time differences between session start times / Total number of sessions
- Example: If a user had sessions spaced 2 hours, 3 hours, and 1 hour apart, the average time between sessions = (2 + 3 + 1) / 3 = 2 hours
- Average session duration: Average length of each session for that user
- Calculation: Total duration spent across all sessions / Total number of sessions
Note
Session numbers in the Active Users tab are calculated per user, not per filter.
- This means each user's total activity within the selected date range is shown, even if only part of it matches the filter
- If a user has 200 total sessions overall, and you filter for “Users who interacted with Smart Walk-Thru X”, this user will still appear with 200 total sessions, even if only some of those sessions included interactions with Smart Walk-Thru X
System overview tab
The User Interaction with WalkMe by Content Type widget now includes an additional metric:
- Average Interactions per Interactive User: Average number of interactions performed by users who engaged with at least one WalkMe item in the selected time range.
- Calculation: Total interactions / Total interactive users
This metric helps you understand how actively users engage with WalkMe content in relation to their overall session activity.

Technical Notes
Data Filtering


