Brief Overview
The Insights Overview page provides numerous reports populated with your Insights Collected data. The page provides charts, graphics, and tables that show users' usage of your website or application.

Overview Page Breakdown
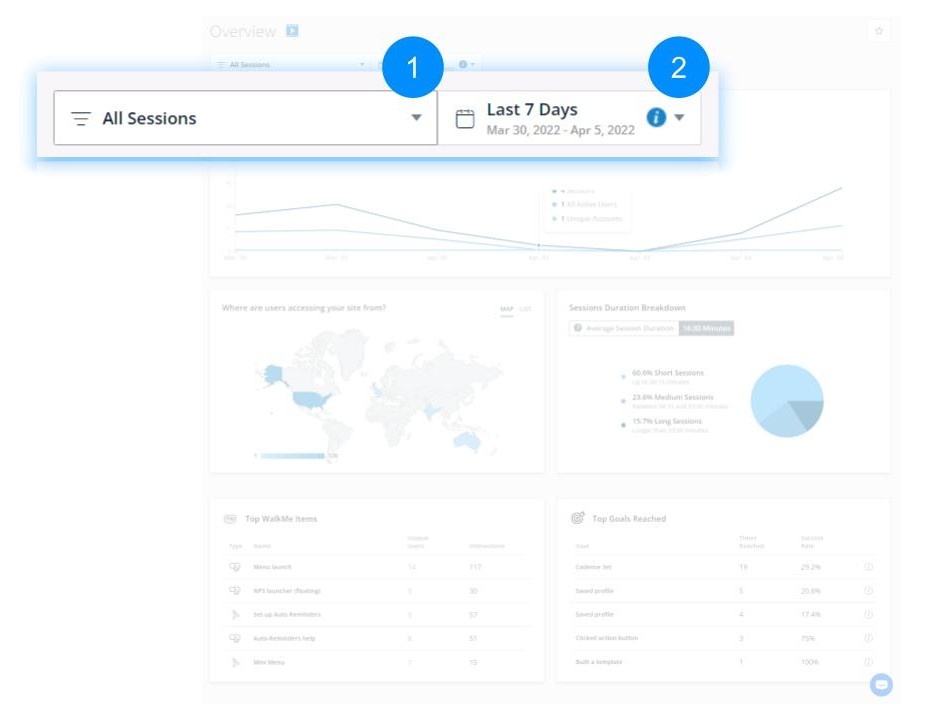
Filters and Date Pickers
The data shown on every report on this page relates to the chosen filters.
- Filters: Contains every saved filter defined in the Sessions page
- Date Picker: Changes the date range for data
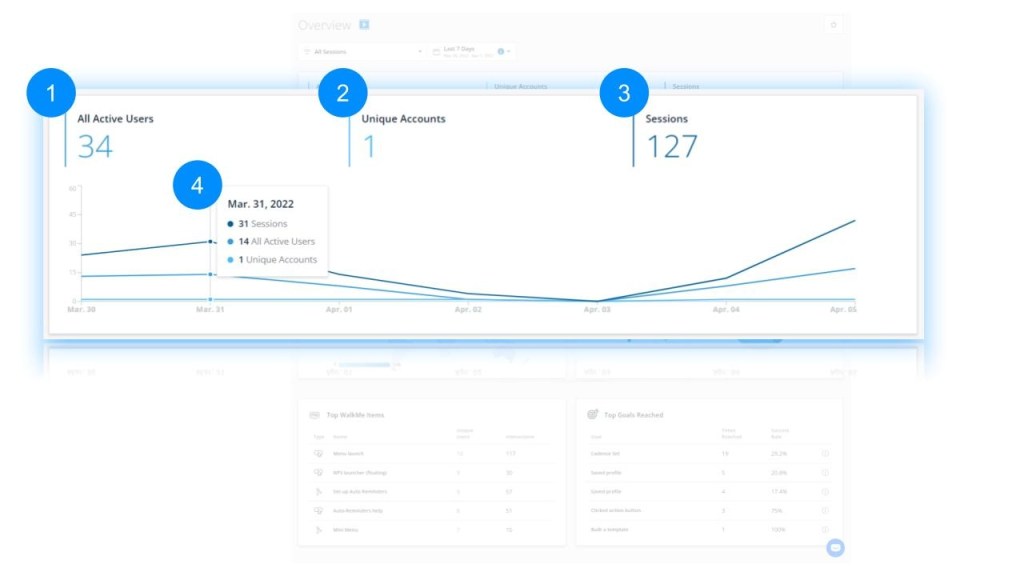
General Usage Metrics
-
- Unique Accounts
- The total count of accounts who visited the website or application in the selected filter & date range
- Sessions
- A session is a single visit of a user to your website or application
- Session Chart
- Chart showing the number of sessions and unique users per session count over time
Users Panel
Note
The panel is limited to results with 10,000 users or less - beyond that you must export a report.
Tip
In the panel you can use the search bar to search for users, sort by user name in the user column, as well as filter values under the Country column.
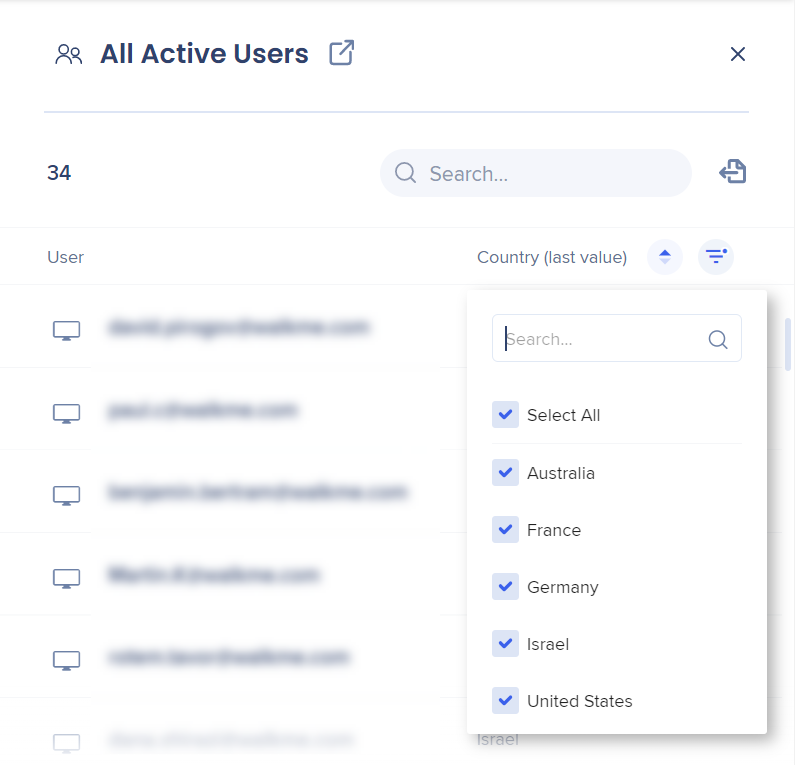
You can use the icon to open the users list in a separate tab and display the full list of users.
The list displays users that match the date range, the filter, and the metric selected in the Overview page.

Traffic Map
- Map
- A heat map where countries are color-coded based on the number of sessions occurring within them
- List
- Shows a list of the top five countries by session count
Tip
Hovering over a country shows the count of sessions from that country and that country's percentage of total sessions.
Sessions Time Breakdown
Breakdown of all different session durations into one of three categories based on the average session duration:
- Short Sessions
- Sessions shorter than 50% of the duration of the average session
- Medium Sessions
- Sessions 50%-200% in duration compared to the average session
- Long Sessions
- Sessions at least twice as long as the average session

Top WalkMe Items
This table shows the top five most interacted-with WalkMe items.
It includes the following information for each item:
- Application type
- Item name
- Number of unique users that interacted with the item
- Total count of interactions
Insights Apps Overview Page

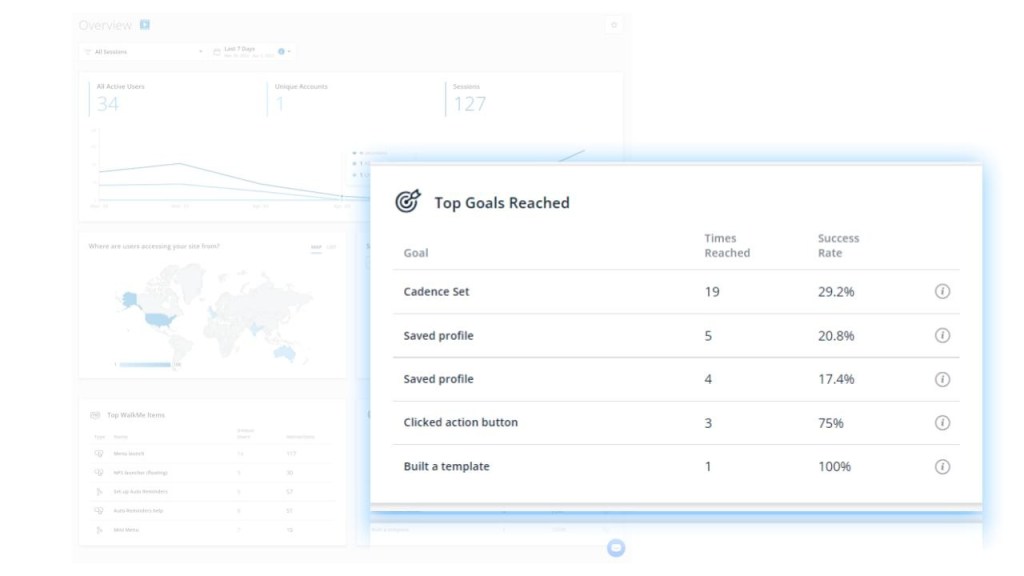
Top WalkMe Goals
This table shows the top five WalkMe Goals reached from all applications.
It includes the following information for each item:
- Goal name
- Times reached
- Success rate
- The percentage of time the Goal was reached out of the total times the associated item was interacted with
Tip
Hover over the "i" icon to see the associated item.