Brief Overview
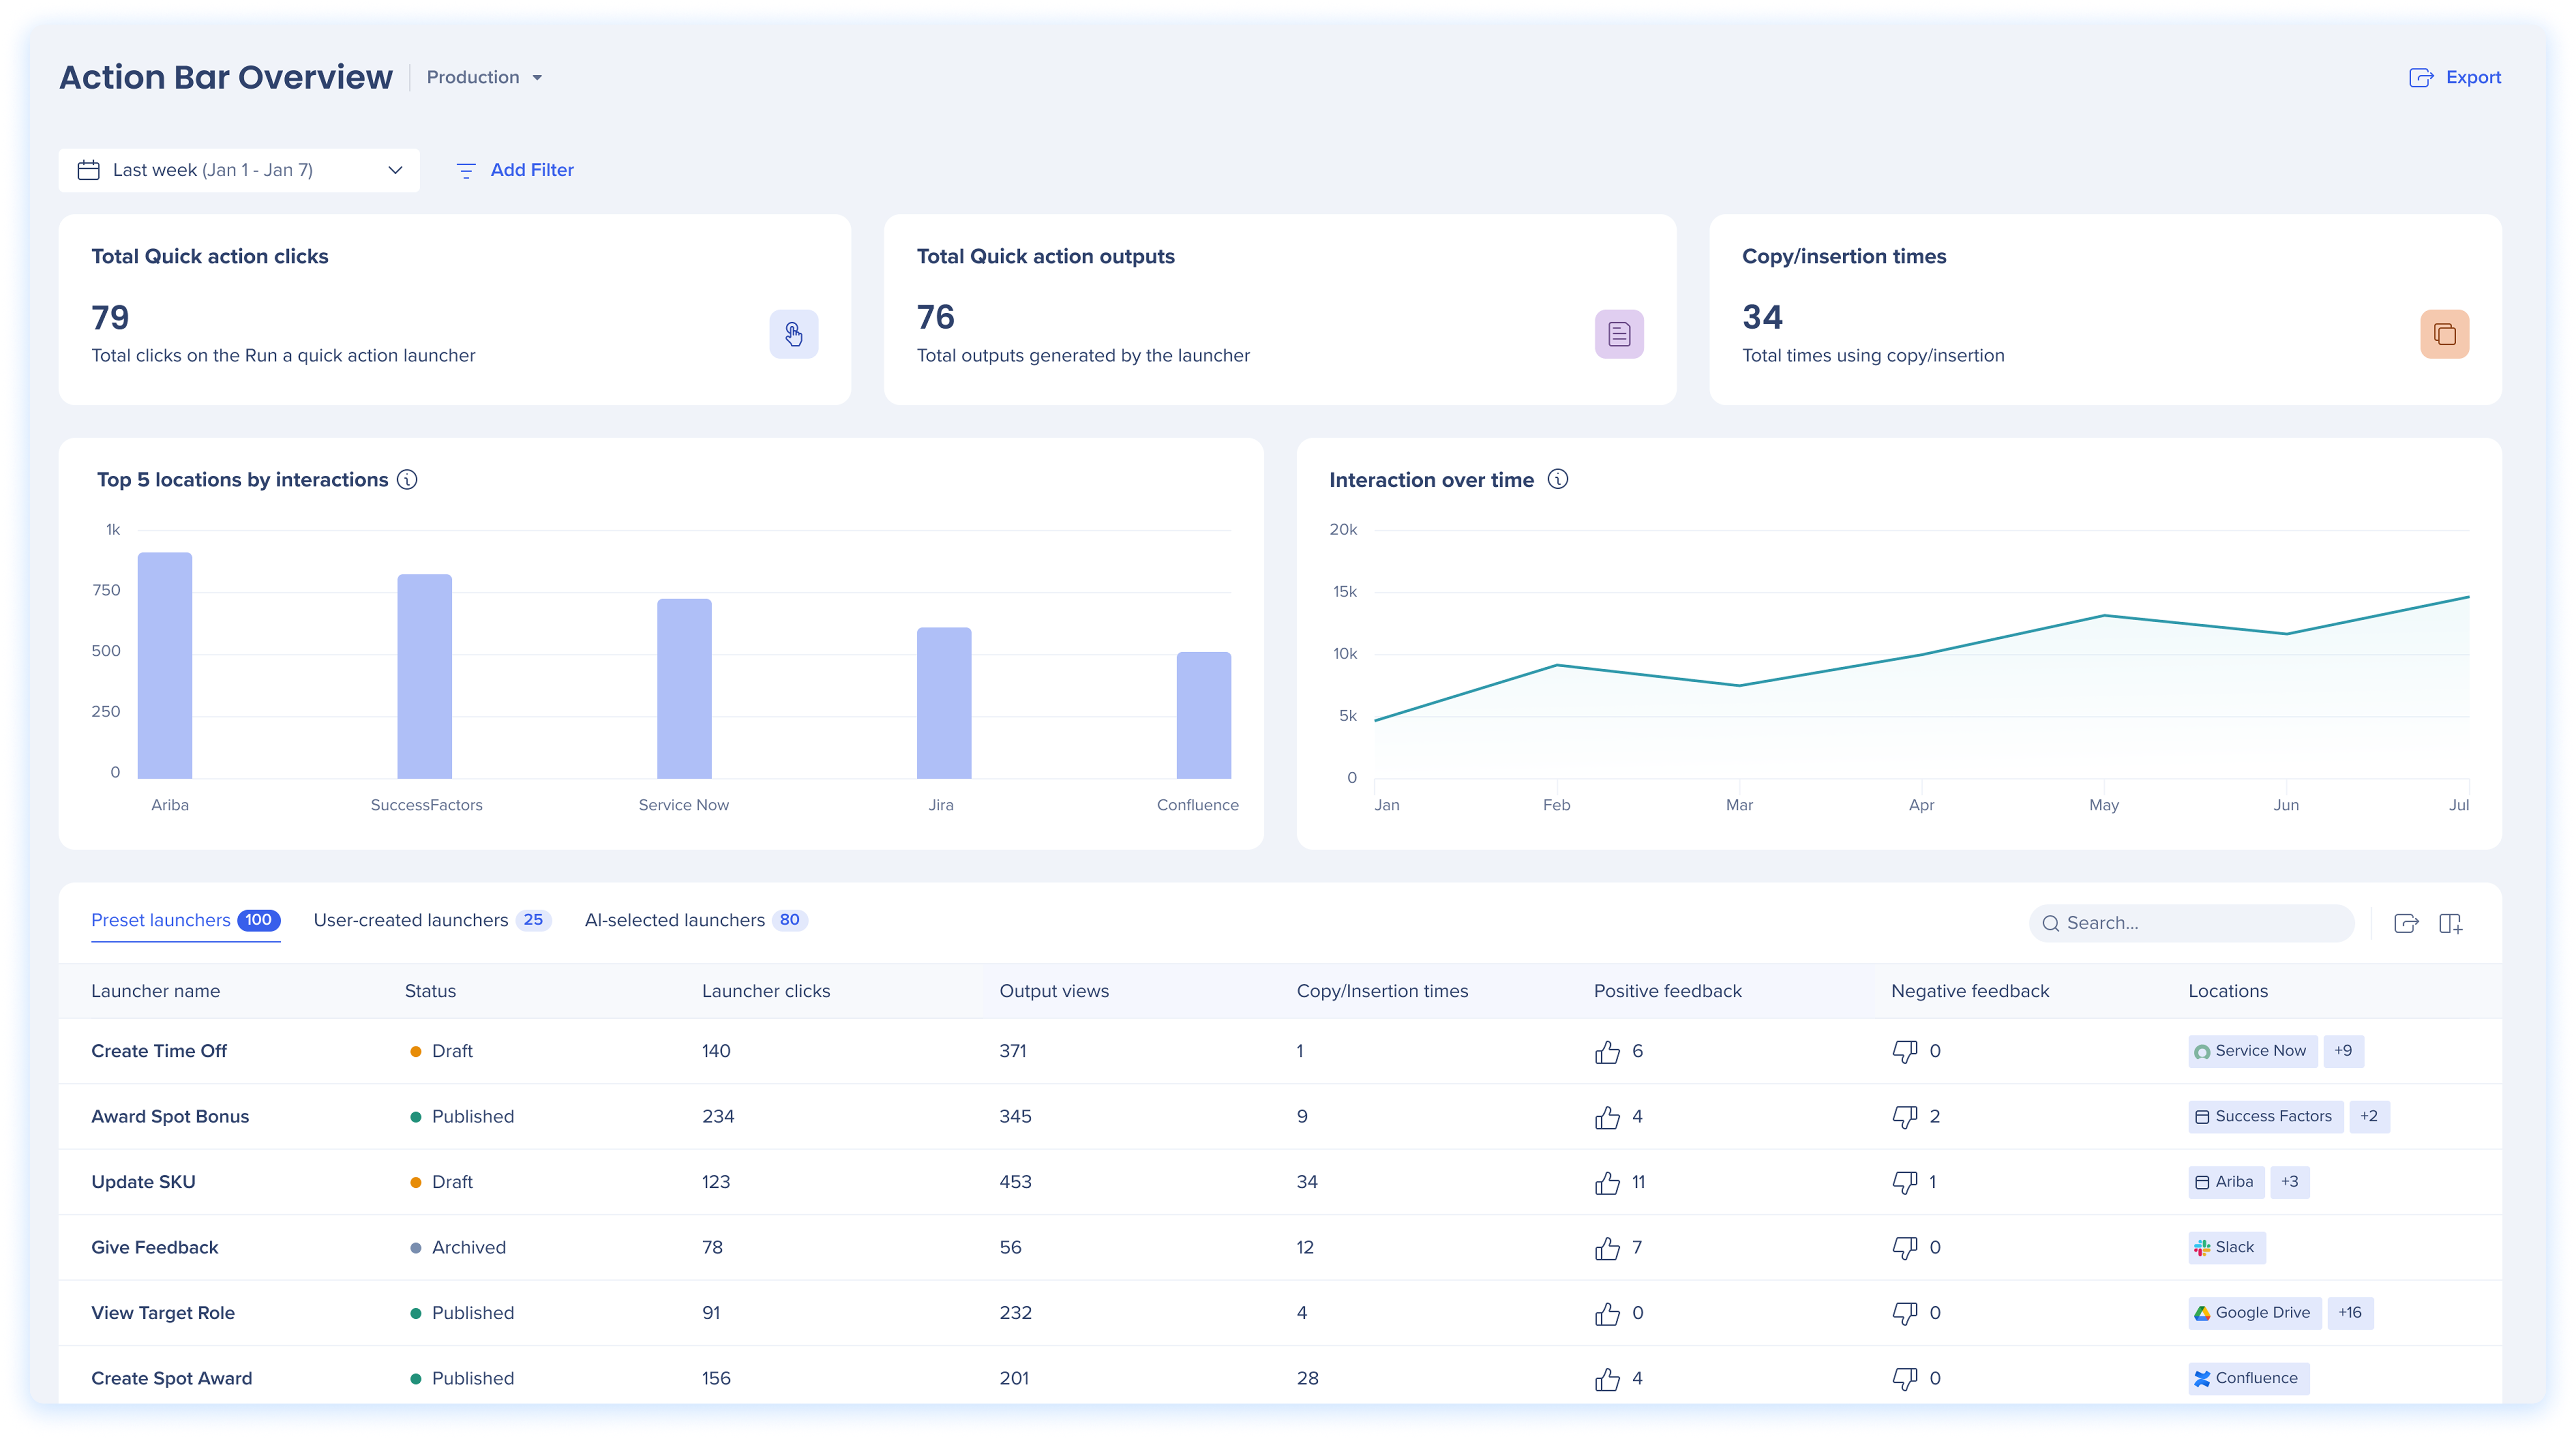
The Action Bar Overview dashboard provides a unified view of Action Bar performance across your organization. It brings together interaction data from every location where the Action Bar is active.
By centralizing metrics for Run a quick actions and different launchers, it allows you to track global impact, identify high-engagement areas, and understand how users interact with personalized assistance across your entire digital ecosystem in one place.
Access
Access the Action Bar Overview page from the Action Bar app in the console.
AI-Enabled Action Bar Building in Console
How It Works
The dashboard aggregates interaction data to show how frequently launchers are exposed to users and how often they result in successful outputs or copies. Learn about the dashboard widgets:
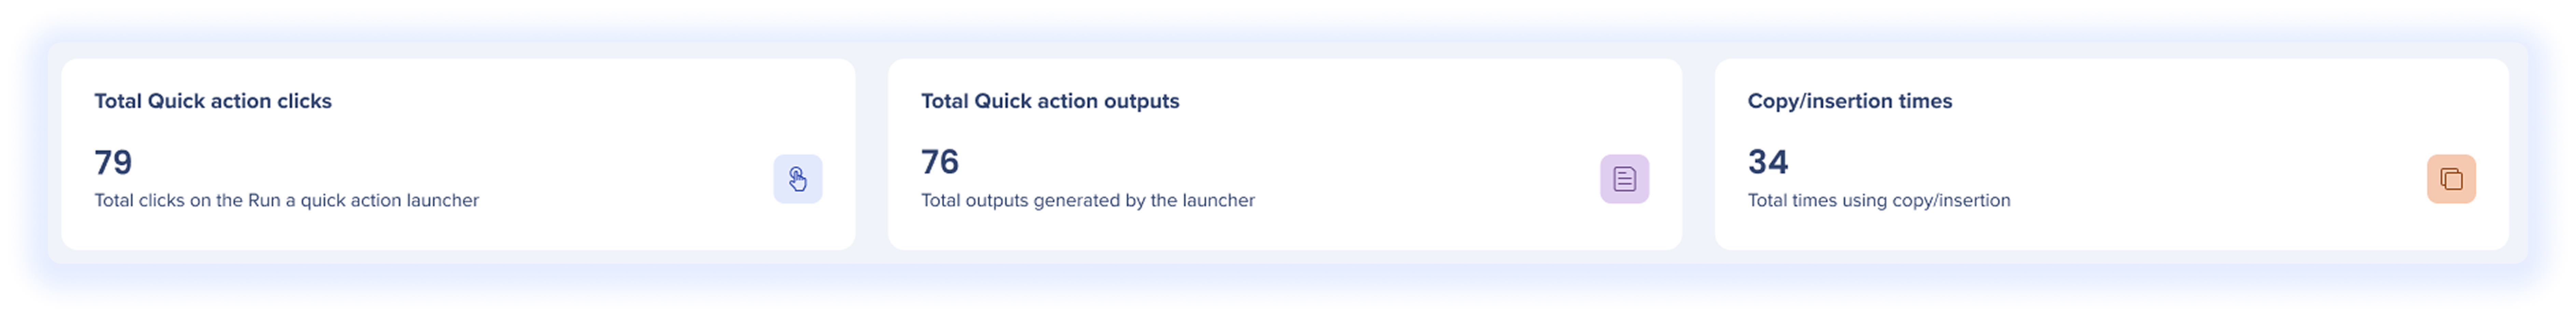
Provides high-level metrics across all locations for the Run a Quick Action launcher.
-
Total Quick action clicks: The total number of unique users who clicked the Run a quick action launcher
-
Total Quick action outputs: The total number of outputs produced by the Run a quick action launcher
-
Copy/insertion times: The total number of times the Run a quick action output was copied or inserted
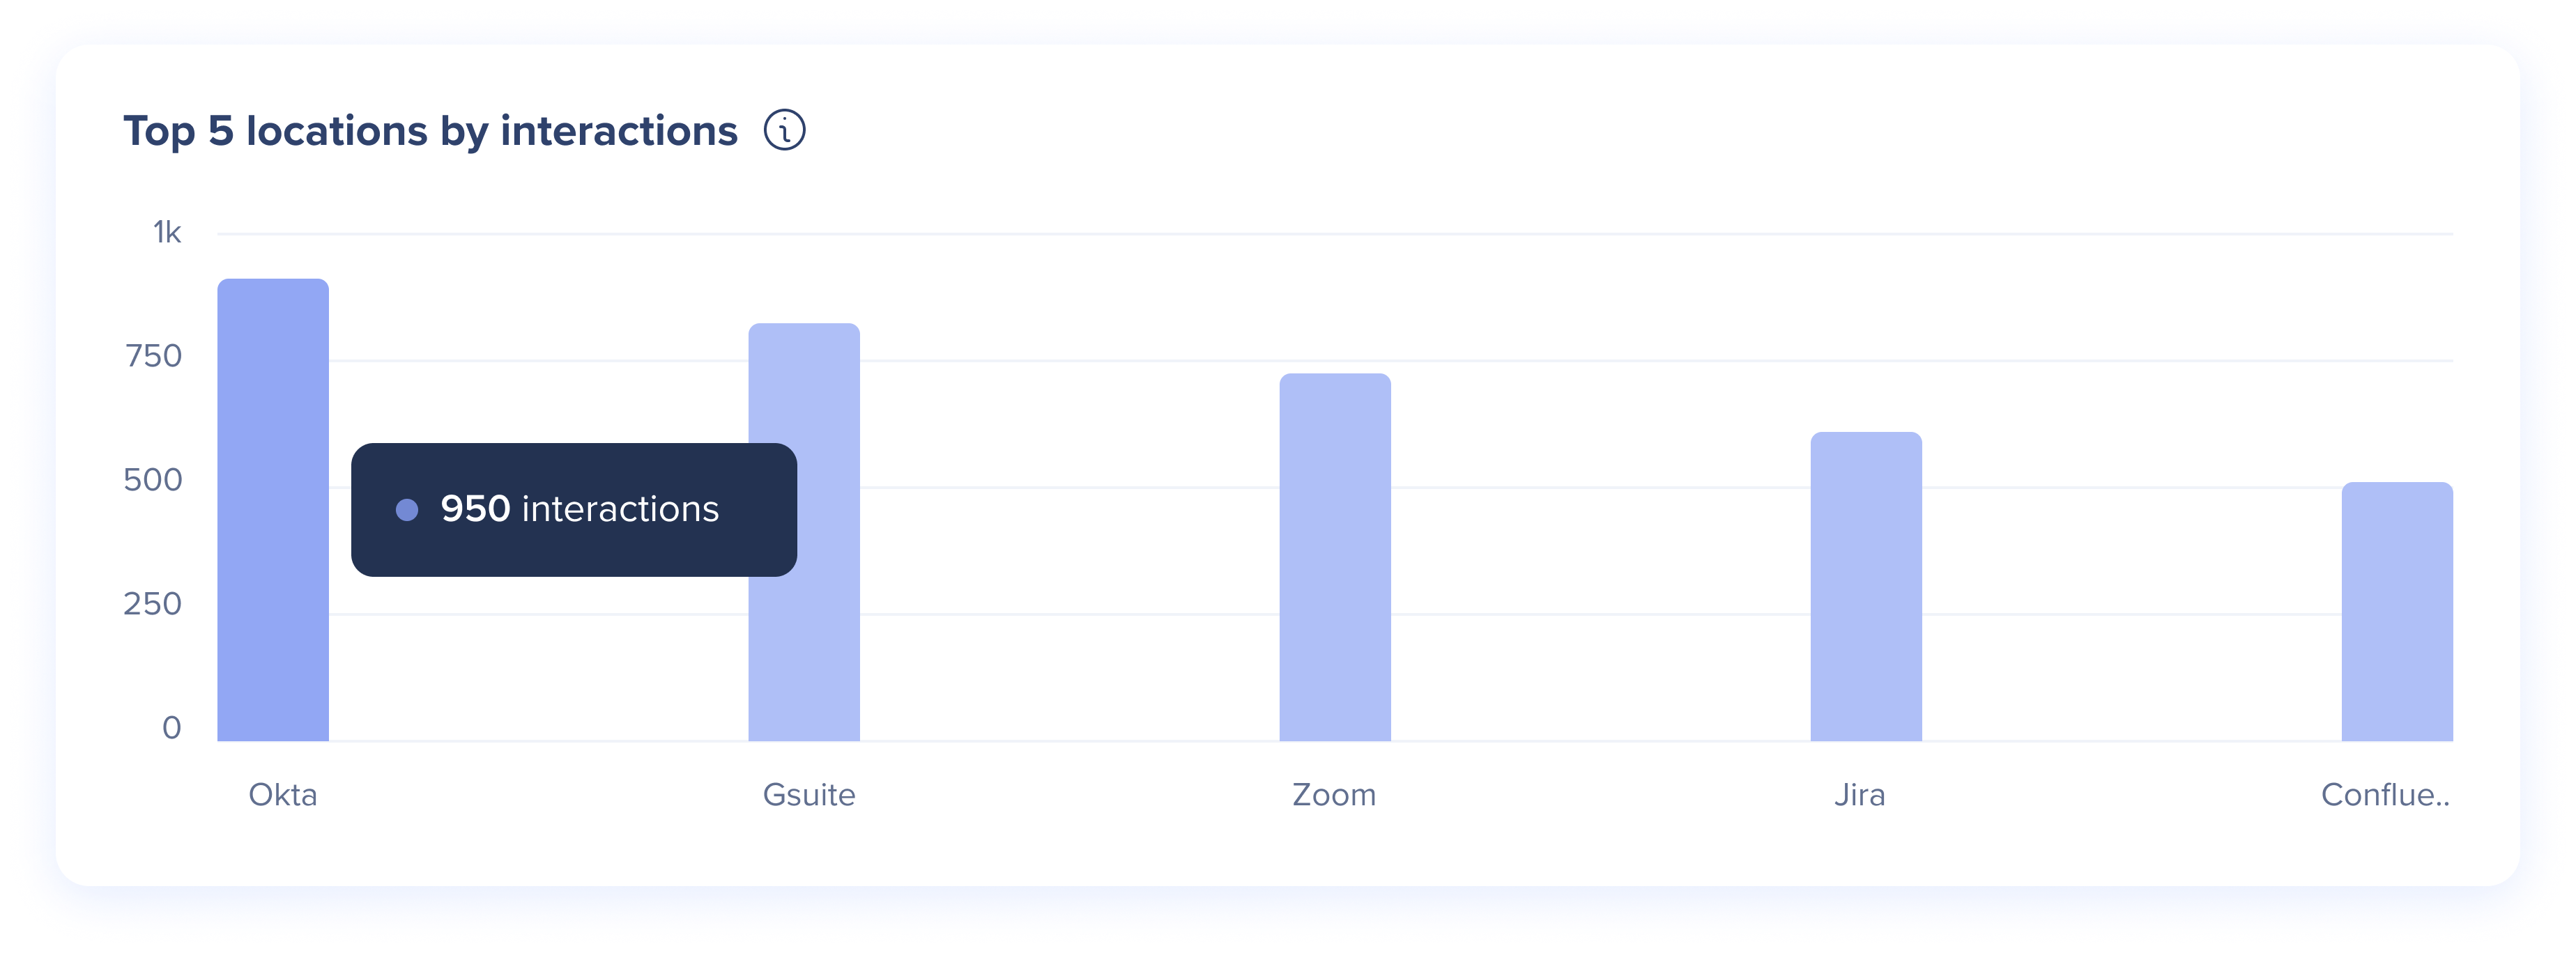
Top 5 locations by interactions
Tracks the top 5 locations where the Action Bar was most used.
Interaction over time
Shows the trend of interactions over the selected date range.
Launchers overview table
Tracks specific performance across the three types of launchers.
Select a tab to see data for a specific launcher type:
-
Preset launchers: Builder created launchers
-
User-created launchers: Custom launchers created by end-users
-
AI-selected launchers: Launchers that dynamically select the most relevant action from a curated set of AI skills or WalkMe content
Preset launchers
A summary of all launchers created by builders in the editor / console for detailed usage insights.
-
Launcher name: Name of the launcher
-
Status: The current state of the launcher's publication
-
Green: Published - The item is live and available to users
-
Grey: Archived - The item is no longer active but kept for record-keeping
-
Red: Deleted - The item has been removed and is no longer available
-
Orange: Draft - The item is still in development and not yet published
-
Launcher clicks: The total number of times this launcher was clicked
-
Output views: The total number of outputs created by this launcher (the generated output must be fully displayed to count)
-
Copy/insertion times: The number of times a generated output was copied/inserted by the user from this launcher
-
Positive feedback: The user clicked the positive feedback icon for this launcher
-
Negative feedback: The user clicked the negative feedback icon for this launcher
-
Locations: Systems where the launcher was played
Understanding locations
The Locations column shows where the Action Bar is live based on the builder's setup:
Learn more about preset launchers:
User-created launchers
A summary of all custom launchers created by end-users in the Action Bar for detailed usage insights.
-
Launcher name: Name of the launcher
-
Launcher clicks: The total number of times this launcher was clicked
-
Output views: The total number of outputs created by this launcher (the generated output must be fully displayed to count)
-
Copy/insertion times: The number of times a generated output was copied/inserted by the user from this launcher
-
Created by: User that created the custom launcher
How to Use the AI-Enabled Action Bar
AI-selected launchers
A summary of all actions displayed by AI-selected launchers for detailed usage insights.
-
Skill name: Name of the action displayed by the launcher
-
Skill plays: The number of times the AI displayed this action
-
Skill clicks: The total number of times this action was clicked
-
Click-through rate (%): Calculated by (total skill clicks / total skill plays)x100
-
Locations: Systems where the action was played
AI-Selected Launchers
Additional Features
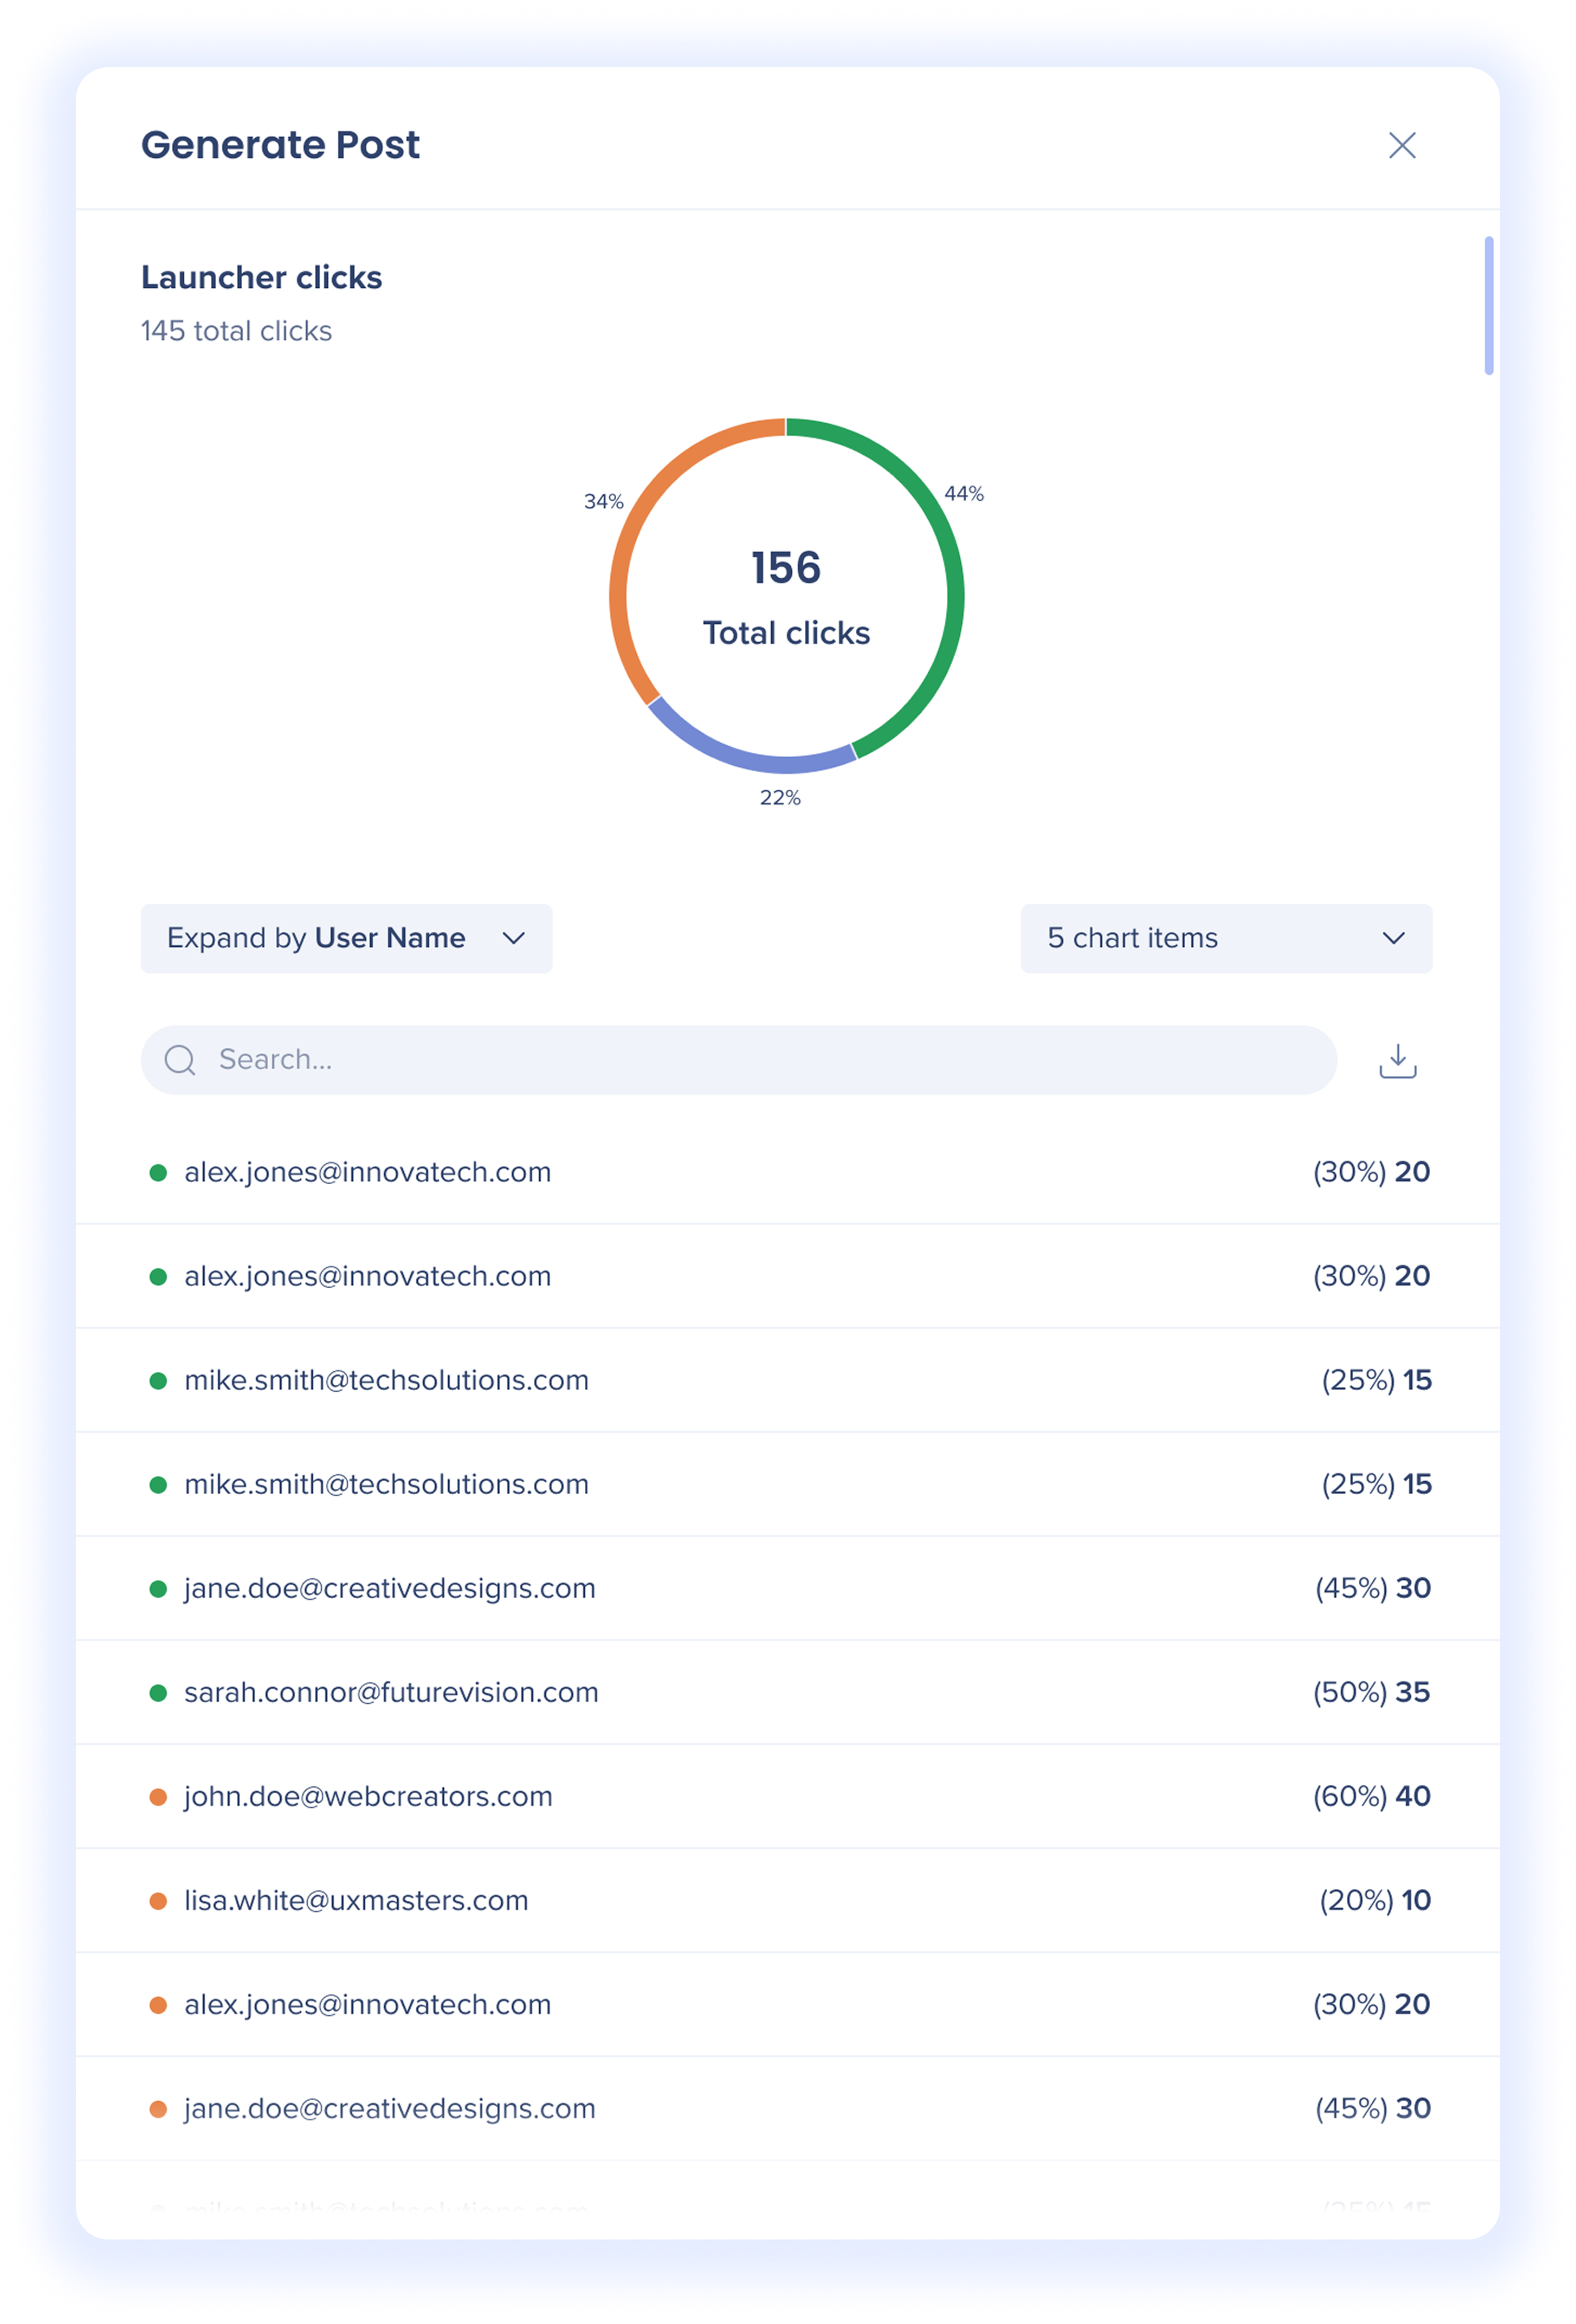
Deep dive side panels
Click a number from the widgets to open the deep dive side panel for more insights.
There are 4 different panels for launchers: Launcher clicks, Output views, Copy/insertion times, and Total Quick actions clicks.
-
Each pie graph displays the total number of clicks, output views, or copy/insertions on the specific launcher, and the percentages of which unique user clicked the launcher.
-
Click the Expand by dropdown to choose the user details you want to view
Filters
View and analyze a smaller part of your data set using filters.
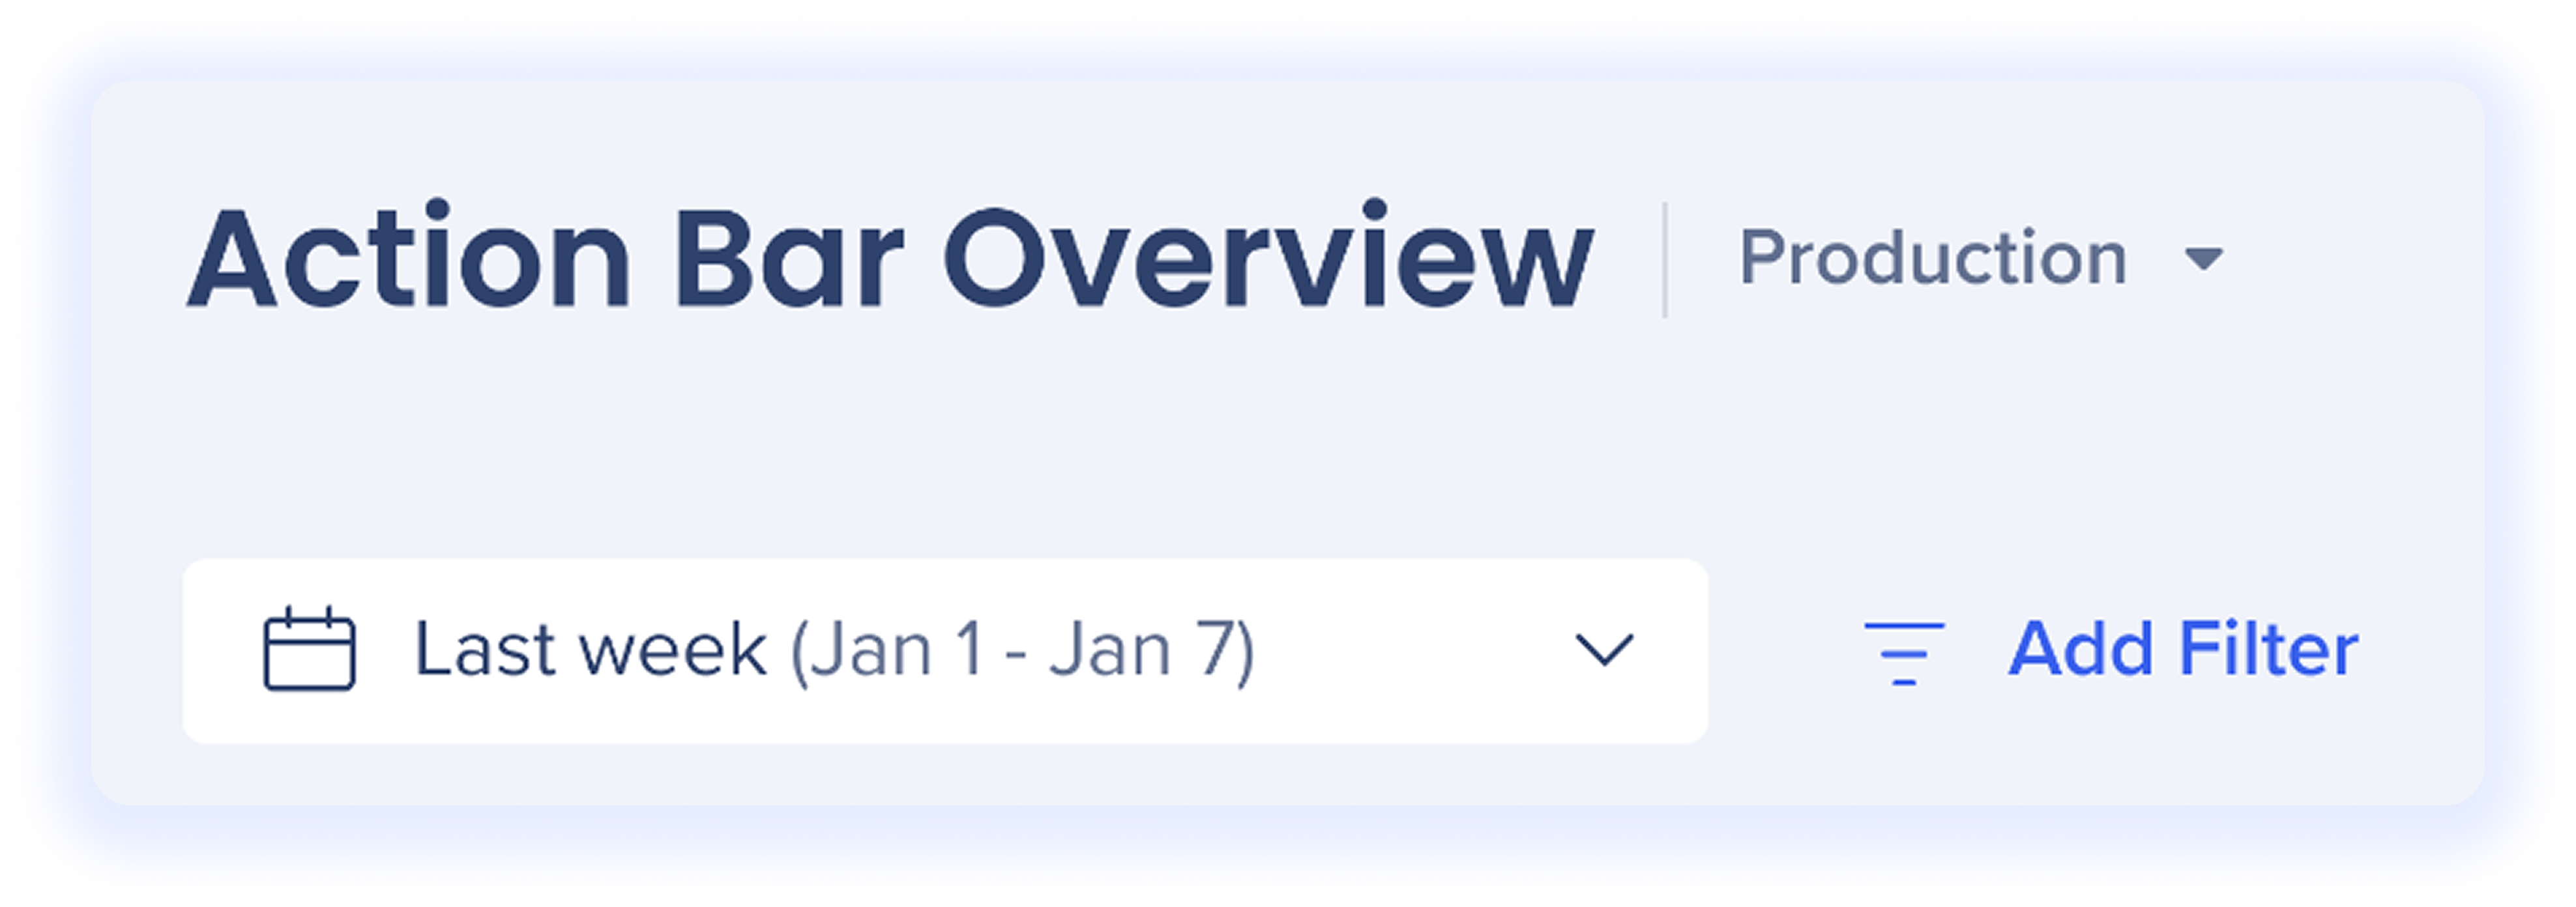
Date range options...
-
Today: This filter shows data from the current day
-
Last week: This filter shows data from the previous day
-
Last month: This filter shows data for the previous month
-
Last three months: This filter shows data for the last three months
-
Month: This filter shows data from the selected month and year
-
Quarter: This filter shows data from the selected quarter and year
-
Custom: This filter allows you to select a custom date range to view data
- Add filter: Use the Add Filter feature to streamline your search and find information faster
Data Filtering
Export
Click the Export button to download a PNG file. 
Table icons and search
Table icons
Search bar

Technical Notes
-
These widgets cannot be added to a custom dashboard
-
AI-selected launchers cannot appear in flow analytics, custom widgets, standard events, or reports
-
Only multi-system launchers are available for selection in filters
-
Users can only view one custom environment at a time, even if multiple custom environments share the same name
-
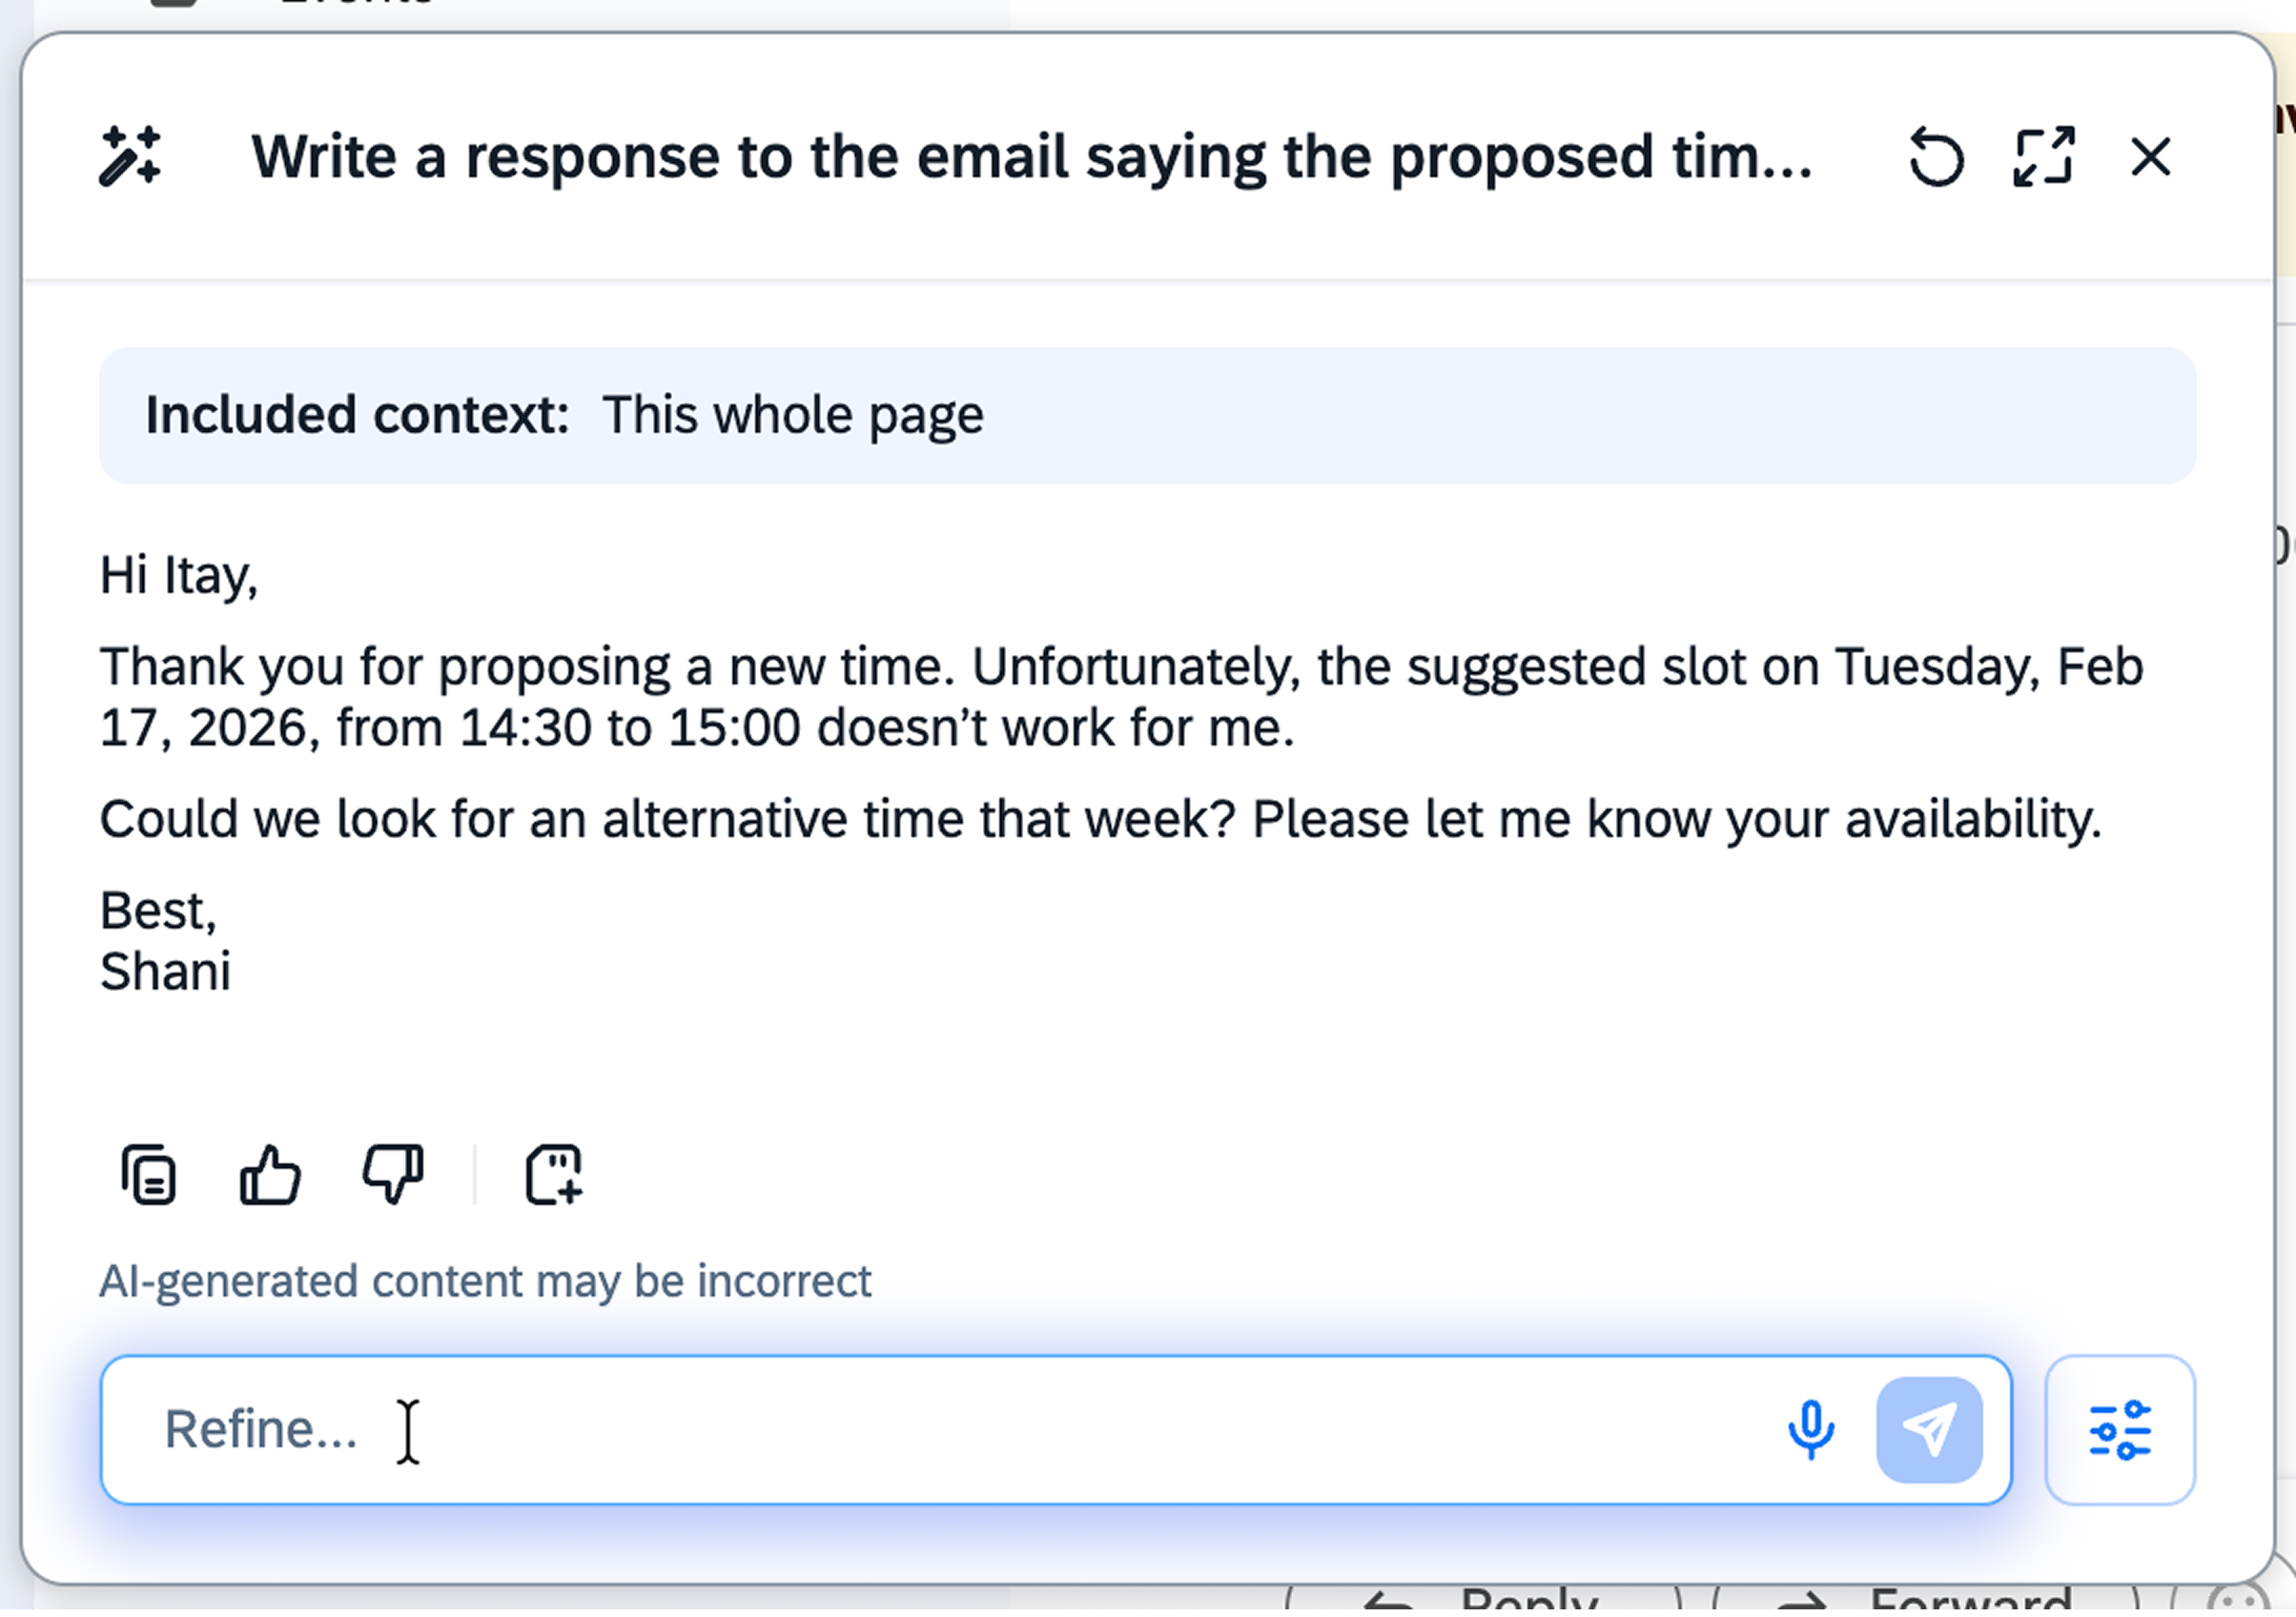
If you notice more output views than launcher clicks, it's due to the refine option in the Run a quick action launcher output box