Brief Overview
UI Intelligence (UII) offers actionable user behavior analysis that drives digital transformation to meet business goals. Once data is collected, you can discover trends in form usage over time to understand the impact of changes.
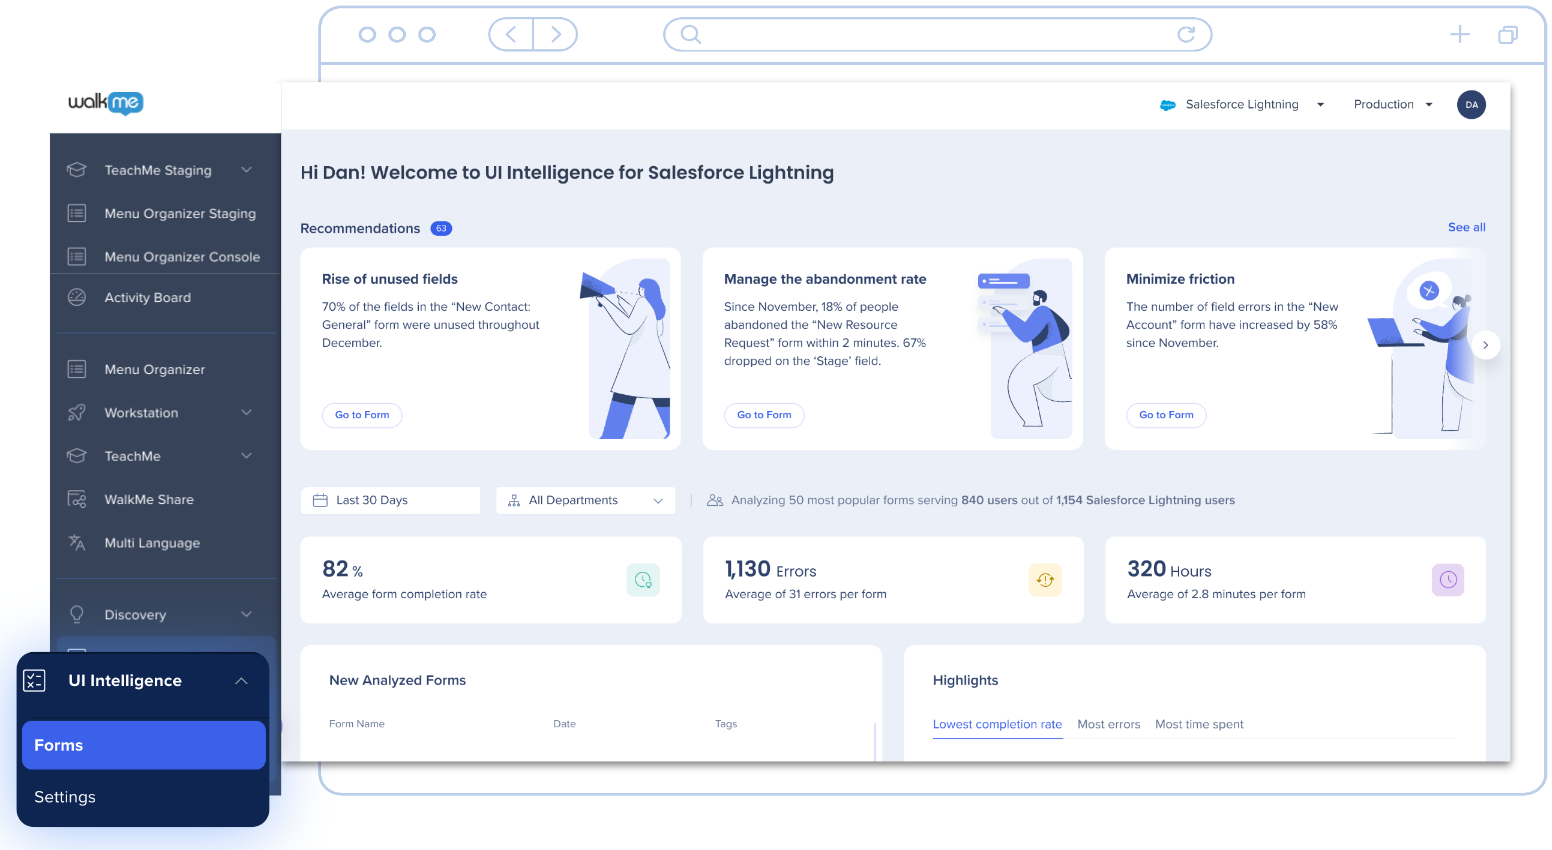
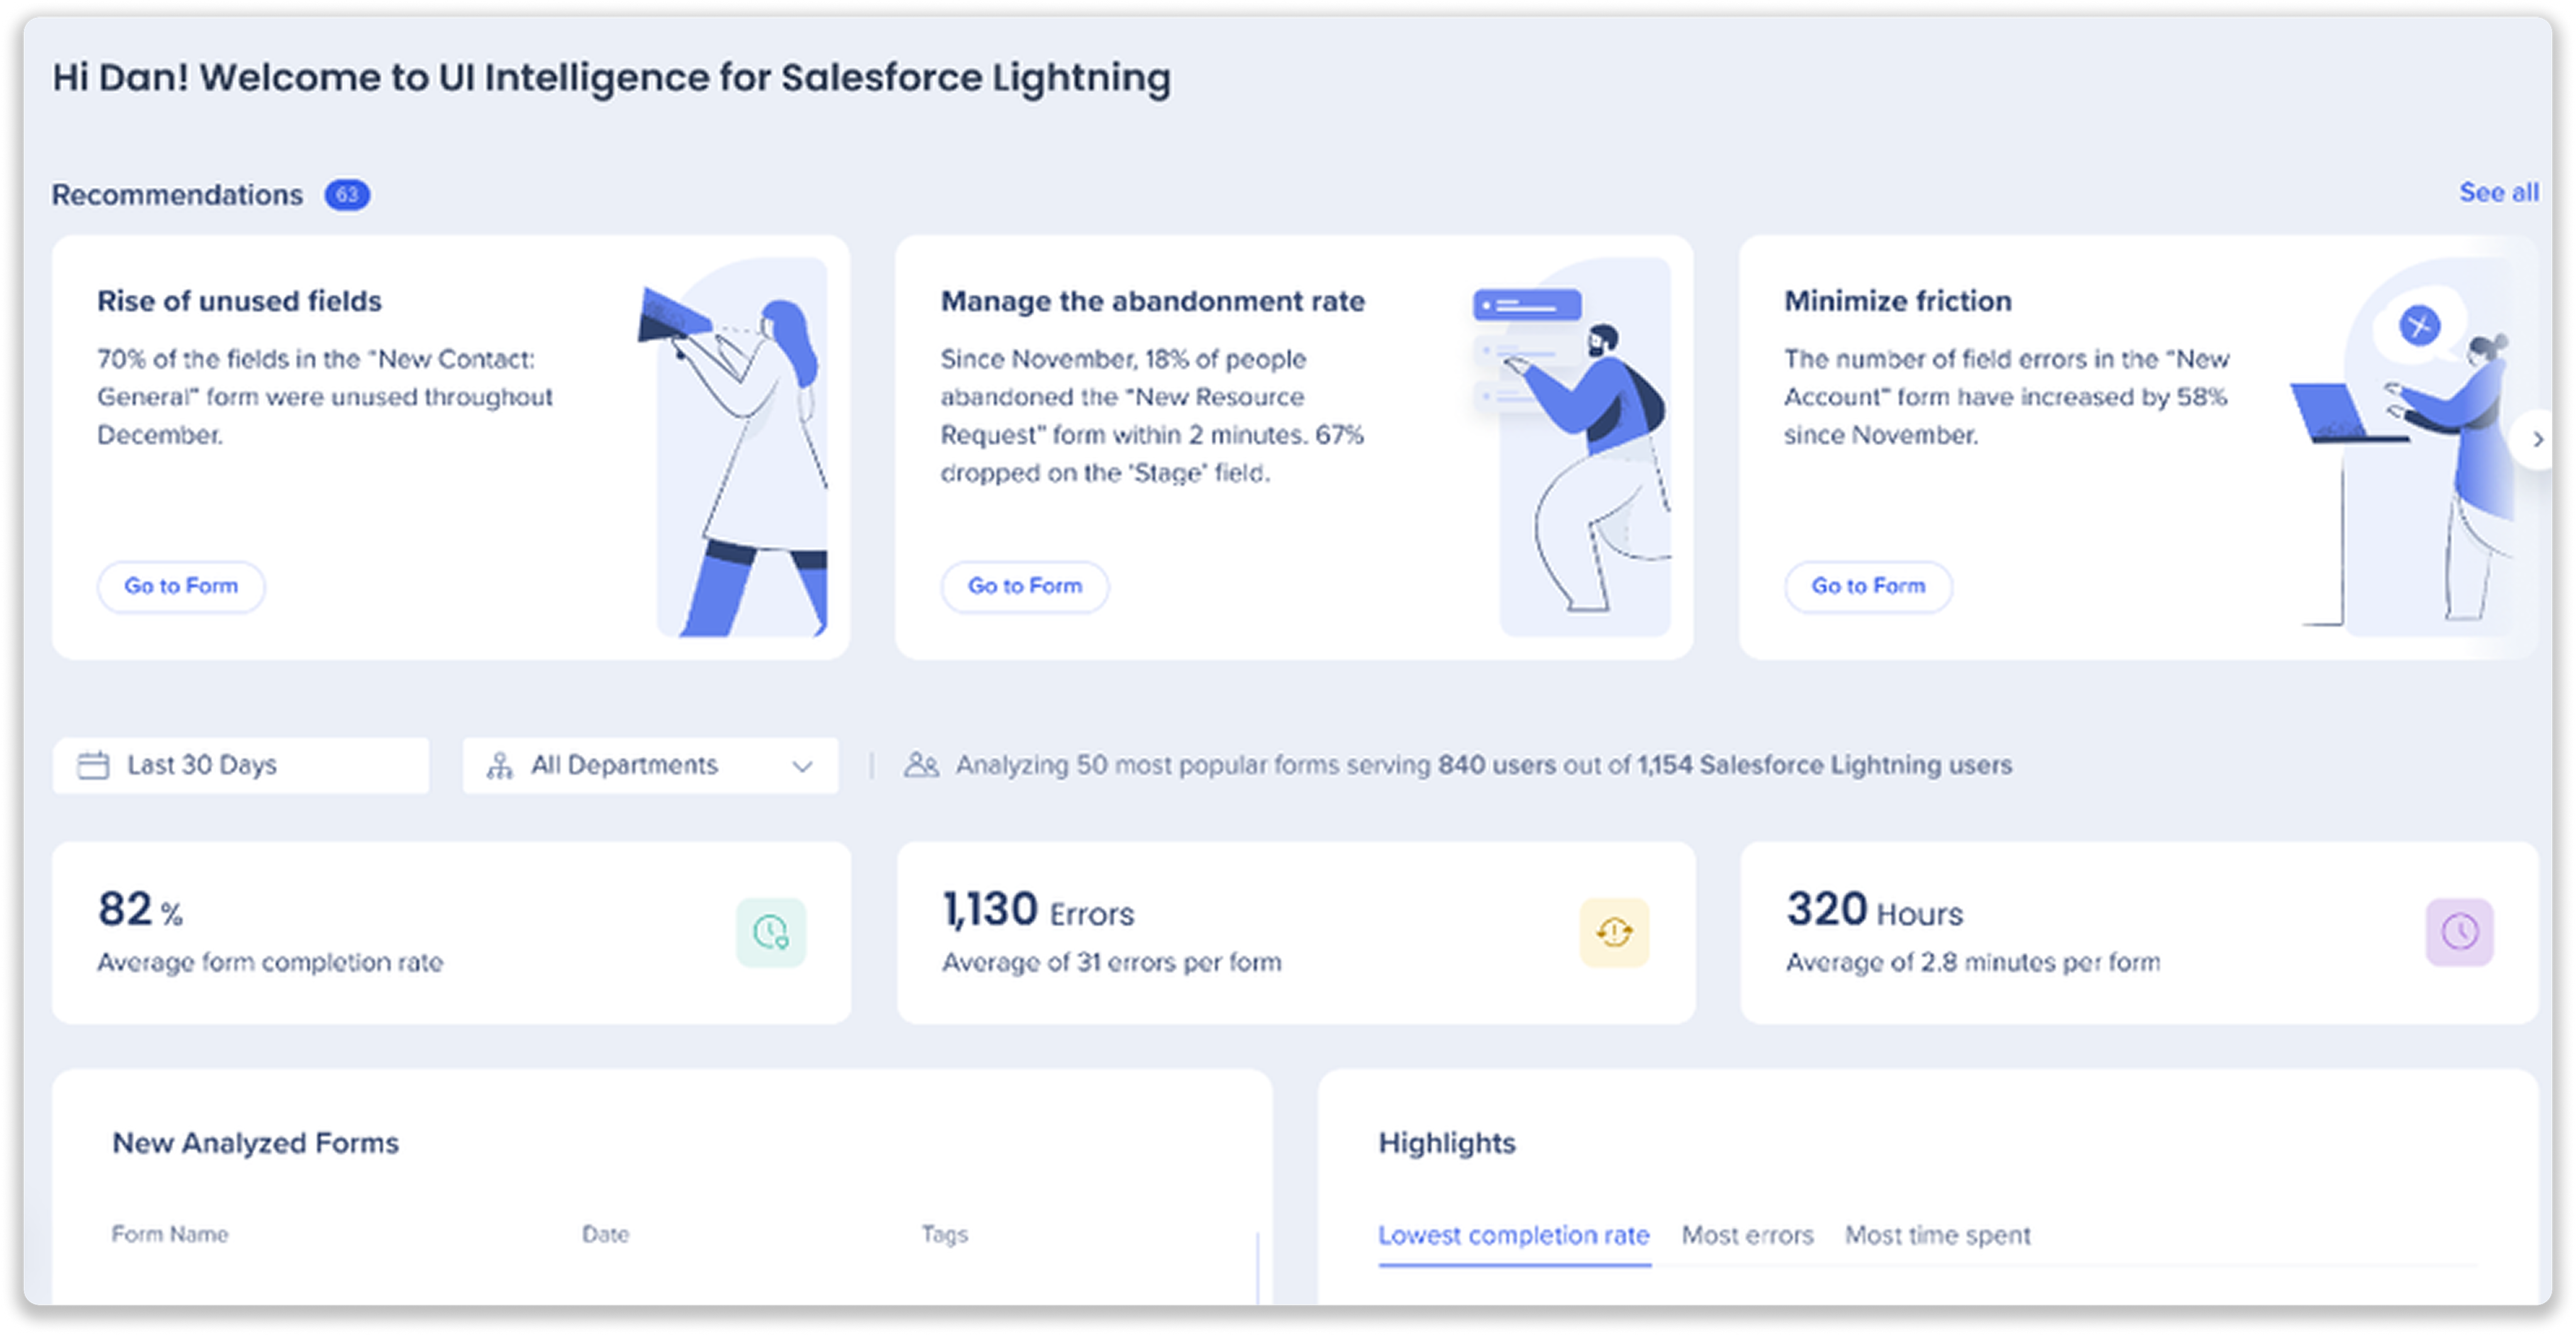
UII offers a comprehensive overview dashboard that allows you to filter data by time range and department, provides high-level metrics, gives actionable recommendations that will help improve your form's usability and submission rates. UII helps businesses understand the impact of their forms and the changes that are made so they can make data-driven decisions to improve the overall user experience.
World-Class Machine Learning
WalkMe's innovative user behavior analysis is based on world-class machine learning algorithms, allowing you to quickly identify the areas in your digital experiences that have the most friction, errors, and wasted time. Harness the power of WalkMe's artificial intelligence to reach maximum productivity, reduce user frustration, identify automation opportunities, and increase data integrity.
Our AI-based solution requires zero configuration and is completely autonomous. Once enabled, it automatically maps out your platform and identifies common forms where user activity usually takes place. Gain visibility to those forms from within our product, while effortlessly analyzing the way users are using the platform.
Build the right things by asking data-driven questions, uncovering real user pains, and continuously measuring and maximizing the impact of your solutions.
Download the UII brochure for even more information.
Use Cases
- Understand how employees are actually engaging with forms- time spent, errors met, field usage
- Get automated insights on form engagement to assist with prioritization and discovery
- Uncover dead fields and blockers to better target WalkMe content
- Drive higher completion rates, data accuracy and productivity
- Reduce user frustration by providing WalkMe where it really matters
How It Works
Overview Dashboard
The Overview Dashboard provides a comprehensive summary of user interactions with forms. It features charts and data derived from UII analytics, offering insights into areas where users may encounter difficulties.
The page includes a Recommendations section, which suggests actionable tasks to enhance form submission rates. This section is updated monthly, providing new recommendations based on the previous month's data trends. Users can utilize these insights to streamline workflows and improve form usability.
Forms Page
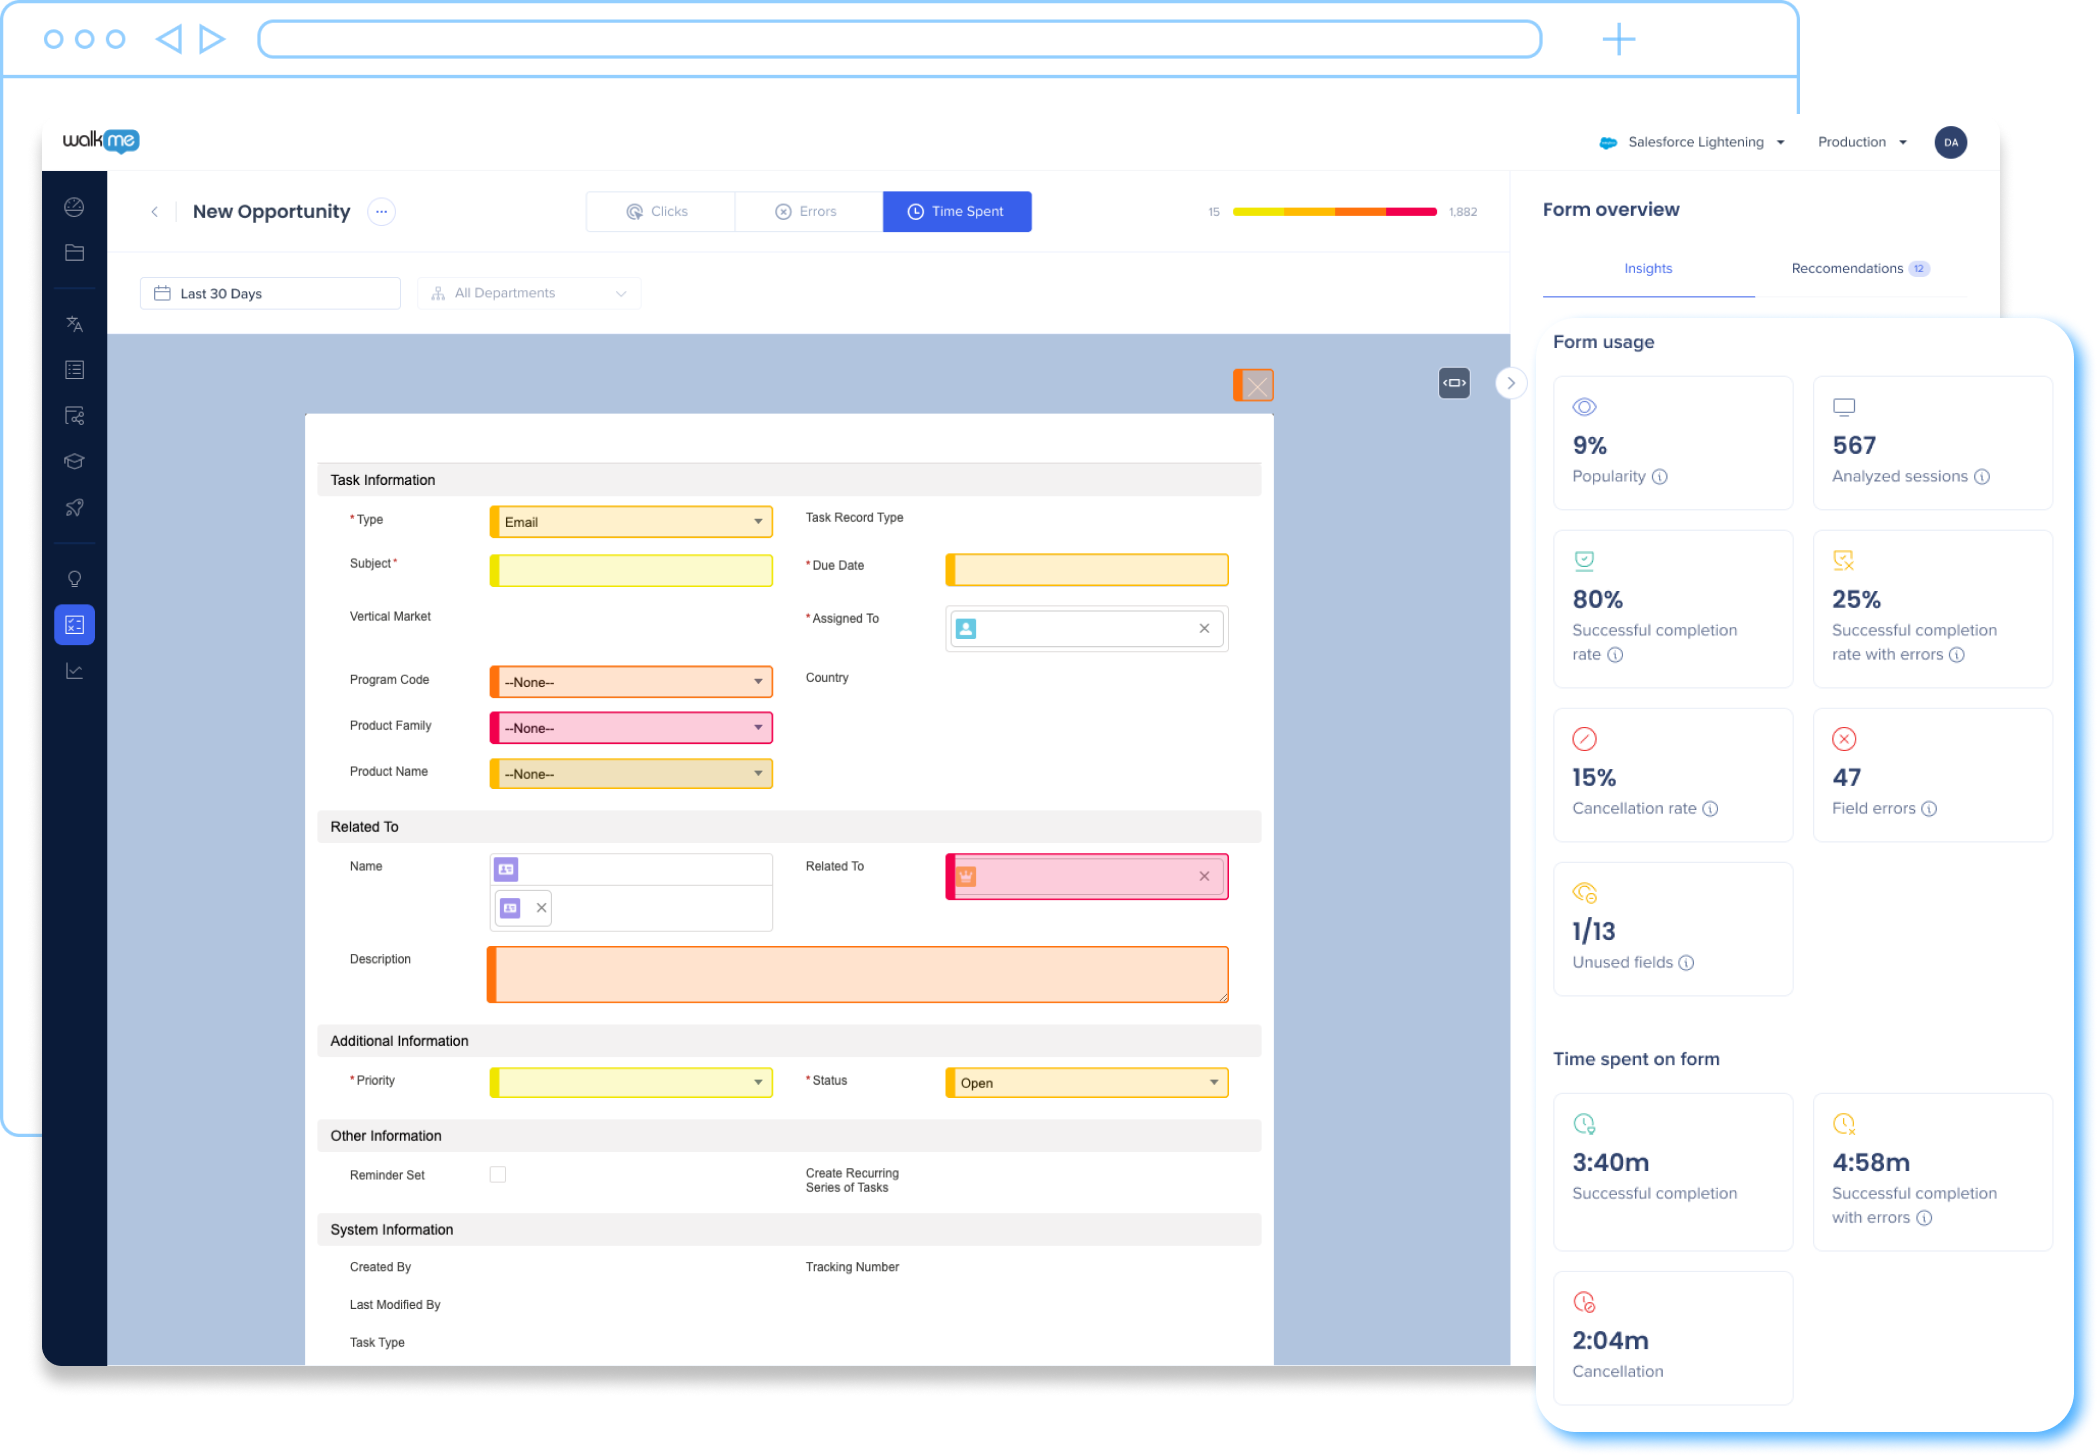
The Forms page provides an in-depth analysis of a form's performance, showcasing user interactions with visual heat maps. These maps display clicks, errors, and time spent using color gradients to show interaction intensity. This helps pinpoint fields with high error rates or long completion times, facilitating targeted improvements. The page also offers metrics on form popularity, completion rates, and errors, helping users enhance form design and functionality.
UI Intelligence: Getting Started Guide
Access
Access UI Intelligence in the console:
- Open the WalkMe Console
- Select the Analytics category
- Select UI Intelligence
Getting Started
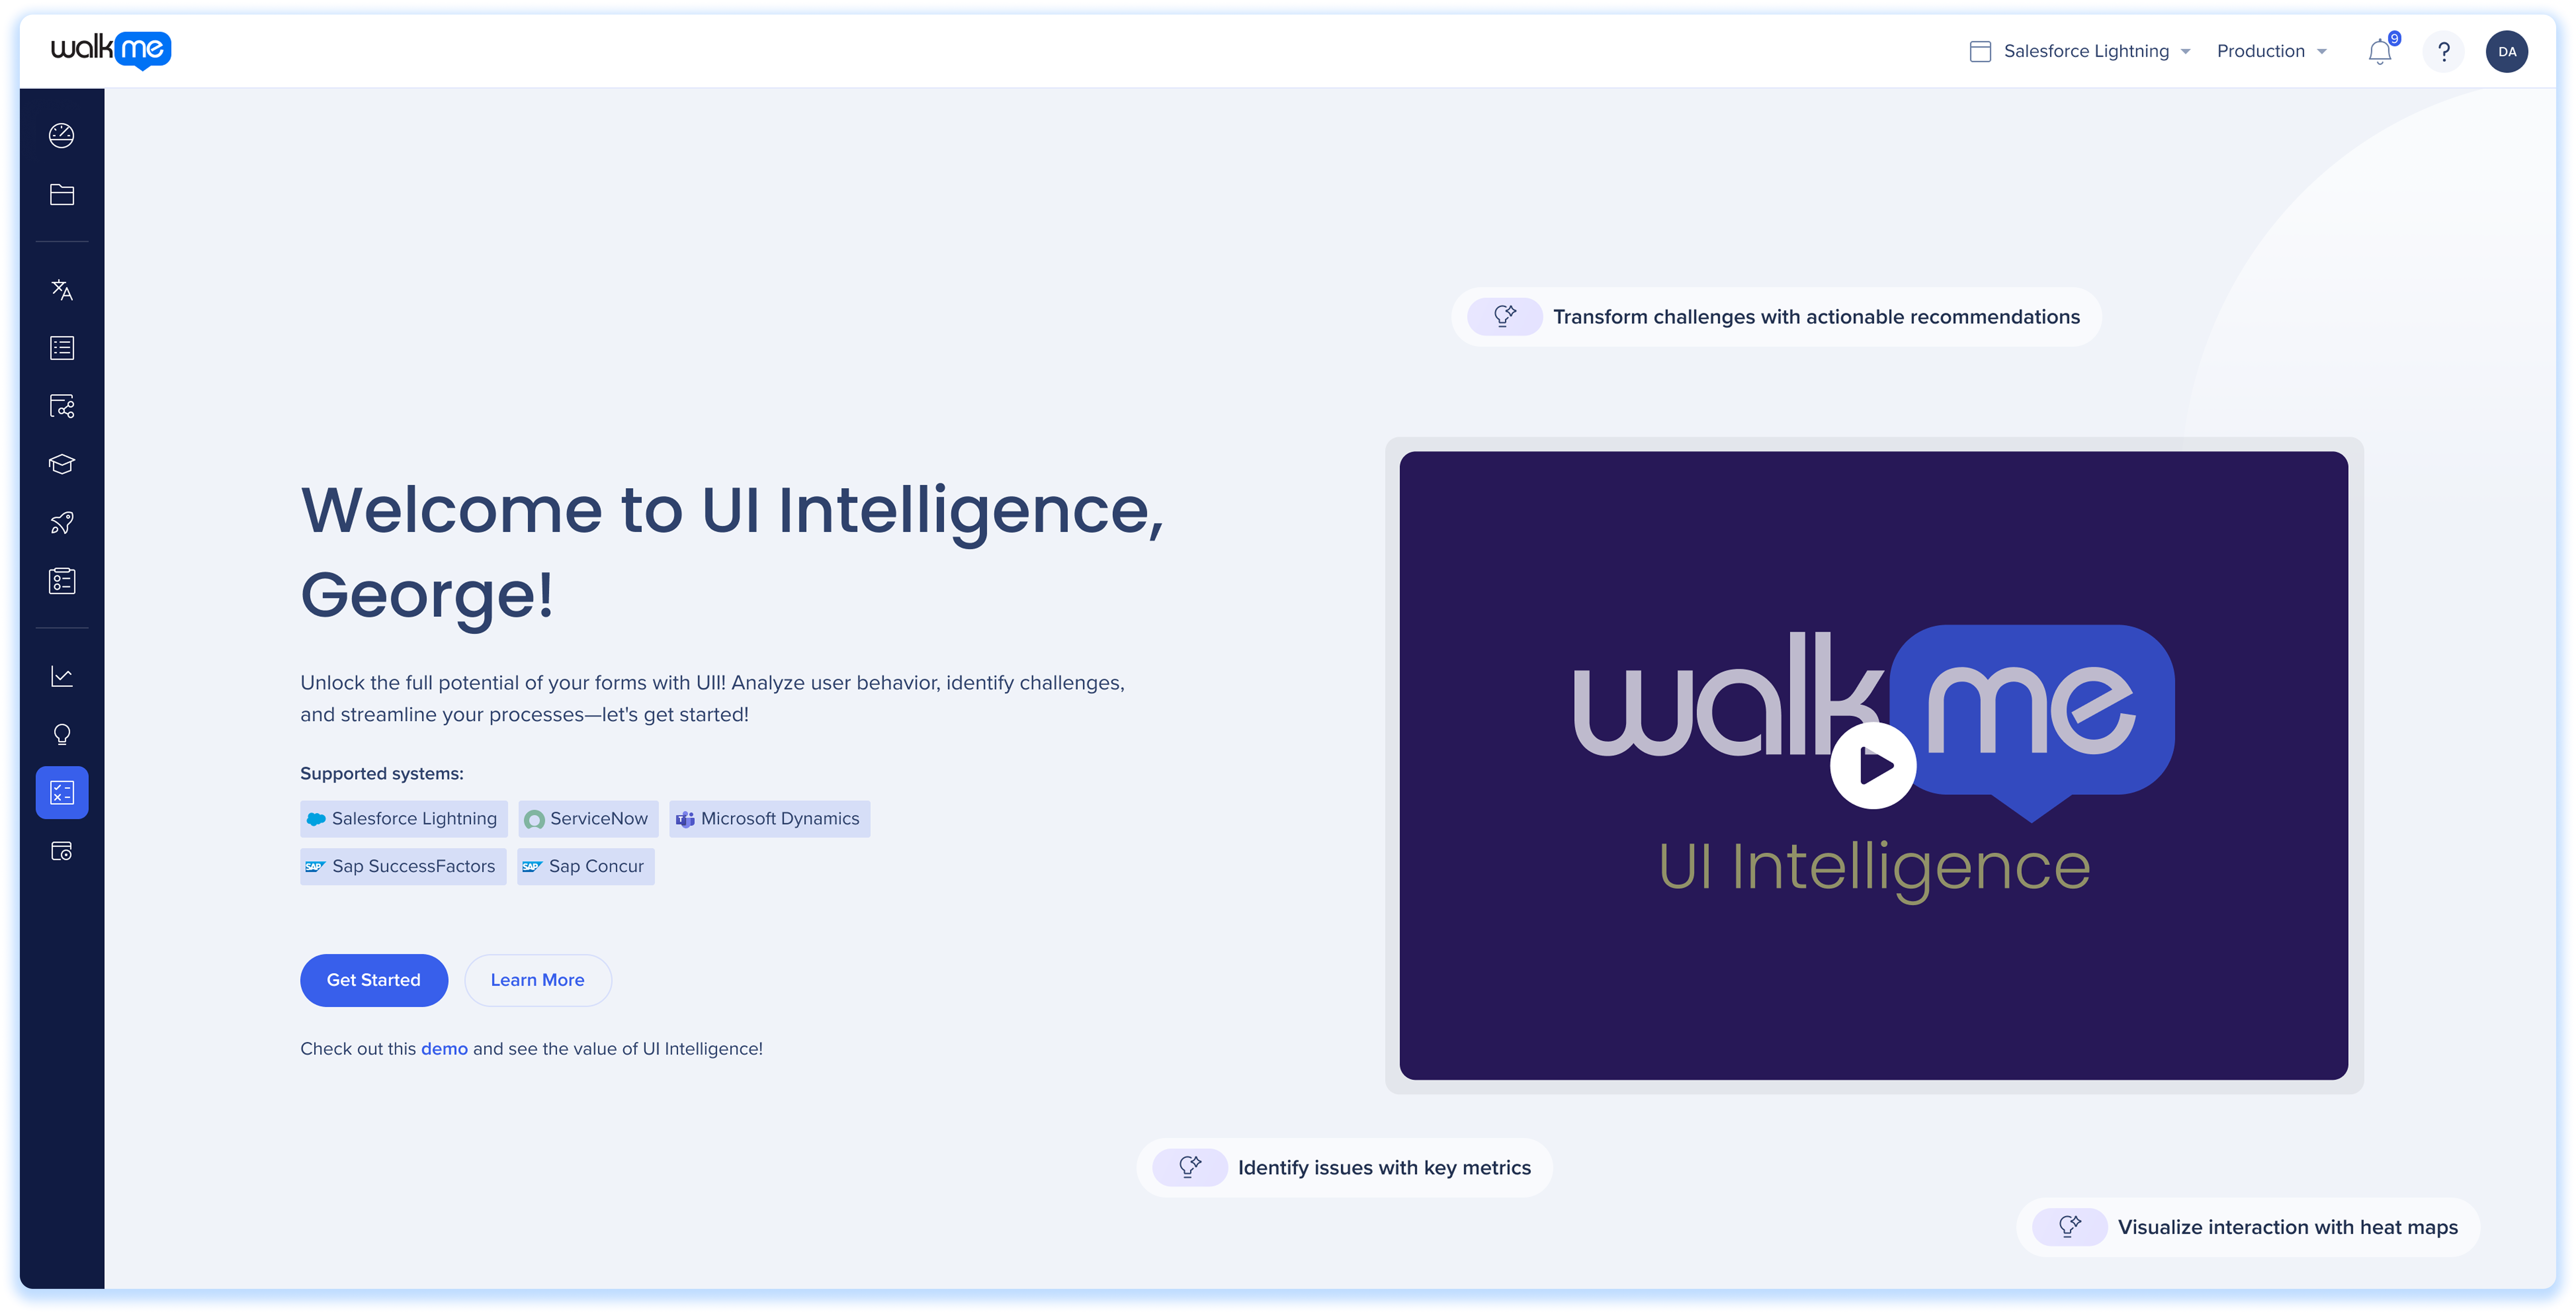
Step 1: Select a supported system
To get started, select a supported system to examine with UII.
UII currently supports the following systems:
-
Salesforce Lightning
-
ServiceNow
-
Microsoft Dynamics
-
SAP SuccessFactors
-
SAP Concur
Note
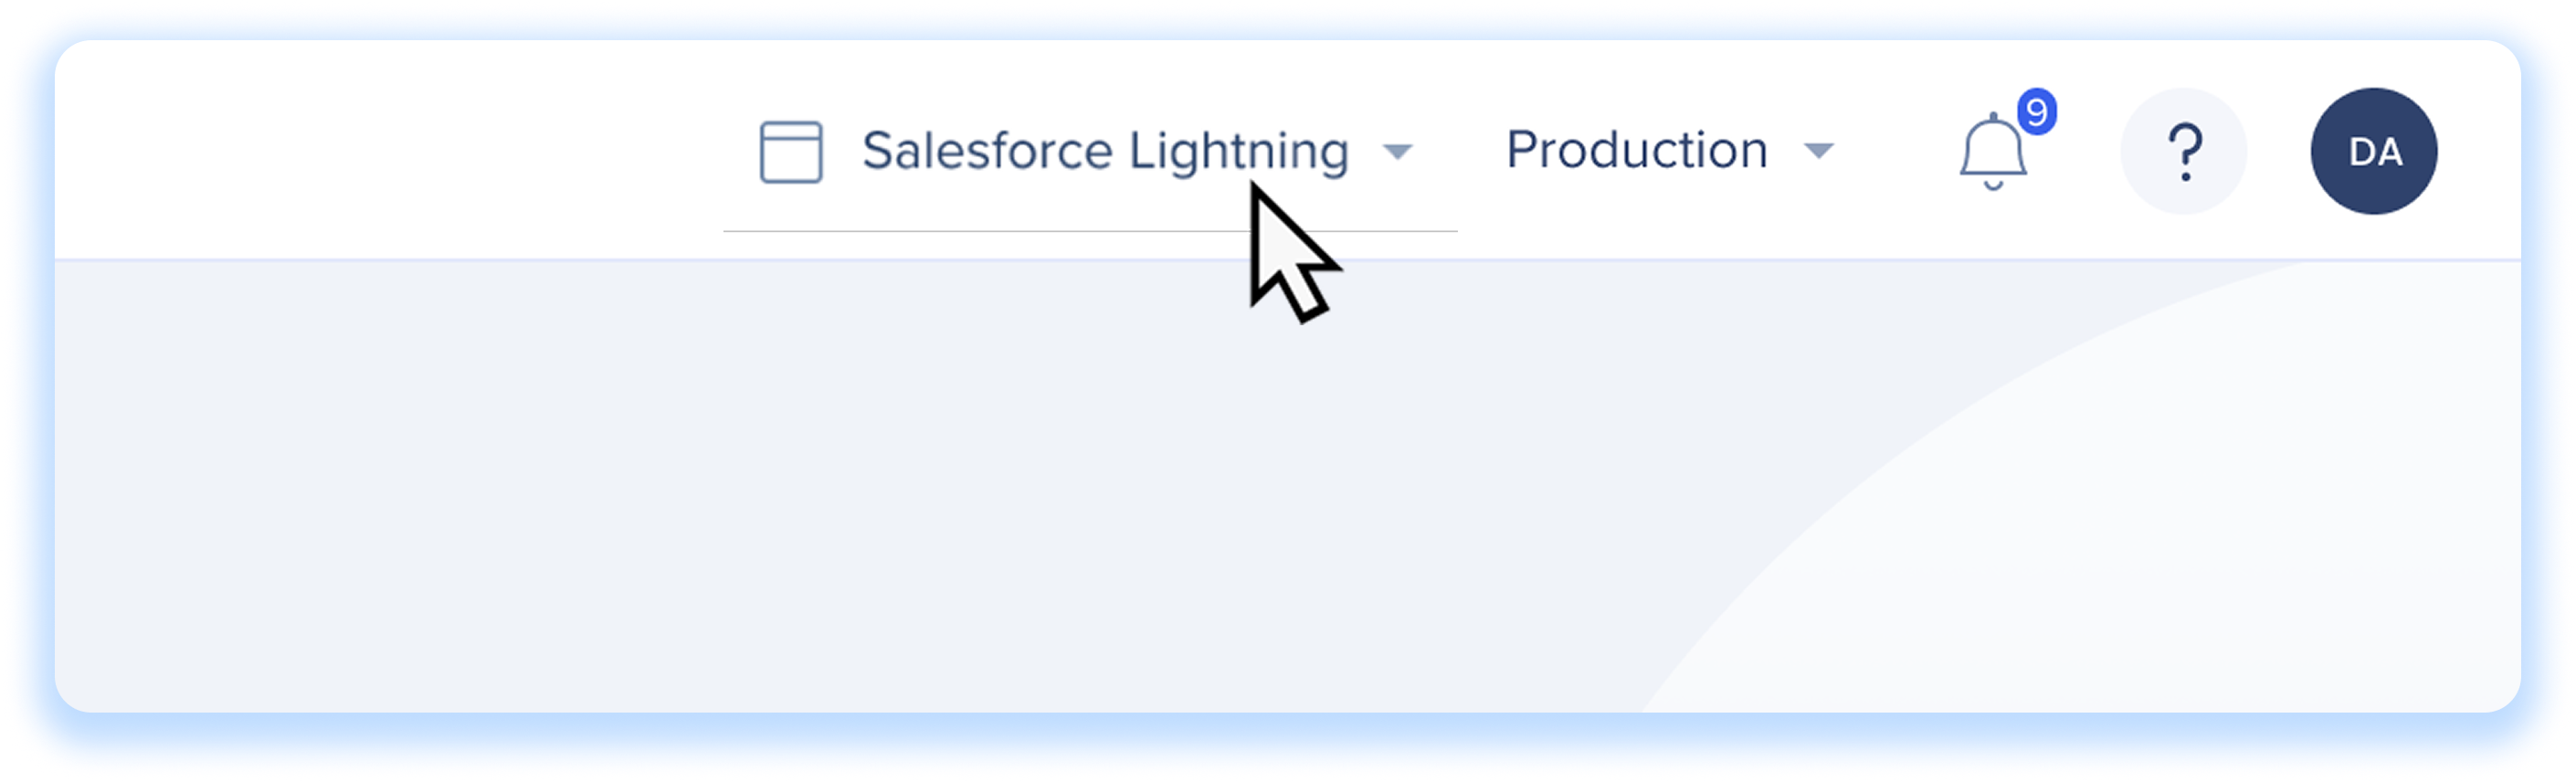
If you have more than one supported system or environment under your WalkMe account, make sure to select the one you wish to examine from the dropdowns in the top right corner.
Step 2: Start data collection
-
Click Get Started to open data collection confirmation
-
Click Start to initiate data collection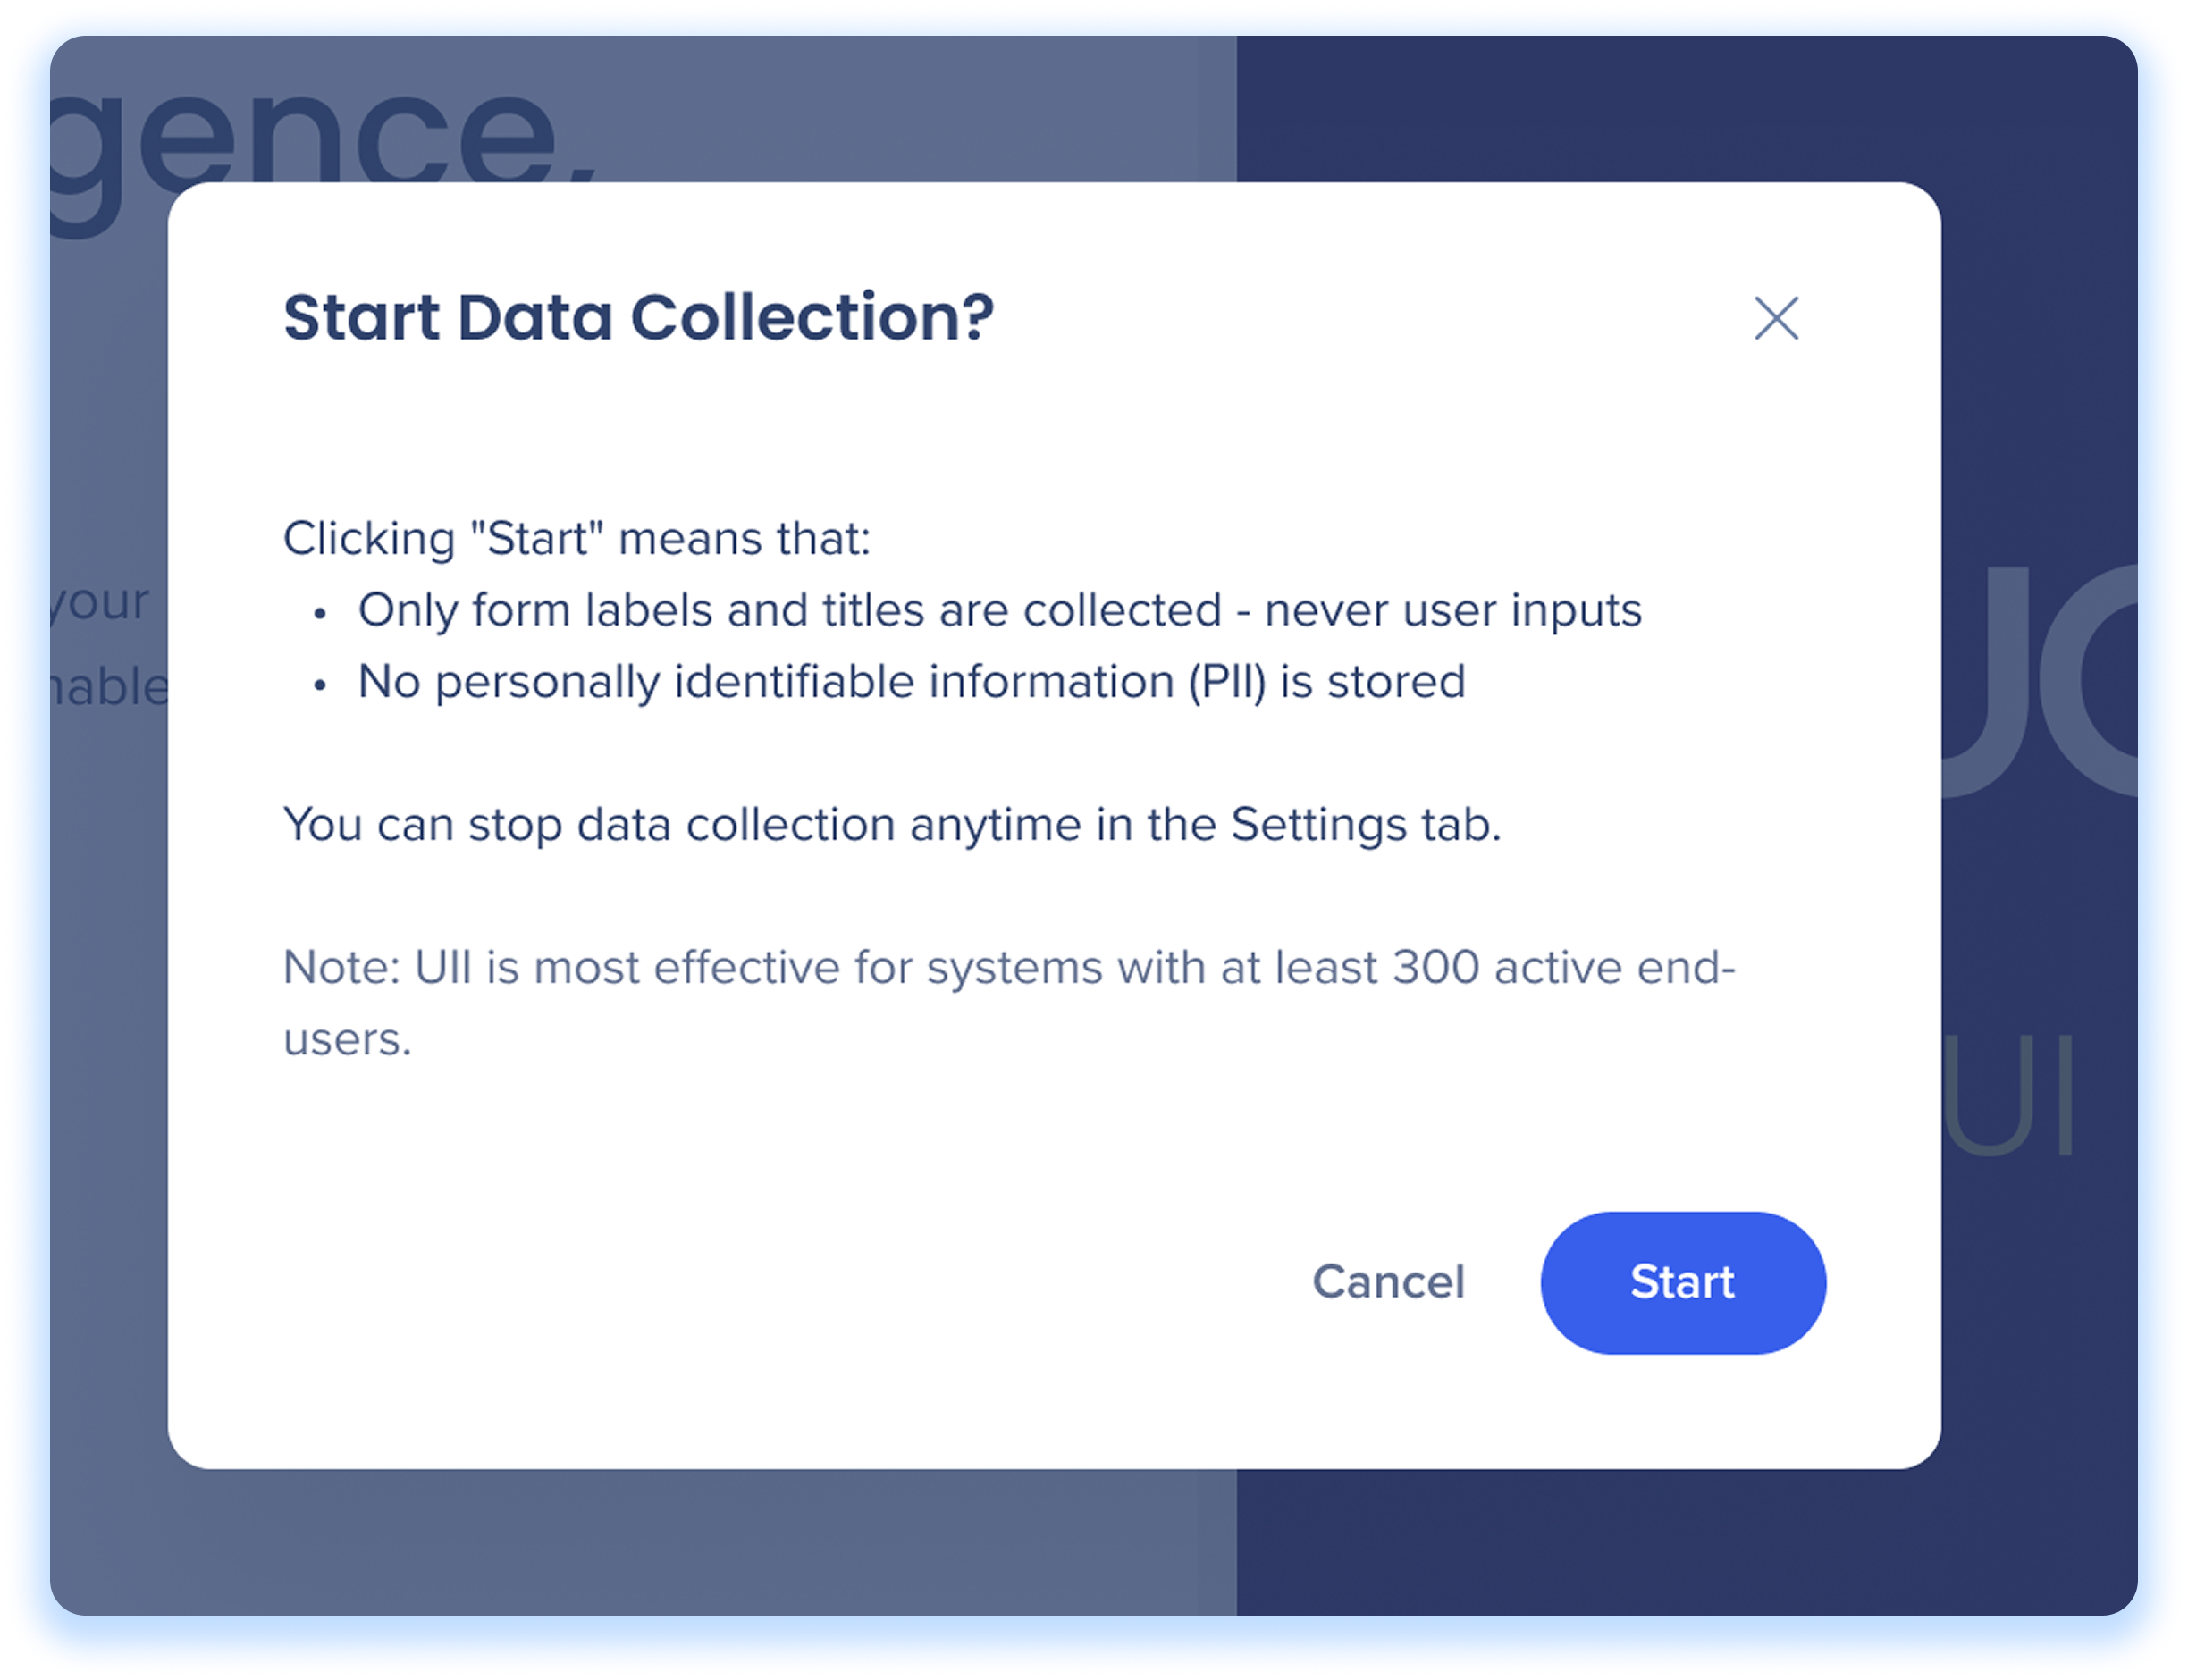
What is data collection?
Data collection is the process by which UII gathers live metrics on user interactions with forms, such as completion rate, error count, and time spent on forms. The data is collected to provide insights into user behavior, identify trends and friction points, and improve form usability.
Data privacy
UII is designed with privacy in mind:
-
No personally identifiable information (PII) is ever collected
-
Only metadata (like field names and titles) is gathered
-
Everything is handled securely and transparently
Step 3: Data Collection in Progress
After you click Start, data collection will begin. It may take up to 14 days to start seeing full insights — hang tight!
Once data collection is finished, you can use the UII application to observe user interactions with your forms and get actionable recommendations based on the insights.
Discover the features of the UII application here:
UI Intelligence: Getting Started Guide
Explore the demo
While data is being collected, you can check out a guided demo to see how UII will eventually work in your environment — full of real metrics, heat maps, and improvement suggestions
Technical Notes
- UI Intelligence is currently available for: Salesforce Lightning; ServiceNow; Microsoft Dynamics; SAP SuccessFactors; SAP Concur
- Data may take a few days or more to show up, depending on user activity and other factors
- The feature can be enabled/disabled through the settings section at any time
- We don't collect or store any PII, only aggregations of anonymized usage data
-
The dashboard shows data for up to the last four months. This limitation keeps the data both relevant and quick to load
-
Data collection begins from the date you first start using UII
-
Example: If you started using UII on January 1, 2025, and today is August 18, 2025, you will only see data from the past four months (April–August 2025)
-
Customers with less than 300 active users, may not generate enough traffic to get value from UII
- Mobile web not supported