
Insights Overview Page

Brief Overview
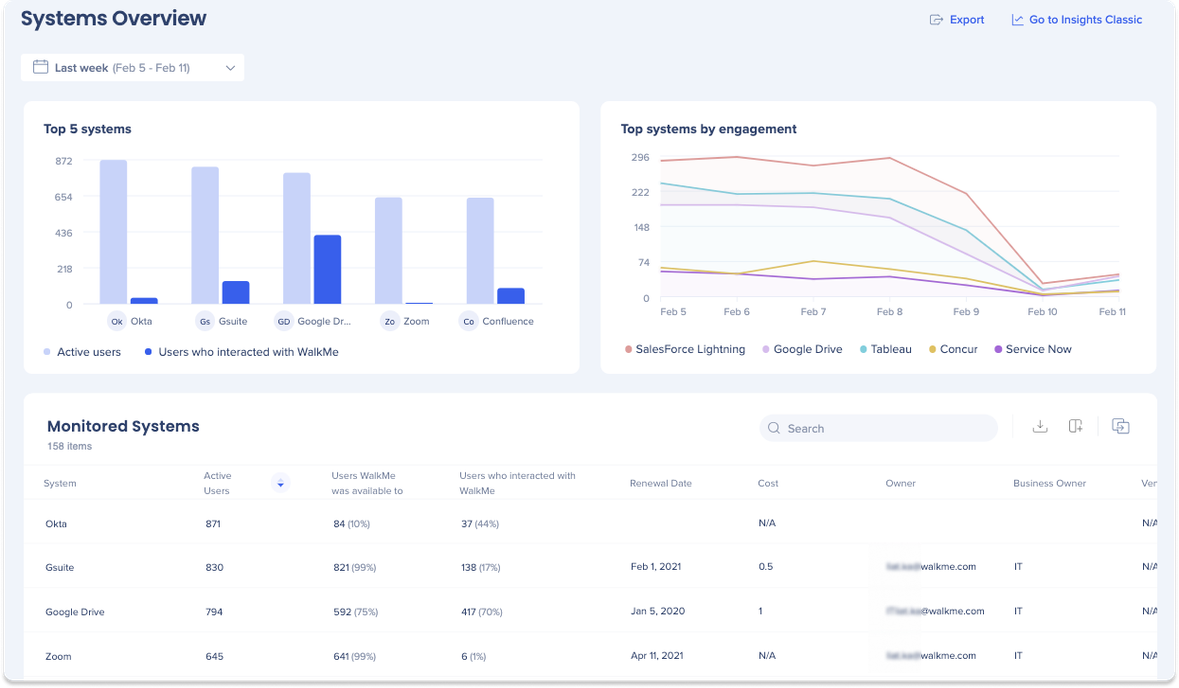
With WalkMe's Systems Overview, you can make data-driven, strategic decisions based with visibility into software usage across your organization.
The Systems Overview page serves as the primary Insights dashboard and default homepage for all accounts.
Here, you can conveniently track the activity of your most frequently used systems and those with the highest WalkMe engagement. Additionally, you have the option to select which system you would like to view insights for independently from the Monitored Systems table.
Use Cases
-
Measure usage and optimize your WalkMe solution
-
Measure usage and optimize your underlying website
-
Analyze your end-users behavior
-
Recognize instances of end-user confusion and capitalize on these opportunities to improve
How to Access
The new Insights is located in the WalkMe Console. The Systems Overview page serves as the primary Insights dashboard and default homepage for all accounts. To access the page:
- Hover over the navigation sidebar in the console
- Click Insights (NEW)
- Click Systems Overview
Get to Know & Use
Widgets
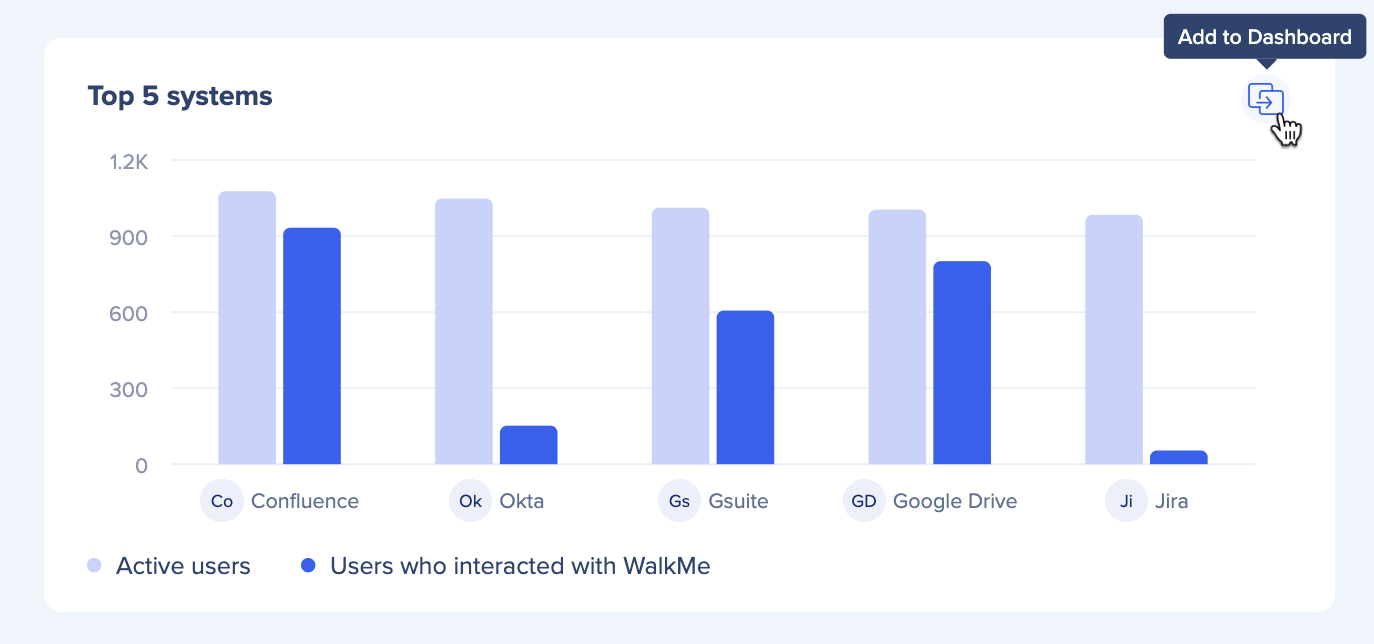
Top 5 systems
Top 5 systems is a chart that displays the top 5 systems with the highest number of active users and their interactions with WalkMe.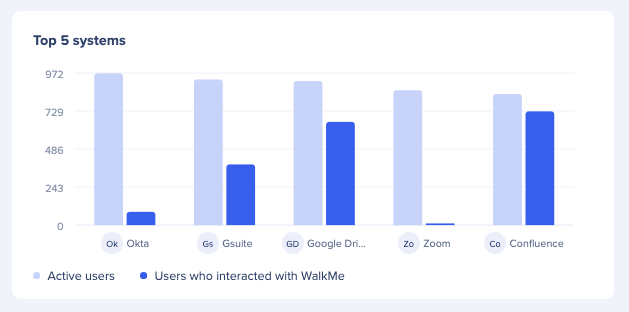
Top systems by engagement
Top systems by engagement is a chart that displays the top 5 systems with the most unique users engaging with WalkMe content over a selected period of time. The data can be displayed in hourly, daily, weekly or monthly increments.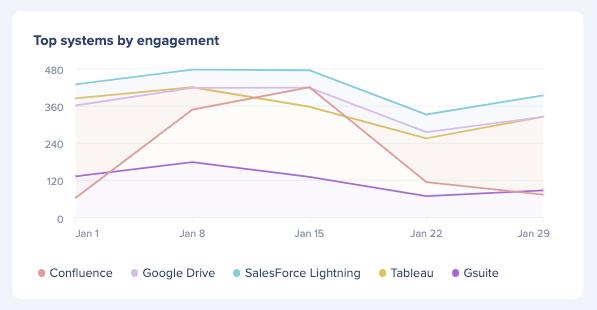
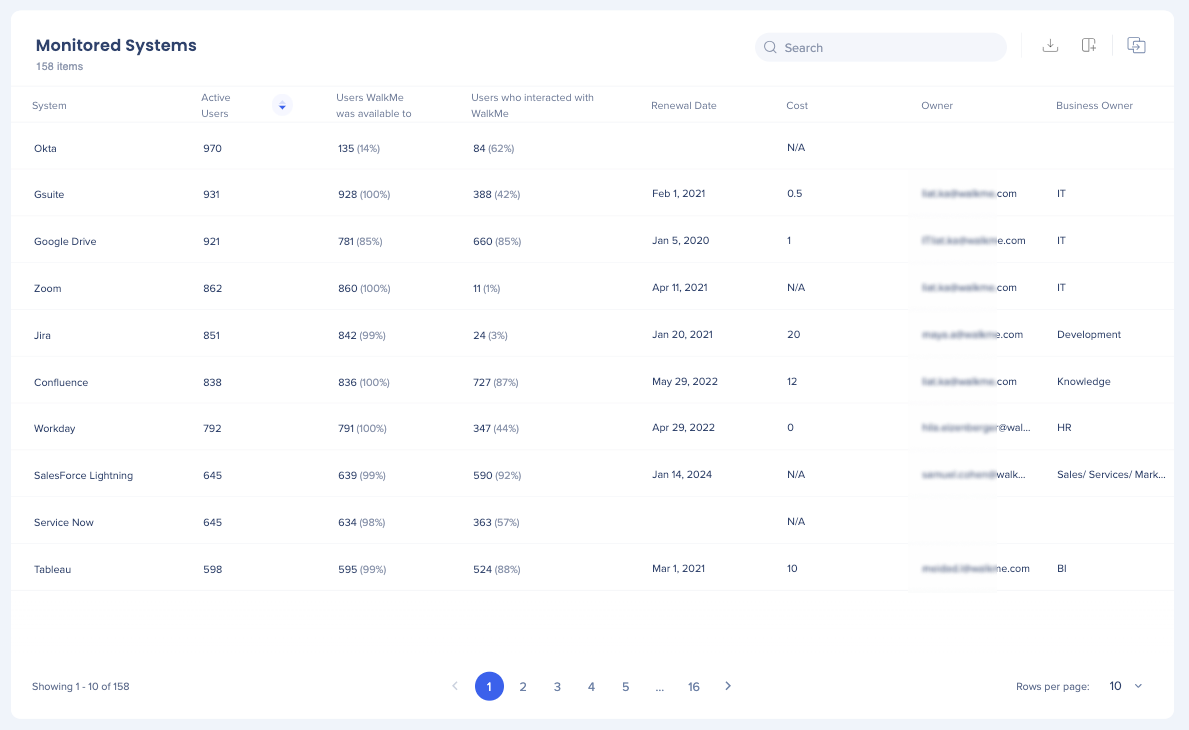
Monitored Systems
Monitored Systems displays different systems being monitored in the WalkMe account, with columns for the following metrics show below. It also shows any custom columns added in Insights.
-
Active Users: Users who visited the website or application in the selected date range
-
Users WalkMe was available to: The percentage of users who had any WalkMe content visible (including Menu, Launcher, SmartTips, etc), out of the active users
-
Users who interacted with WalkMe: The percentage of users who interacted with a WalkMe item, out of the users who were exposed to WalkMe content
-
Note: This metric will not be populated for desktop apps since WalkMe content can't be created for them
-
Additional Capabilities
Filters
The dashboard filters enables users to view and analyze a smaller part of your data set.
Users have the following filter options:
-
Today: This filter shows data from the current day
-
Last week: This filter shows data from the previous day
-
Last month: This filter shows data for the previous month
-
Last three months: This filter shows data for the last three months
-
Month: This filter shows data from the selected month and year
-
Quarter: This filter shows data from the selected quarter and year
-
Custom: This filter allows you to select a custom date range to view data
Add to Dashboard
With the Add to Dashboard feature, you have the ability to personalize custom dashboards by adding various widgets.
How to use:
-
Hover over the widget you'd like to add to a custom dashboard
-
Click the Add to Dashboard icon
-
Select a custom dashboard from the Add to dropdown menu
-
Note: You can also create a new dashboard and add the widget to it
-
-
Click Add to Dashboard
Go to Insights Classic
Click the Go to Insights Classics button at the top right-hand corner of the page to be redirected to the old insights page: insights2.walkme.com
Work where you're comfortable, but we want to highlight that the new Console Insights will be continuously updated with the latest and most advanced capabilities.
![]()
Export
Click the Export button to download a png of the page. 
Technical Notes
-
Self hosting isn't supported in the Console
-
Setting a time zone isn't supported
-
Data is always filtered and displayed in UTC
-
Mobile Web isn't supported
-
Data is only displayed for production environment
- Each user will see only systems which they are allowed to access and view according to their user/role permissions