Brief Overview
The System Overview in the console provides a dashboard with visibility into the most commonly used software applications and user engagement within systems, leveraging the data from Discovery. It is made up of several widgets showing user analysis funnel, user analysis trends, where users access from, WalkMe interactions, top content, and top goals.
Customers can utilize it to identify areas where poor utilization of software exist so that they know exactly where to leverage WalkMe to improve adoption.
Access
-
Each user will only be able to see systems which they have permission to access according to their user/role permissions
-
The System Overview shows data based on the WalkMe system that is assigned to the app in Discovery
-
You can also access this dashboard from Discovery by clicking on the WalkMe system associated with the app you are viewing (you must have permissions for the WalkMe system)
Navigate to System Overview
- Go to the Systems Overview page in the console
- Select a system from the Monitored Systems widget
Get to Know & Use
The console System Overview is a dashboard within the WalkMe Insights console that provides customers with valuable insights and data on specific software applications. The dashboard is composed with the following features:
- System dropdown
- Environment dropdown
- Date picker
- Add Filters
- Apps tabs
- Metrics widgets
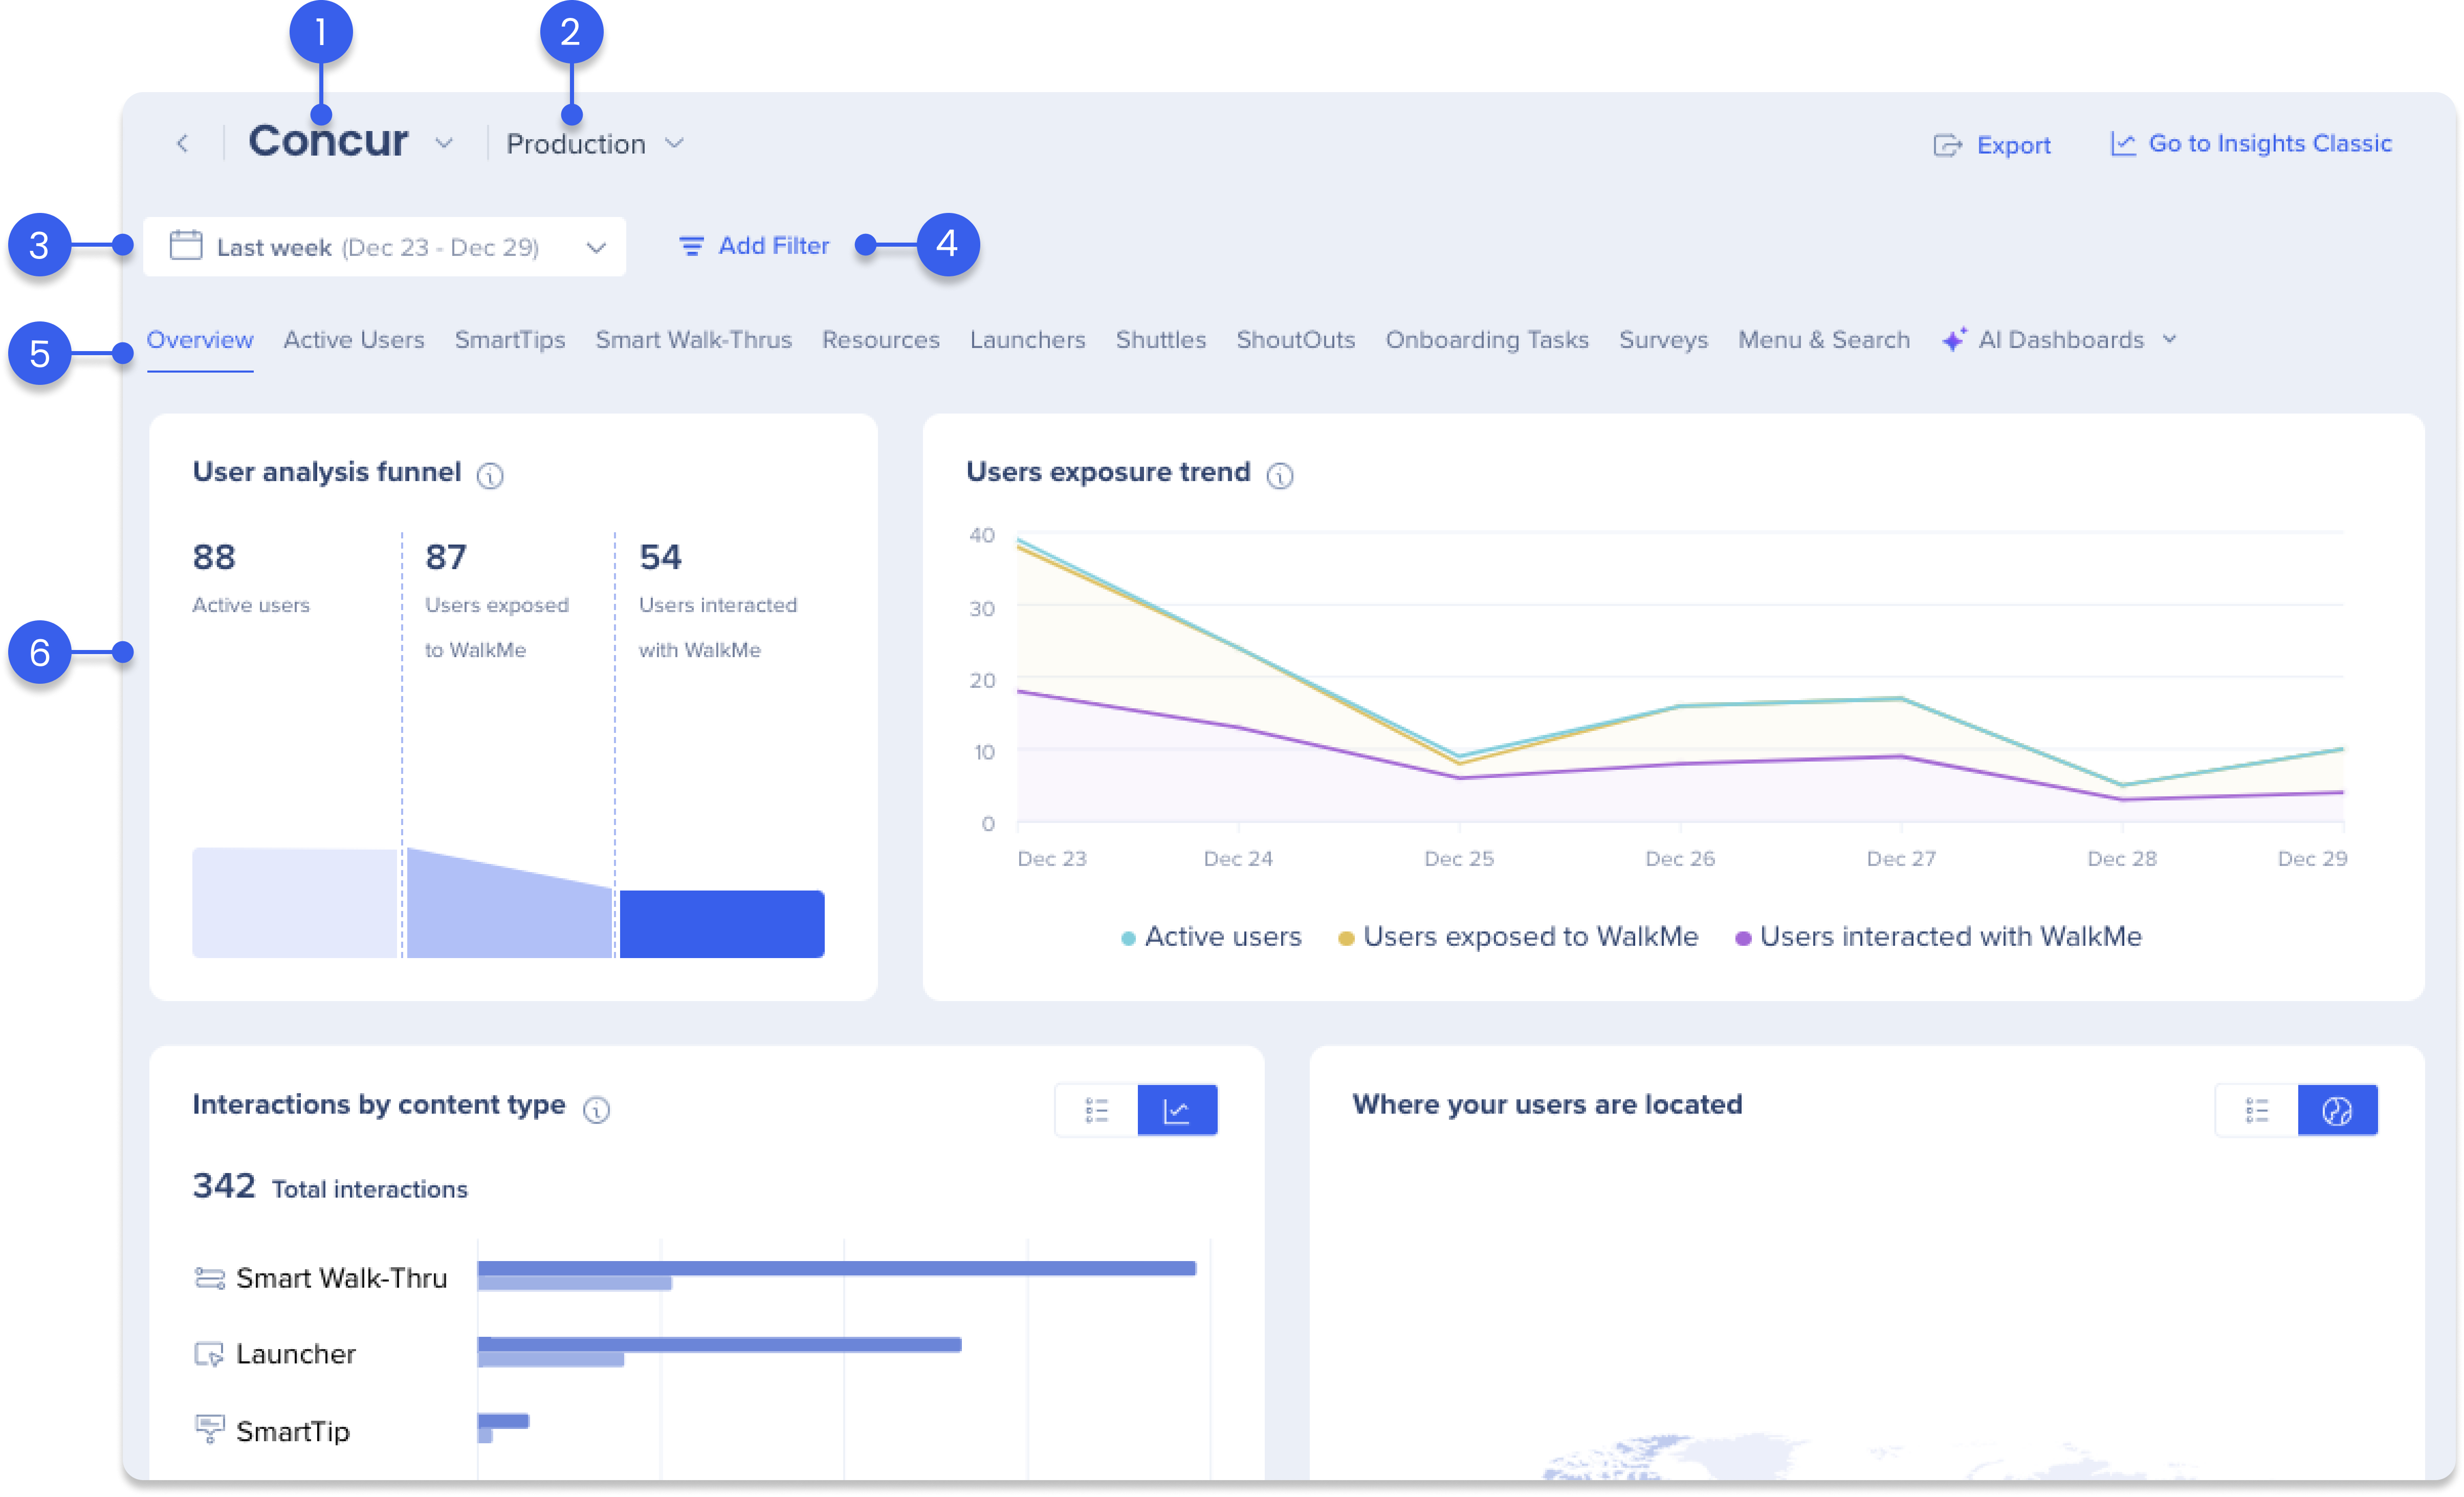
1. System dropdown
To quickly switch between your system dashboards, simply choose a different system from the dropdown menu.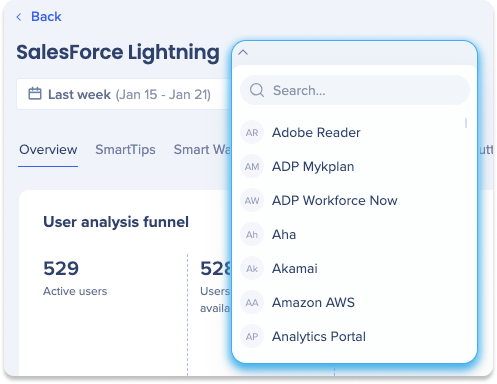
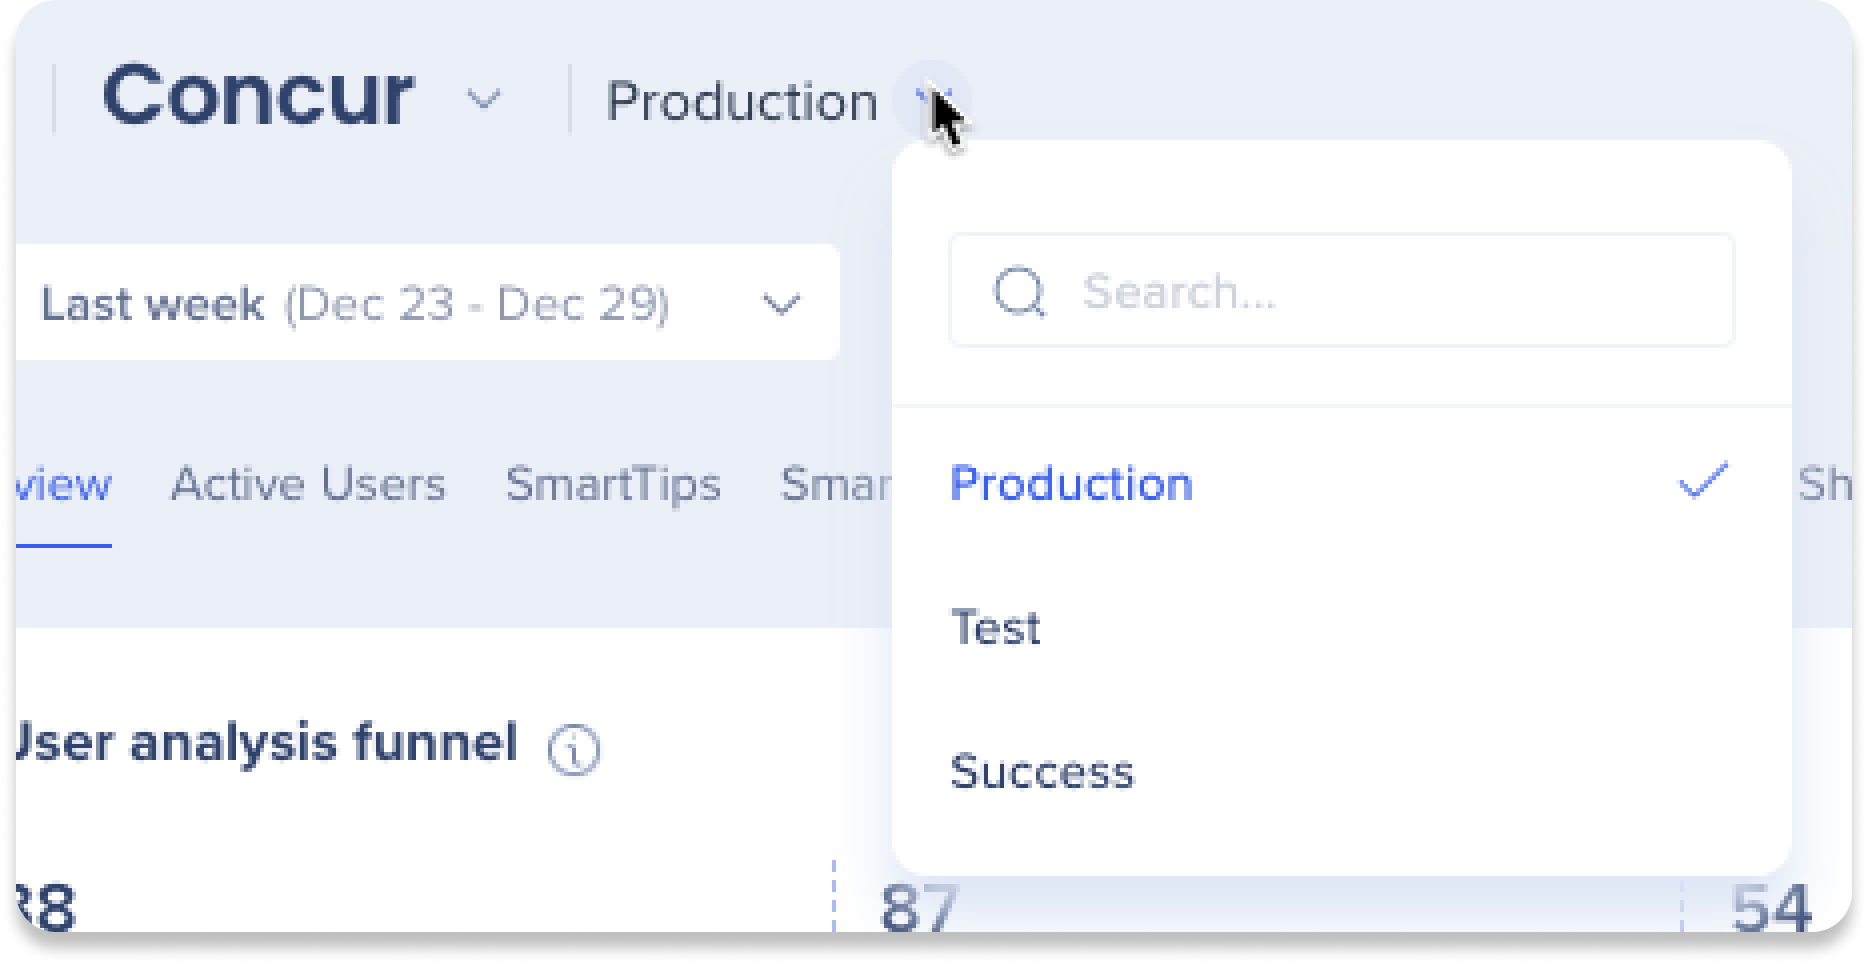
2. Environment dropdown
The environment dropdown enables you to filter and view data for a specific environment on the system dashboards, facilitating the analysis and management of each environment individually.
-
Click the Environments dropdown
-
Select an environment:
-
Production
-
Test
-
Success
3. Date picker
The dashboard date picker enables users to view and analyze a smaller part of their data set. Users have the following filter options:
-
Today: This filter shows data from the current day
-
Last week: This filter shows data from the previous day
-
Last month: This filter shows data for the previous month
-
Last three months: This filter shows data for the last three months
-
Month: This filter shows data from the selected month and year
-
Quarter: This filter shows data from the selected quarter and year
-
Custom: This filter allows you to select a custom date range to view data
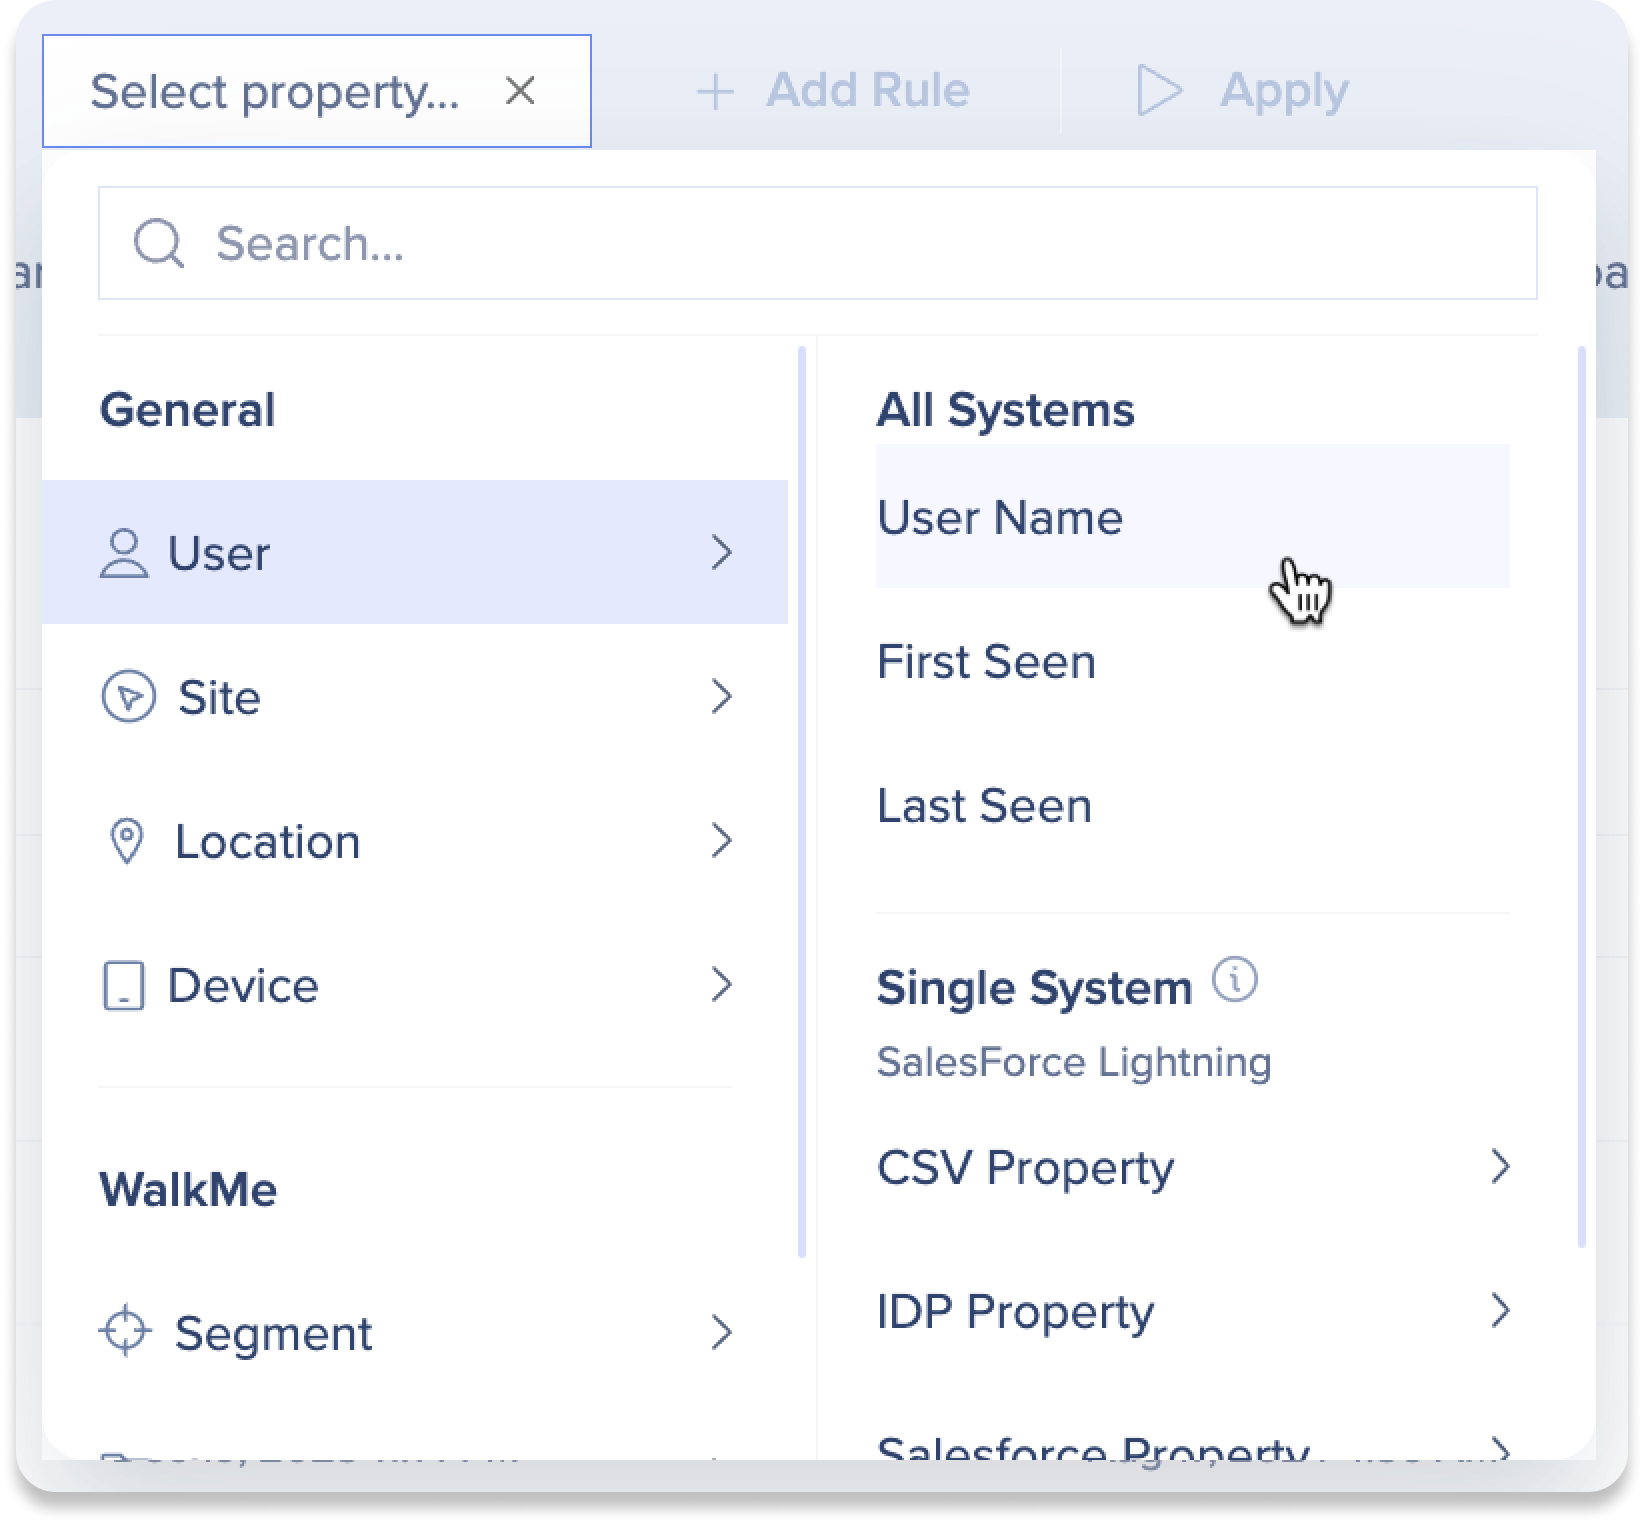
4. Filters
Click the Add Filters button to view and analyze a smaller part of your data set.
-
The dropdown contains any previously saved filters
-
All the user metrics displayed are reflective of the chosen filters
-
For example, when using a “Location” filter, a list of users only from the exact location chosen (country, state/region, or city) will appear
Data Filtering
5. App tabs
Select a WalkMe item from the apps tab bar to view metrics widgets that will go more in-depth on individual WalkMe items within the system.
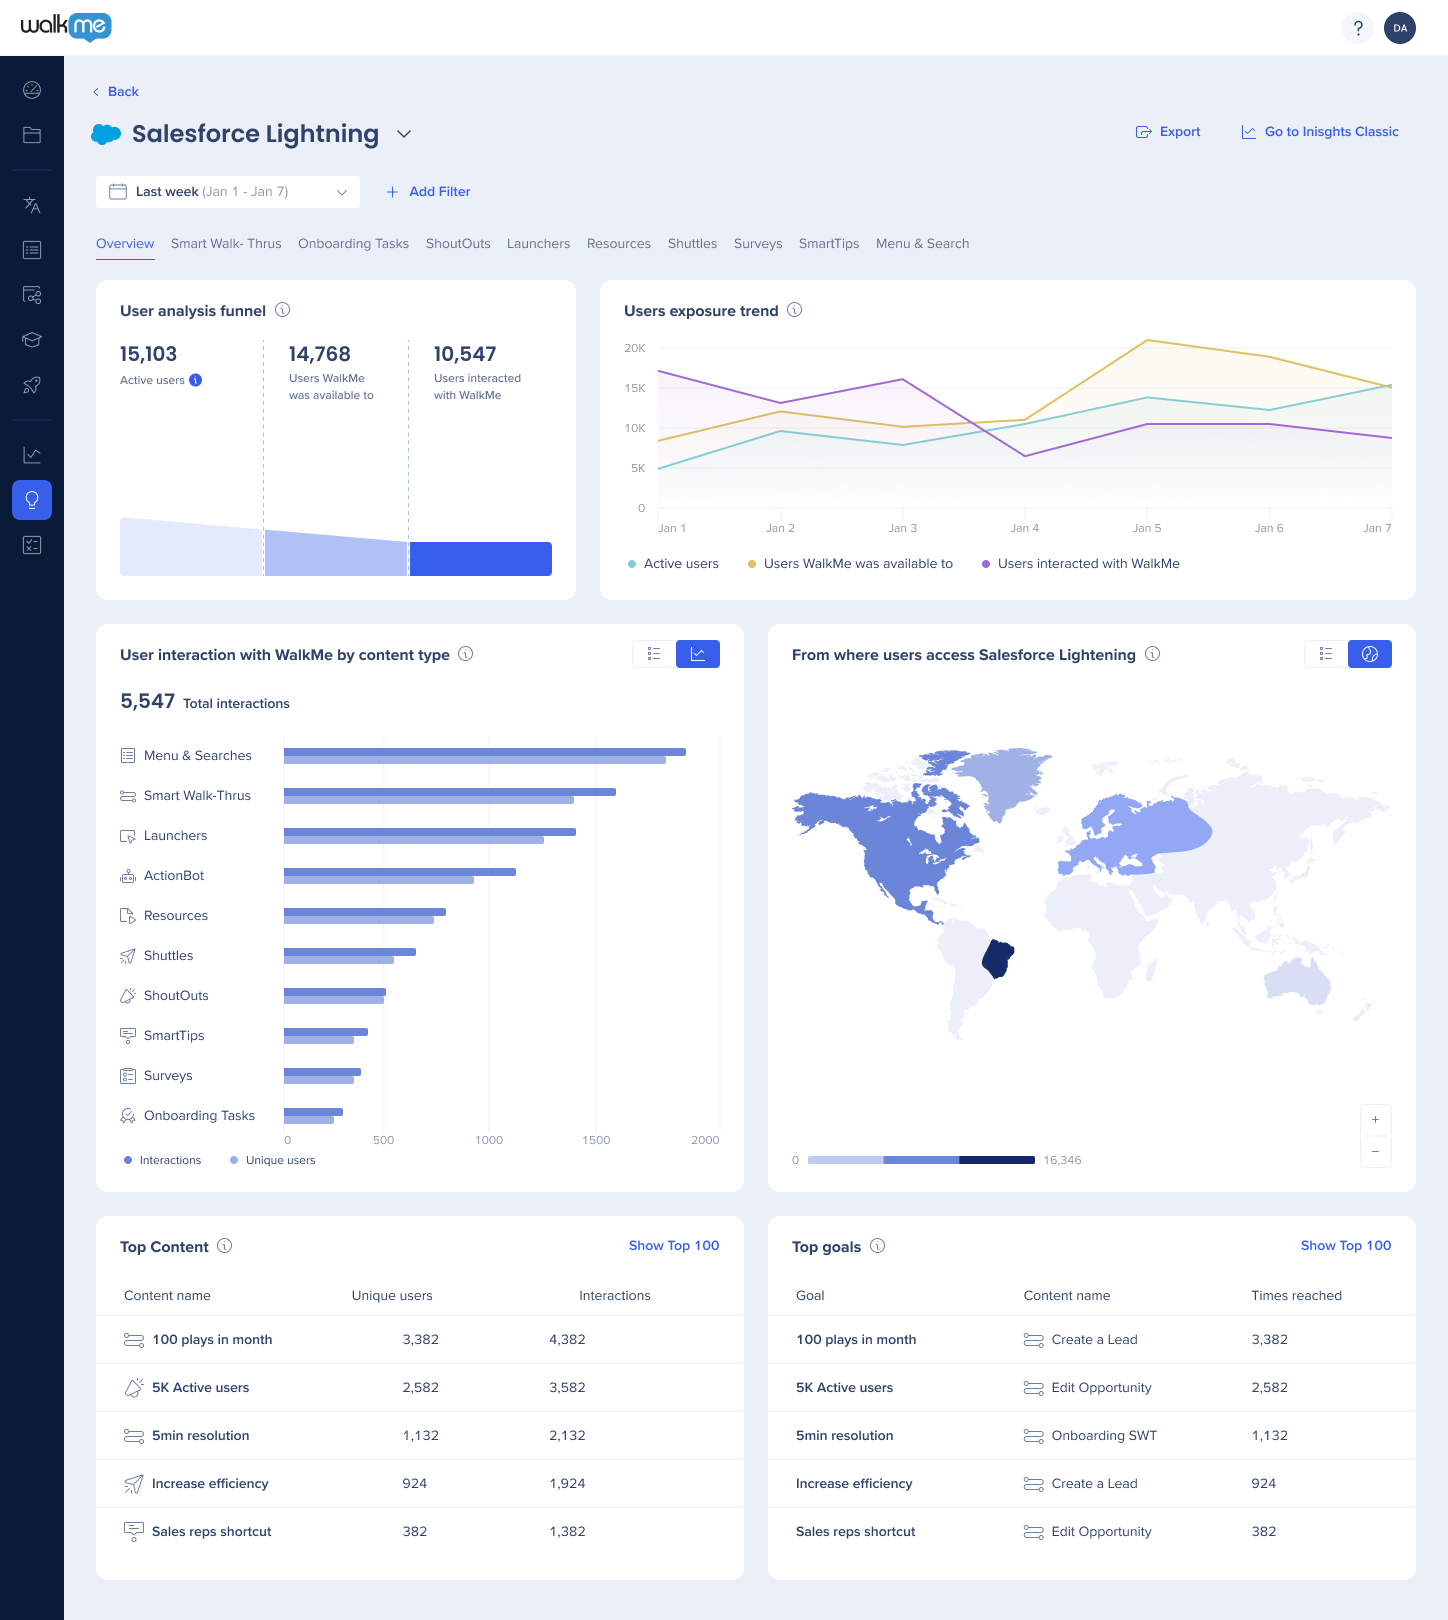
User analysis funnel
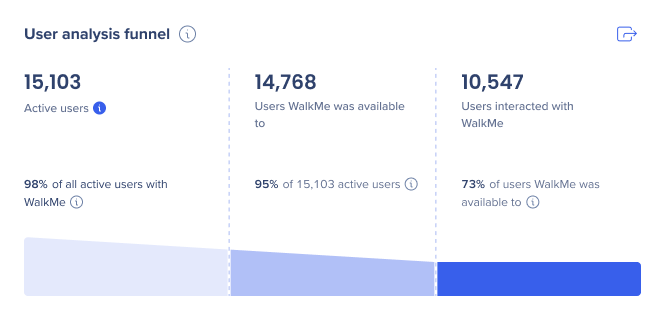
A visual funnel showing active users, users WalkMe was available to, and users who interacted with WalkMe.
-
Active users: The number of unique users who visited the site while WalkMe was loaded, regardless their interaction with a WalkMe item. Numbers shown may differ from Discovery, depending on how user calculation was defined on this system
-
Users WalkMe was available to:The number of unique users who had at least one WalkMe item visible or available to them (with any segmentation and rules applied)
-
Users interacted with WalkMe: The number of unique users who interacted with at least one WalkMe item
Hovering on the widget will show the percentage of every metric.
User analysis trends
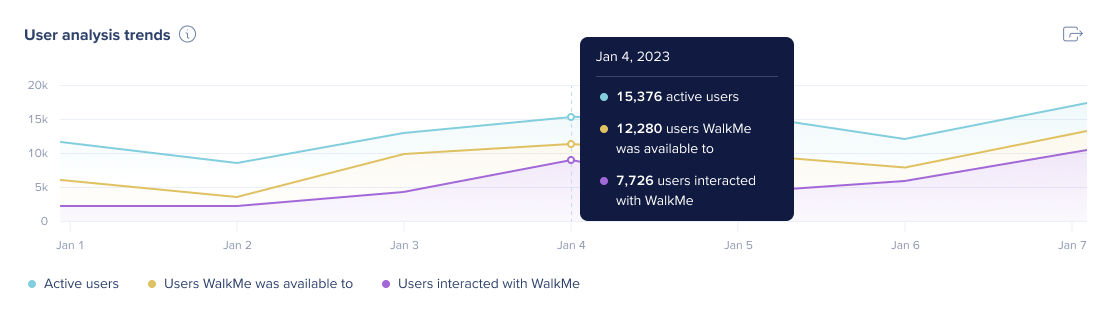
A visual line graph showing active users, users WalkMe was available to, and users who interacted with WalkMe.
-
Active users: The number of unique users who visited the site while WalkMe was loaded, regardless their interaction with a WalkMe item. Numbers shown may differ from Discovery, depending on how user calculation was defined on this system
-
Users WalkMe was available to: The number of unique users who had at least one WalkMe item visible or available to them (with any segmentation and rules applied)
-
Users interacted with WalkMe: The number of unique users who interacted with at least one WalkMe item
Hovering on the widget will show the percentage of every metric.
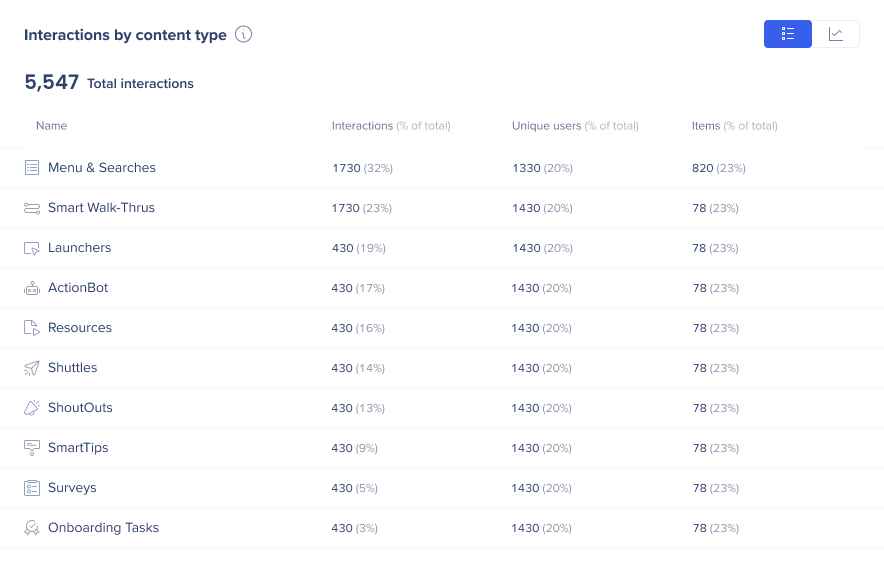
Interactions by content type
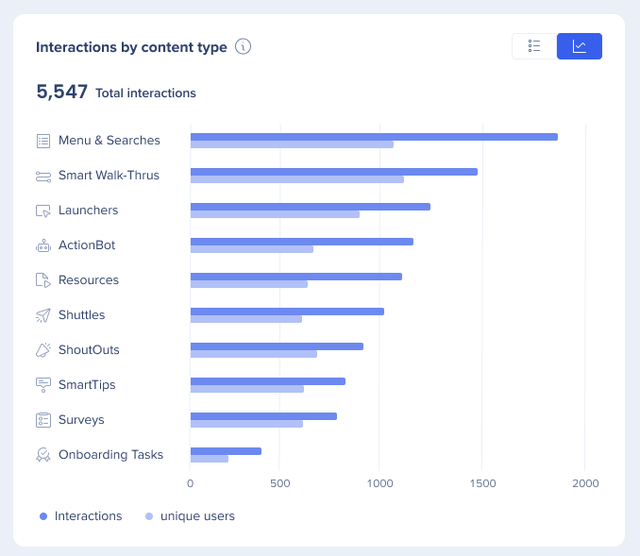
Each row represents a type of WalkMe item with one bar representing the number of interactions, and one the number of unique users.
You can use the toggle to access a list of users.
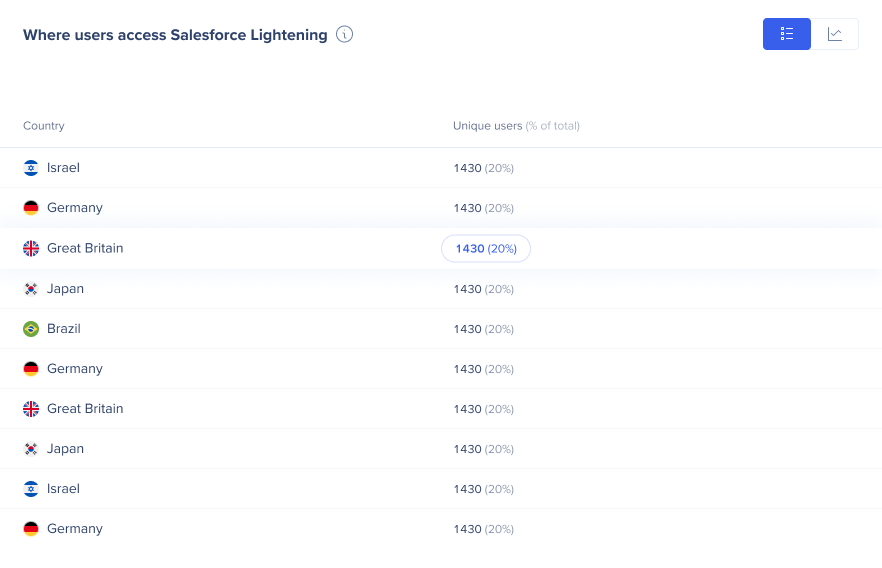
Where users access system
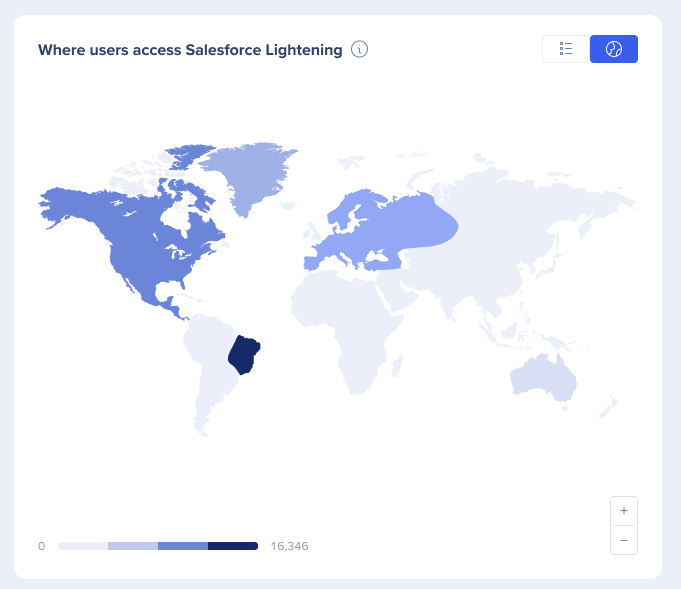
Shows a geo map with the locations users last accessed your system. The darker the color, the more users.
Top content
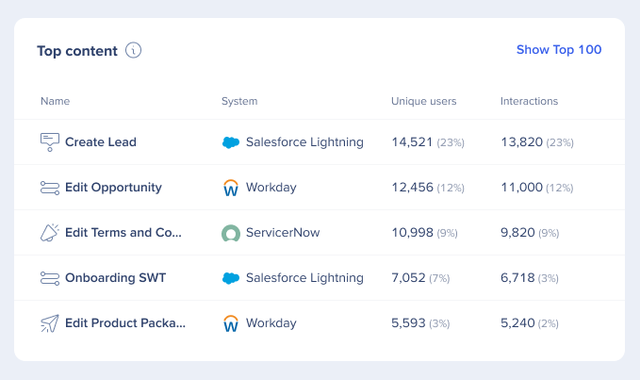
View your top WalkMe content with the following information:
-
Name: The name of the item
-
System: The system name where the content was built
-
Unique users: The number of unique users who have viewed the item
-
Interactions: The number of total interactions with the item
Click Show Top 100 to view more.
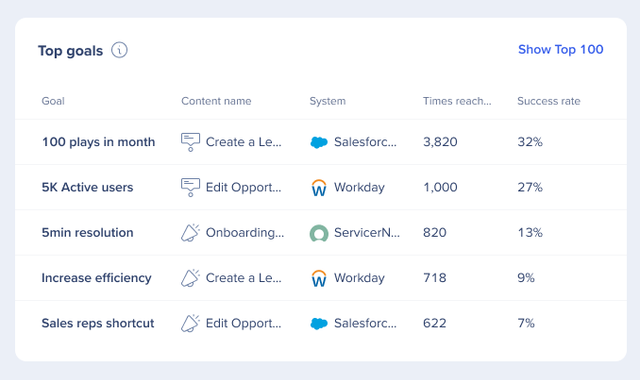
Top goals
View the top goals reached with the following information:
-
Goal:The name of the goal
-
Content name:The name of the item where the goal was built
-
System: The system name where the content was built
-
Times reached: The number of times users have reached the goal
-
Success rate:The percentage of times a specific Goal was reached
Click Show Top 100 to view more.
Additional Features
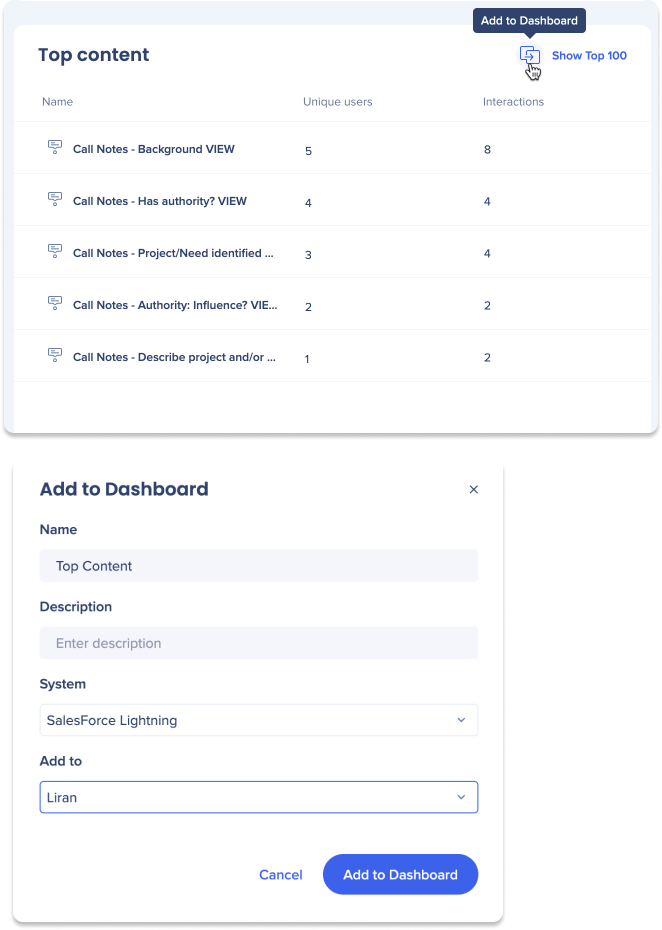
Add to Dashboard
With the Add to Dashboard feature, users have the ability to personalize custom dashboards by adding various widgets.
How to use:
-
Hover over the widget you'd like to add to a custom dashboard
-
Click the Add to Dashboard icon
-
Optional:
-
Users can change the name of the widget
-
Users can add a description of the widget
-
Users can select a different system that also uses the selected widget
-
Select a custom dashboard from the Add to dropdown menu. Alternatively, you can create a new dashboard and add the widget to it
-
Click Add to Dashboard
Go to Insights Classic
Click the Go to Insights Classics button at the top of the page to be redirected to the old insights page: insights2.walkme.com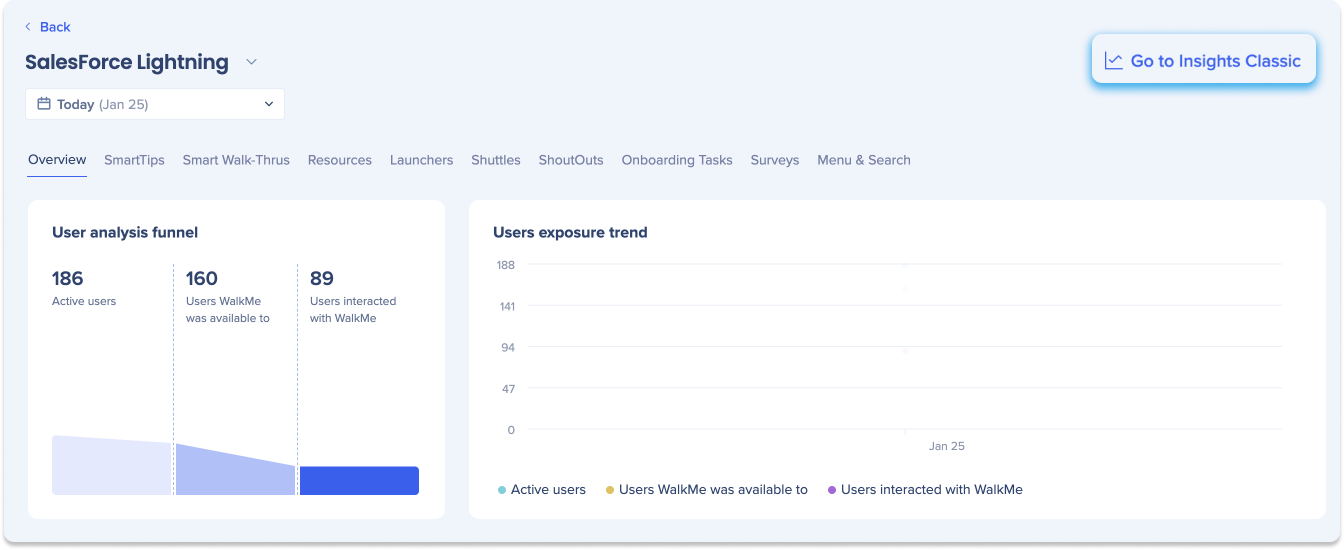
Open unique users lists
Within the Top Content widget, users have the ability to hover and click on the number of unique users for a WalkMe item. Upon doing so, a sidebar will appear which displays a comprehensive list of each individual user
Export
Users have the ability export any dashboard to PNG, PDF, or Add to Story (see below).
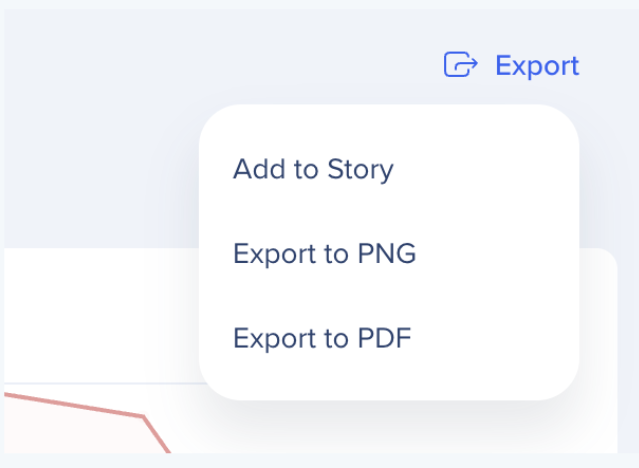
Add to Story
Users have the ability to export their System Overview dashboard to a new or existing Story.
How to use:
-
Click Export at the top-right of the page
-
Select Add to Story
-
A popup will appear with the option to either:
-
Select Existing Story
-
Add to New Story
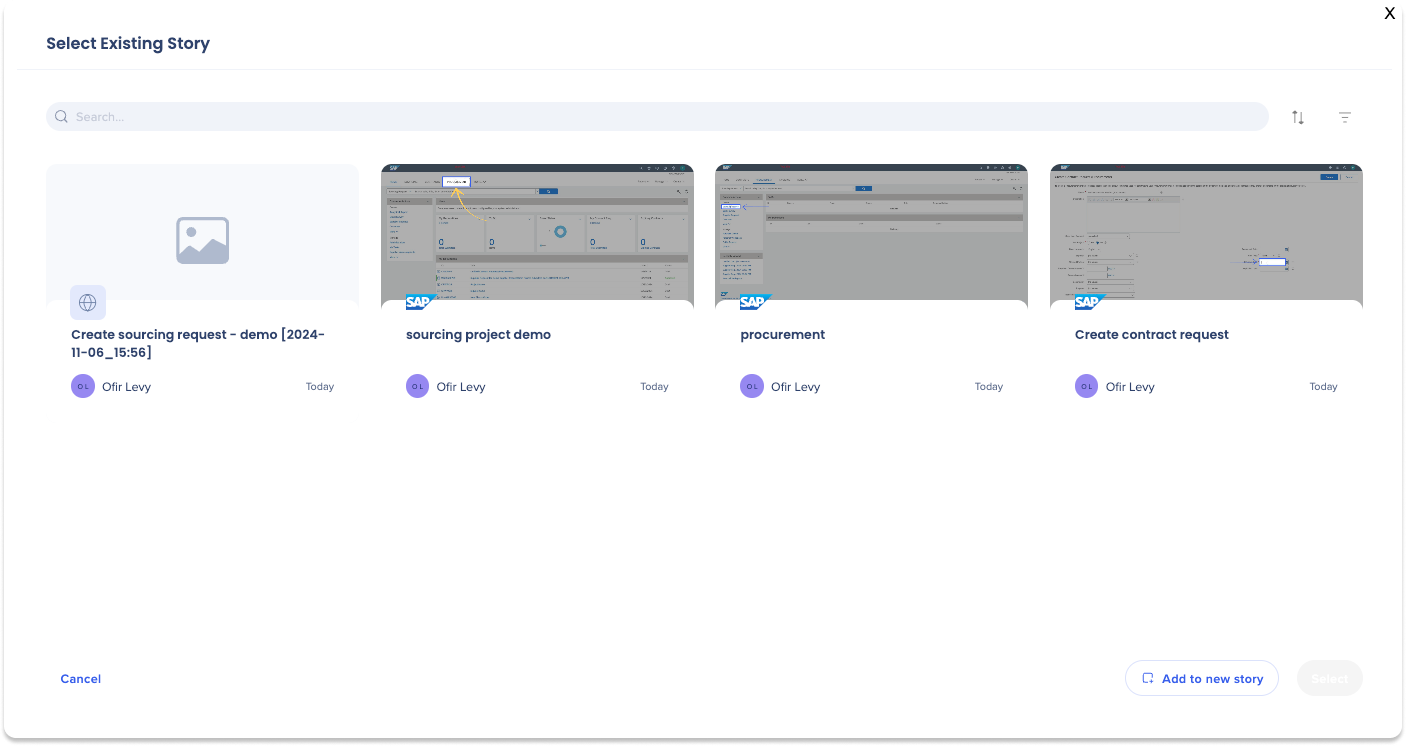
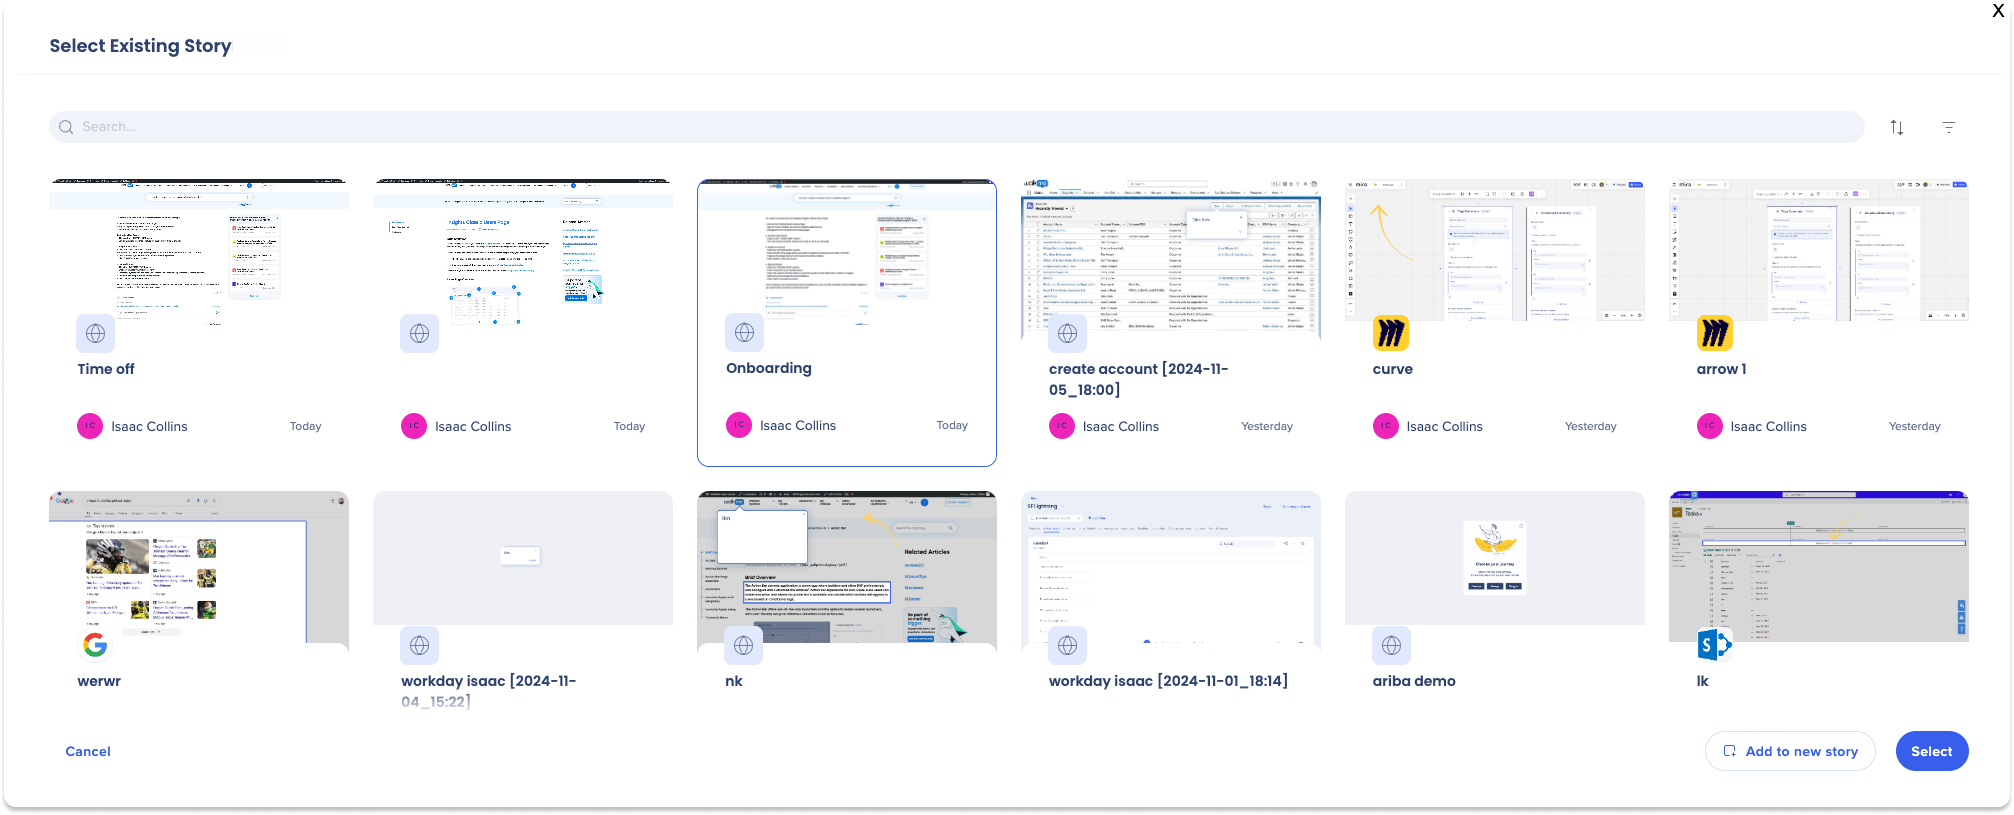
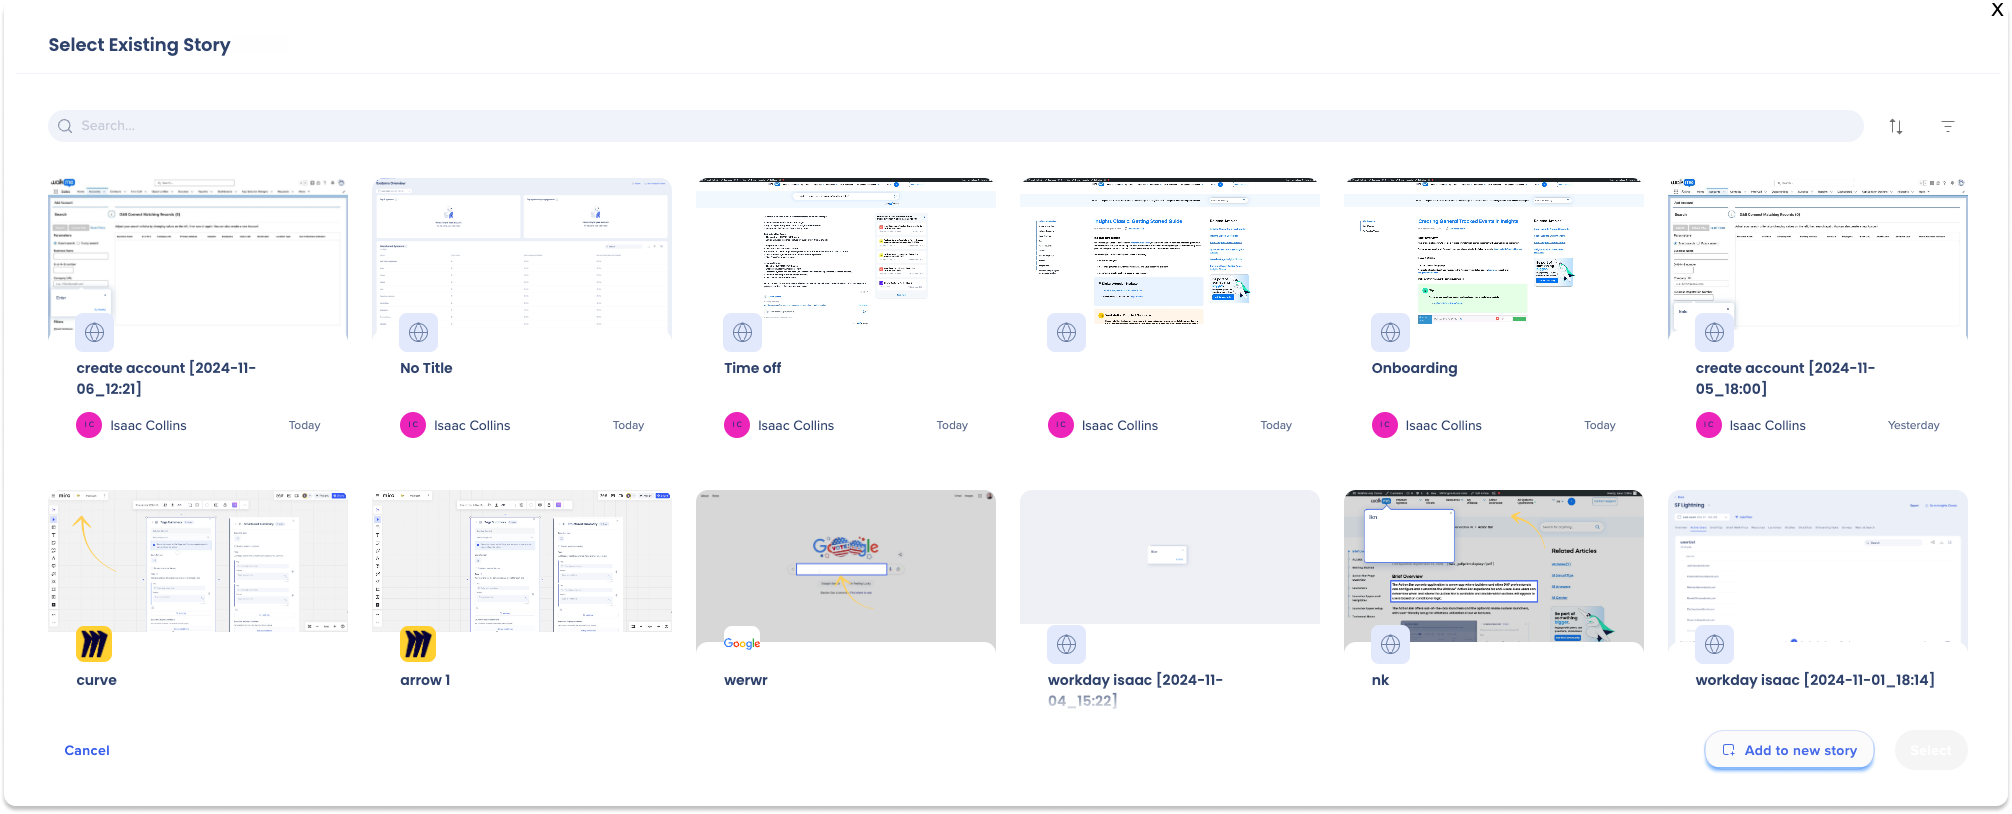
Select Existing Story
Users can find an existing story by:
-
Filtering
-
Sorting
-
Searching
-
Click the Story tile you want to export to
-
Click Select
-
A new tab will open in the Stories app with the existing Story
Add to New Story
-
Click Add to new story
-
A new tab will open in the Stories app with the new Story created
Technical Notes
-
Data shown is based on the WalkMe system associated with the app in Discovery, and not the app
-
Insights only looks at the most up to date definition from the editor. Sub items that are deleted will not be shown in Insights.
- Mobile native systems are are partially supported in content dashboards:
- Supported tabs: Overview, Active Users, Sessions, Account Analytics, Smart Walk-Thrus, Launchers, ShoutOuts, Surveys
- Not available: SmartTips, Resources, Shuttles, Onboarding Tasks, Goals, Menu & Search, AI dashboards
- Clicking on a content item redirects to the content manager rather than the editor
- User validity is not supported for mobile native systems