Activity Board
Brief Overview
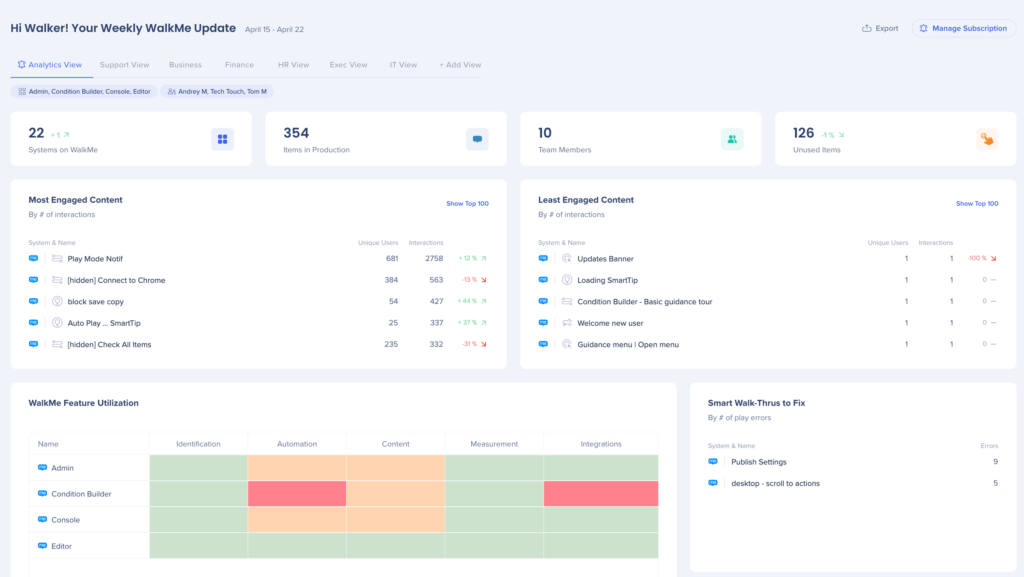
The Activity Board app in the Console, accessible at console.walkme.com/activity-board, provides key data to understand and analyze the performance of your WalkMe content. The Activity Board provides users with weekly "at a glance" insights that they can effectively act on in order to optimize their WalkMe content as part of their weekly workflow.
Monitor and track content progress by selecting the systems and creators for the views you wish to create. Filtering by creator allows users to personalize Board View content by segmenting per individual, manager, or team, as well as for specific systems.
Key characteristics:
- Quick access to key insights
- Data is visualized and easy to digest
- Updates weekly
- Easily subscribe, share, and export with others
Use Cases
- Get a quick overview of account status (number of systems, number of items in production, number of team members)
- Identify what's working and what's not, and leverage learnings to optimize content
- Identify what content is broken and why
- Understand what content is unused and should be cleaned or updated
How It Works
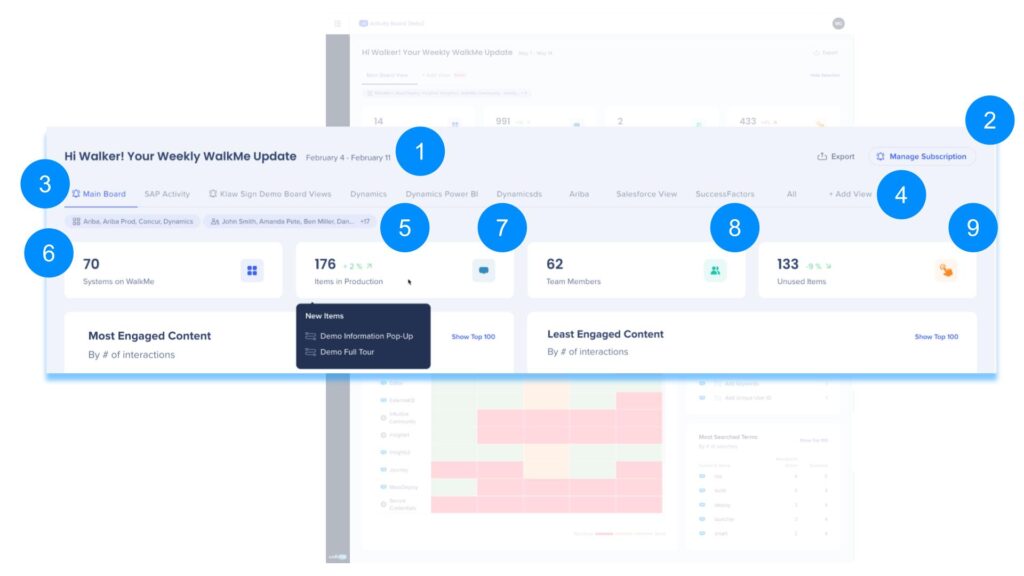
General Metrics
- Date range
- Shows the dates the dashboard is showing information on
- Currently limited to fixed weekly view - not editable
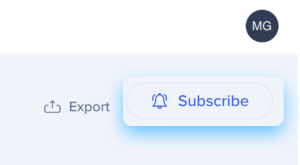
- Export and Subscribe buttons
- Export a .png or .pdf with dashboard information
- Subscribe to weekly WalkMe activity updates for board views
- Views header
- To edit a view, hover next to the name and click the options menu
- Note: You cannot delete a view if it is your only one
- + Add View button
- Selected Systems & Creators
- Lists the systems and creators that are displayed on the board view
- The default is for all assigned systems and creators to be selected
- Clicking the systems opens the Modify Board View panel
- Systems on WalkMe
- Shows the total number of systems for the account and % of change in number of systems since last calculation
- Hovering over the widget lists the new systems added since the last week
- Clicking on the widget opens admin.walkme.com/systems to manage systems
- Note: Even if the Board view is modified, you will continue to see all systems for the entire account here
- Items in Production
- Shows the total number of items published to production and % of change in number of items since last calculation
- Hovering over the widget lists the new items added since the last week
- Shows % of change in number of items since last calculation
- Note: Includes all types of WalkMe content
- Team Members
- Shows the total number of team members on the account and % of change in number since last calculation
- Hovering over the widget lists the new team members added since the last week
- Clicking on the widget opens admin.walkme.com/users-and-roles/users to manage users
- Note: Even if the Board view is modified, you will continue to see all team members for the entire account here
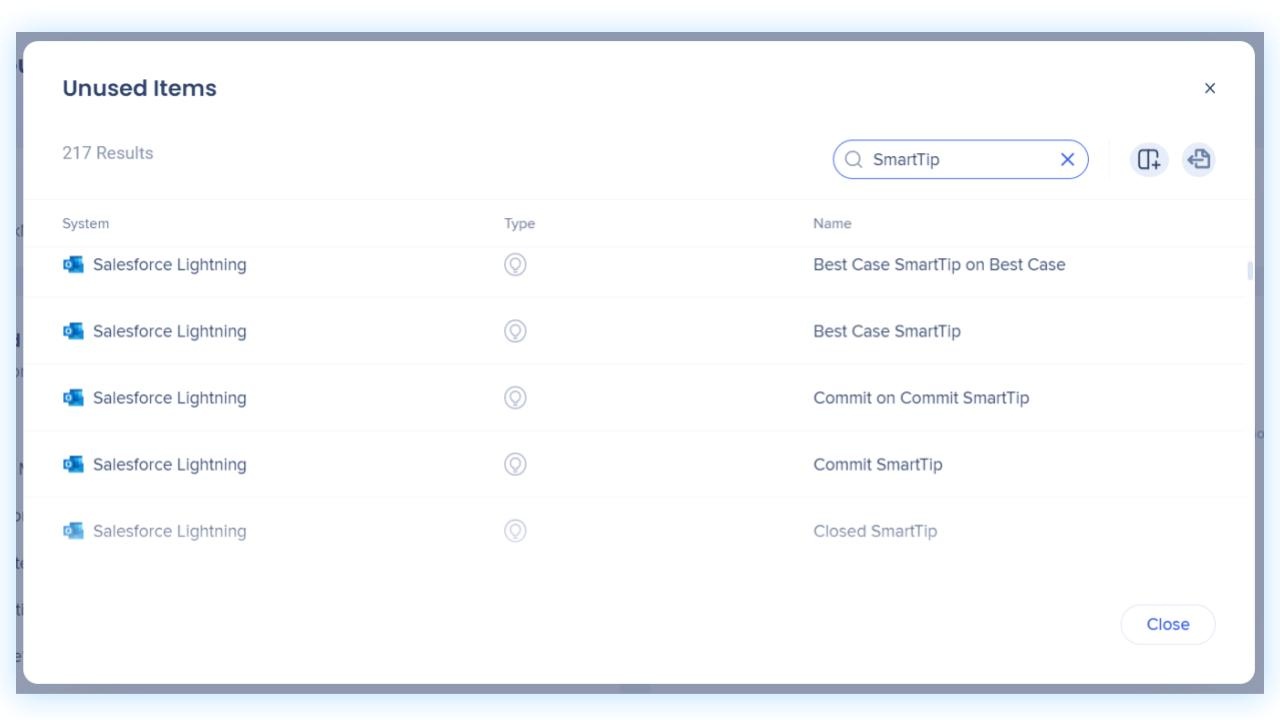
- Unused Items
- Shows the number of “unused items” that have been published to production for at least 30 days, and have engagement of 0 during this period
- Shows % of change in unused items since last calculation
- Hovering over the widget lists the new unused items since the last week
- Note: Includes all types of WalkMe content
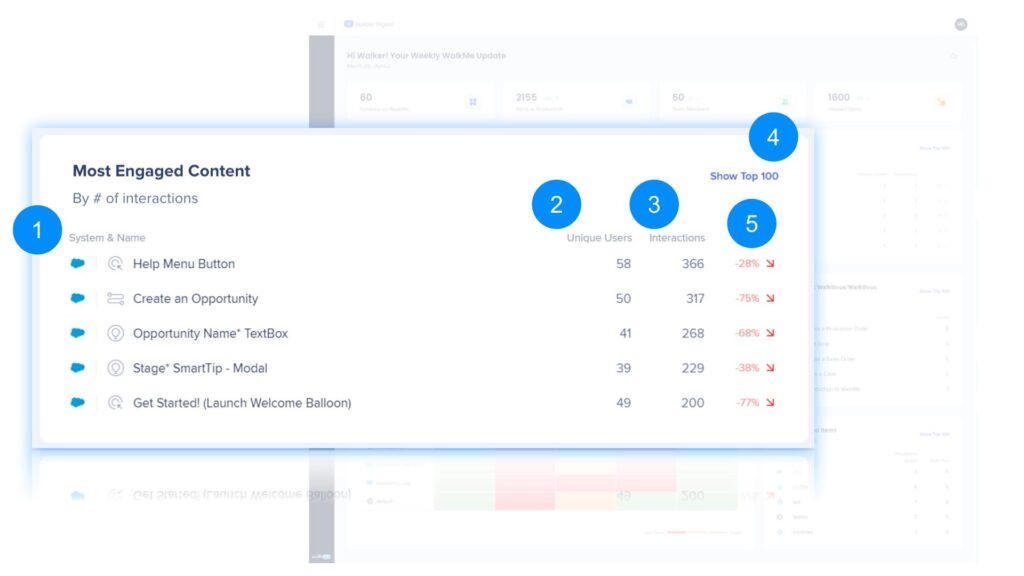
Shows Smart Walk-Thrus, SmartTips, ShoutOuts, and Launchers with the highest weekly engagement (not unique). Clicking on the widget opens a table with top 100 items.
- System type and name
- Number of unique users
- Number of interactions
- Opens a table with the top 100 most engaged items that can be customized by adding or removing columns and then exported
- % of change from previous week's engagement
Least Engaged Content
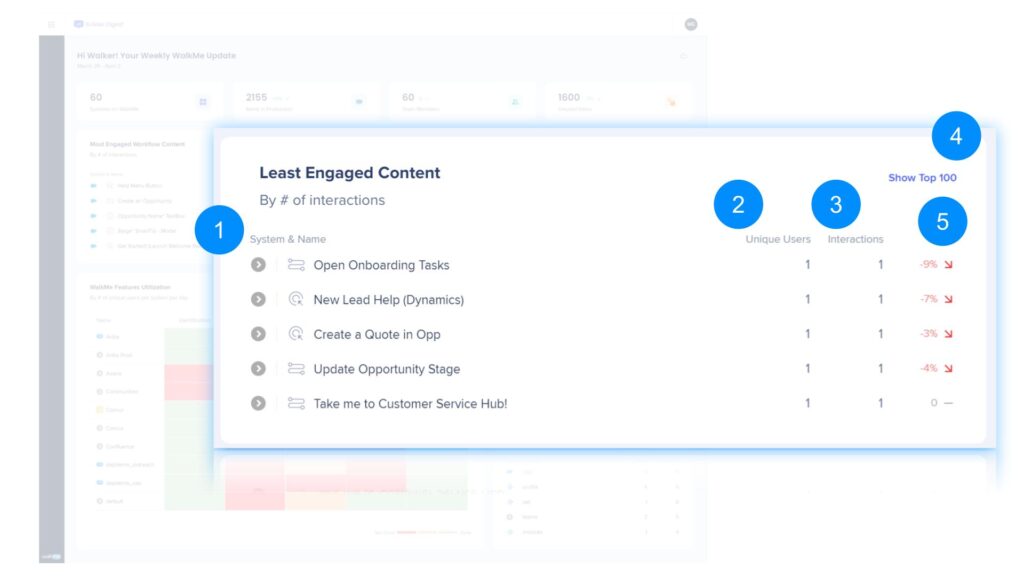
Shows Smart Walk-Thrus, SmartTips, ShoutOuts, and Launchers with the lowest weekly engagement (not unique). Clicking on the widget opens a table with top 100 items.
- System type and name
- Number of unique users
- Number of interactions
- Opens a table with the top 100 least engaged items that can be customized by adding or removing columns and then exported
- % of change from previous week's engagement
WalkMe Feature Utilization
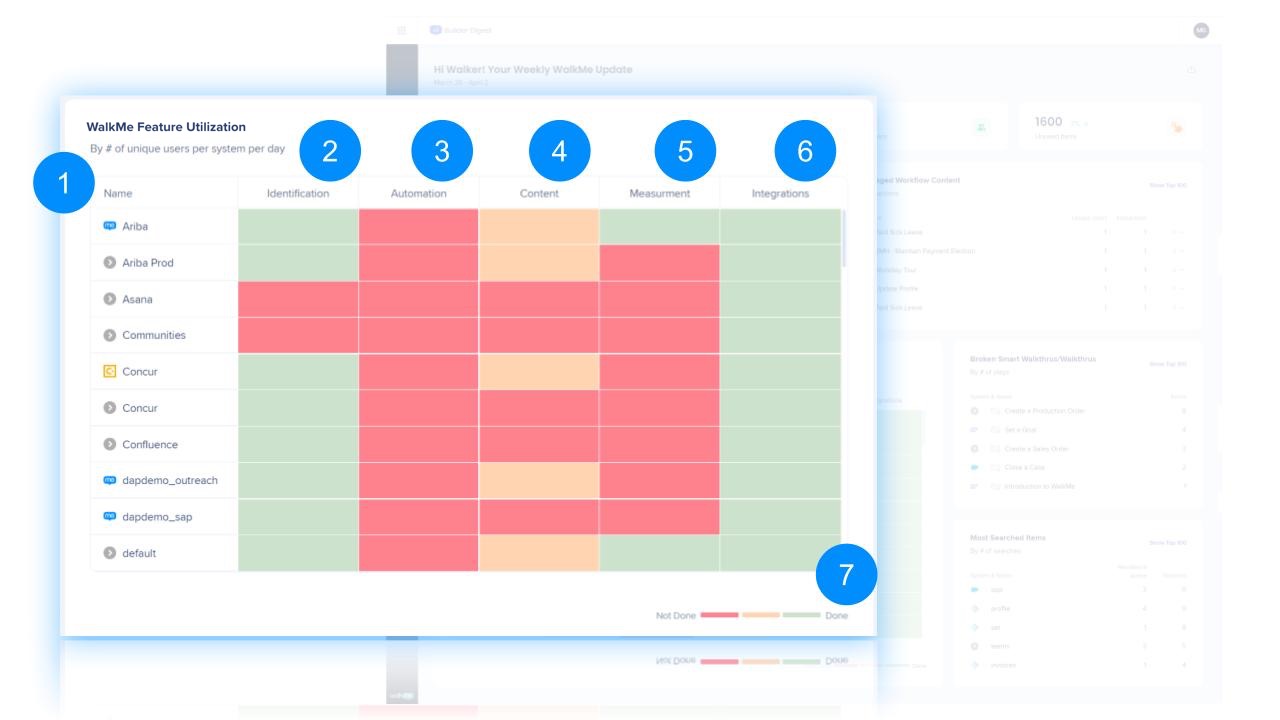
Shows a heat map to indicate whether systems have completed defined objectives related to feature utilization.
- System name
- Identification
- Defined objectives:
- UUID defined
- Defined objectives:
- Automation
- Content
- Measurement
- Defined objectives:
- Tracked Event created
- Defined objectives:
- Integrations
- Defined objectives:
- Integration set up complete for any integration in the Data Center
- Defined objectives:
- Heat map scale
- 🟢 Green = Utilization done (all tasks complete)
- 🟠 Orange = Utilization partially done (at least 1 task complete)
- 🔴 Red = Utilization not done (no tasks complete)
Smart Walk-Thrus to Fix
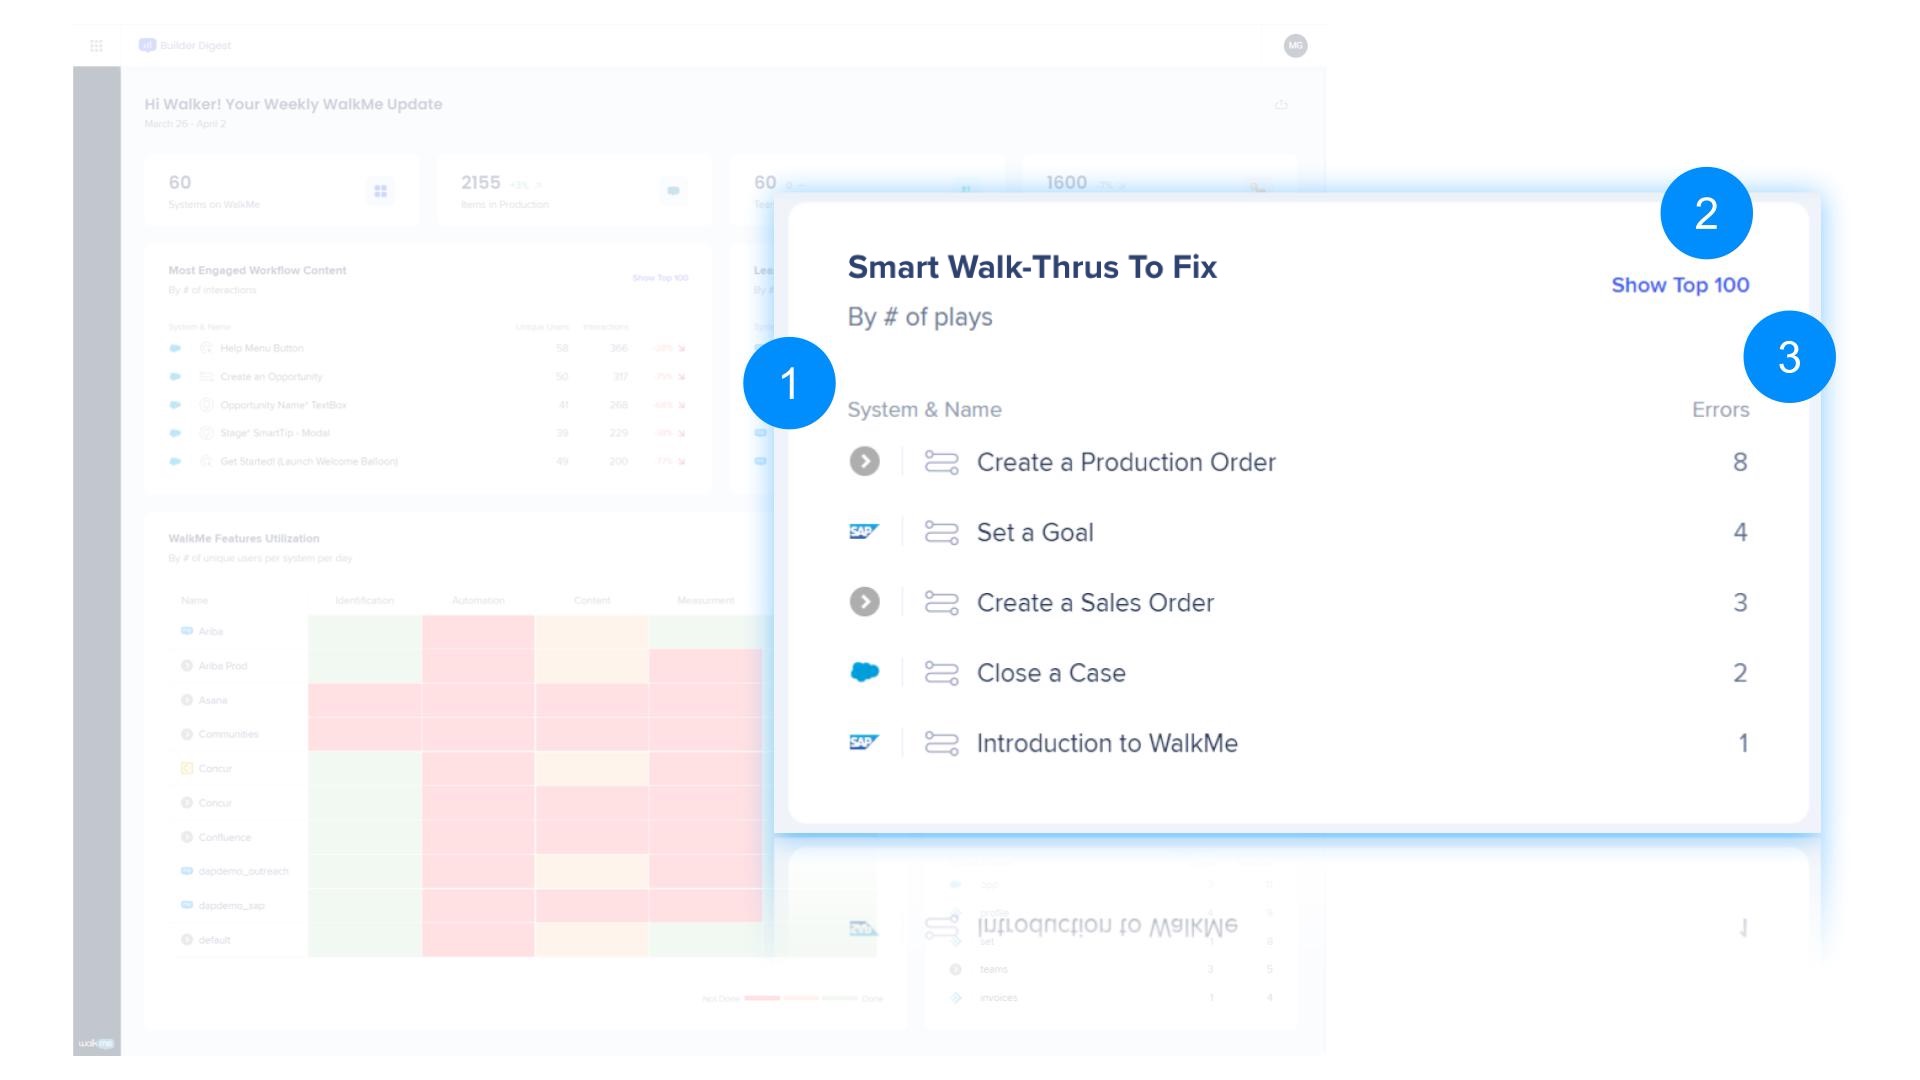
Shows Smart Walk-Thrus and Walk-Thrus with the highest number of errors (not unique) for the week of calculation. Clicking on the widget opens a table with top 100 items.
- System & Smart Walk-Thru name
- Opens a table with the top 100 broken Smart Walk-Thrus that can be customized by adding or removing columns and then exported
- Number of errors
Most Searched Terms
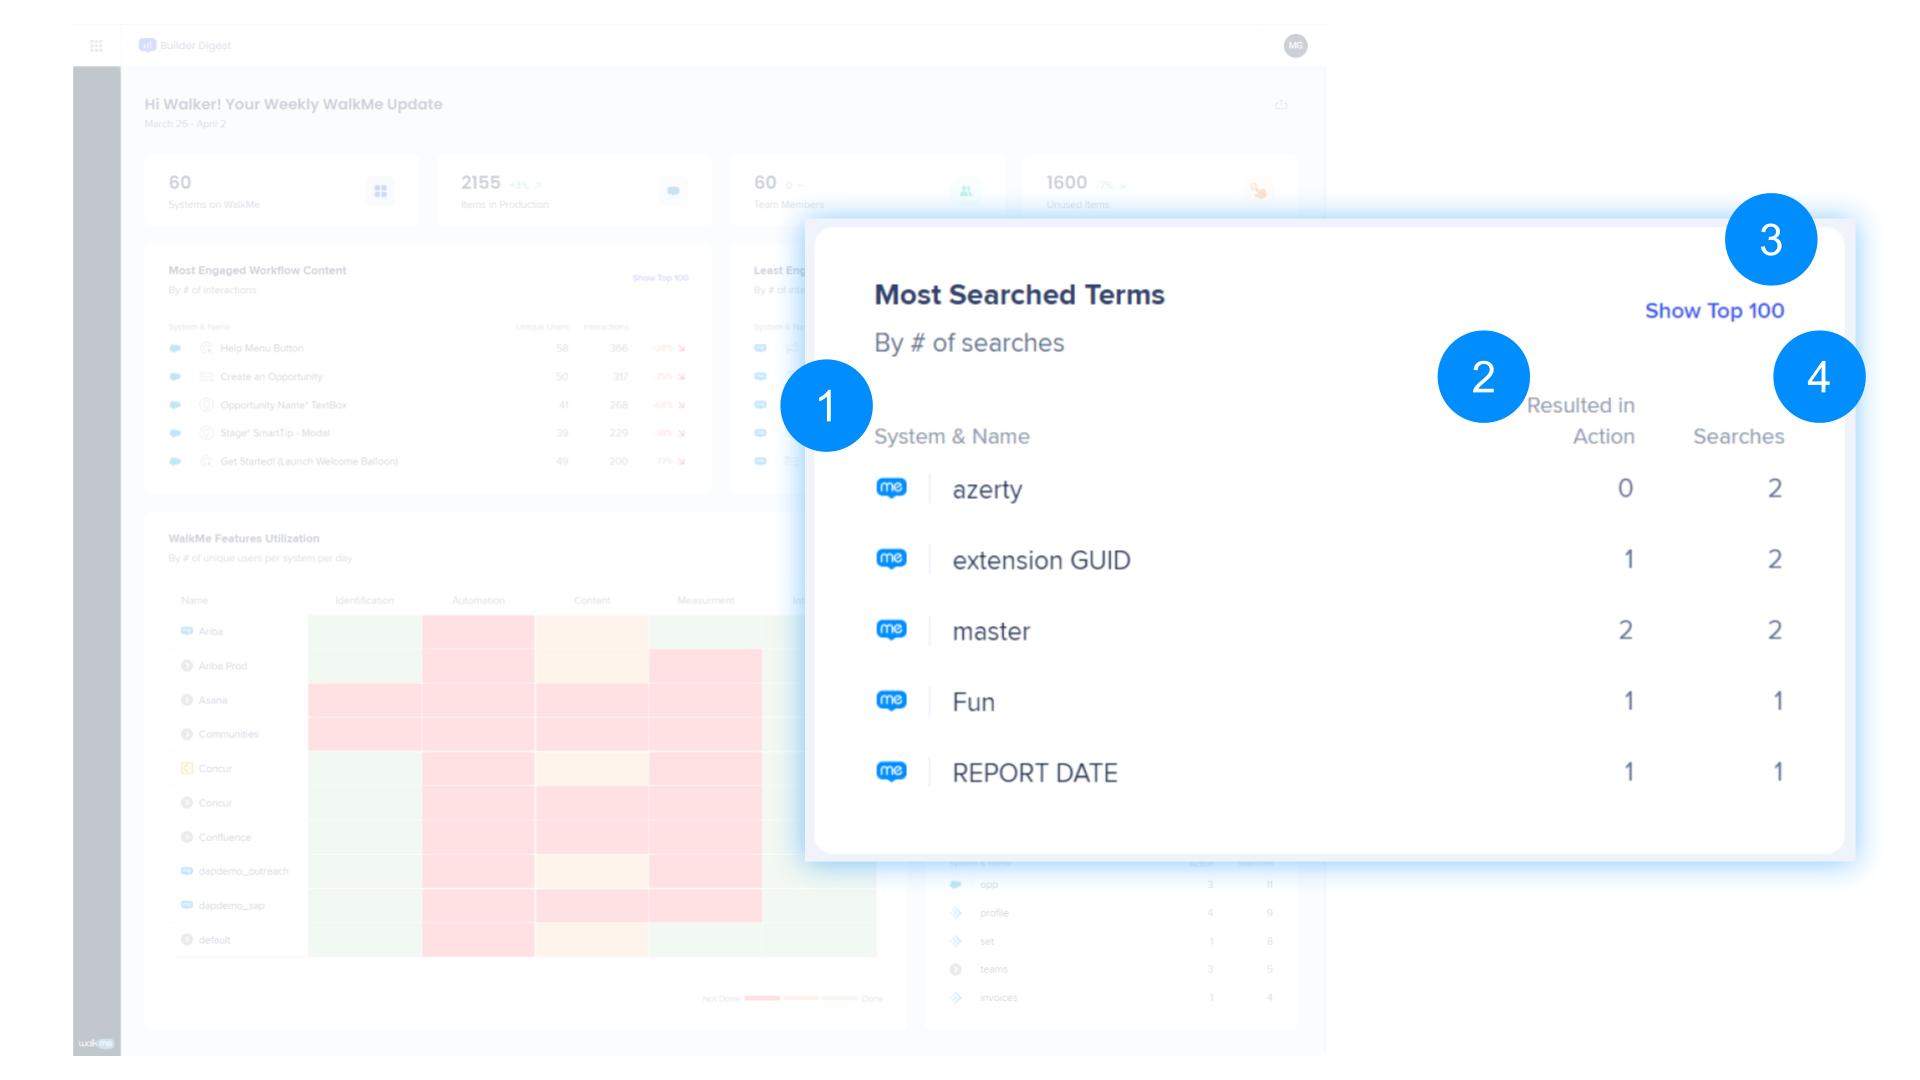
Shows menu search terms with highest weekly number of searches (not unique). Clicking on the widget opens a table with top 100 items.
- System & item name
- Number of searches that resulted in action
- Opens a table with the top 100 most searched items that can be customized by adding or removing columns and then exported
- Number of searches
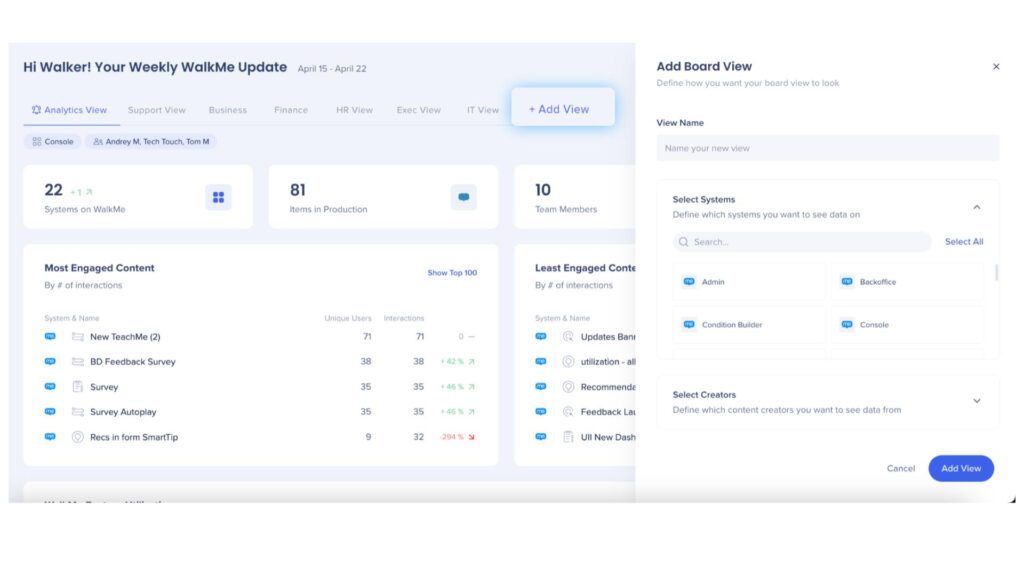
Add Board View
You may wish to create new board views to see relevant system and creator data grouped together. For example, all systems related to your Sales department or only content created by a certain user.
- Click + Add View to add a new board view
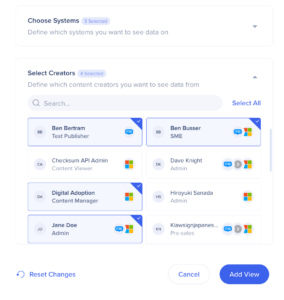
- Give your view a name and then can select which systems and content creators you want to see data on in that view
- Click Save
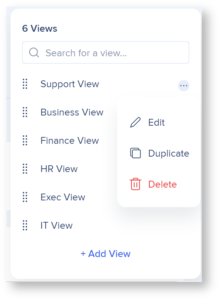
Edit Board View
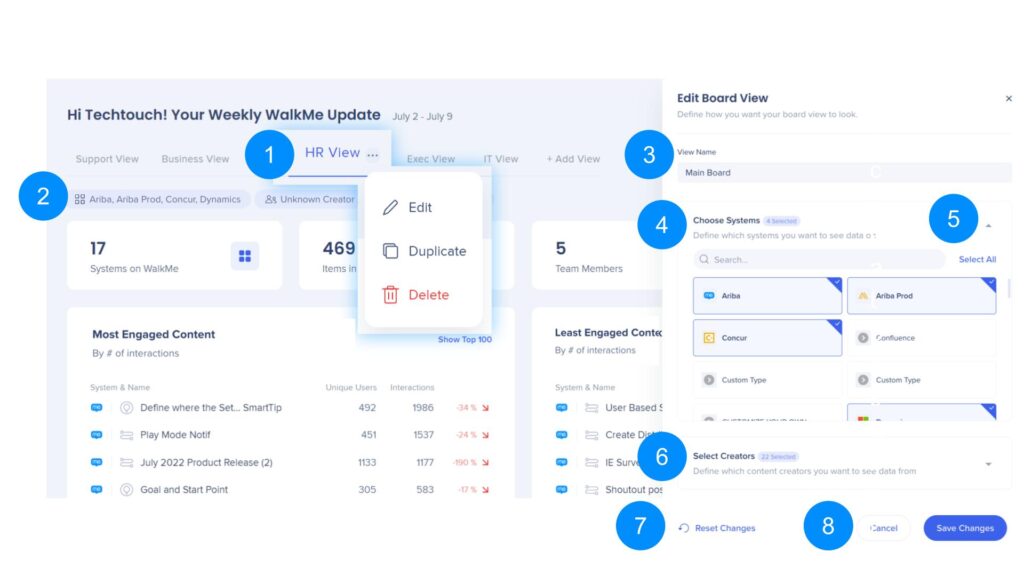
- Edit View actions
- Edit - opens a side panel to edit the board view
- Duplicate - opens a side panel to create a duplicate view that can be modified
- Delete - delete this view
- Selected Systems and Creators
- Clicking the systems or creators also opens the Edit Board View panel
- View Name
- Edit your view name
- Choose Systems
- Select which systems you want to see data on from those assigned to you
- Select All / Unselect All
- Select or deselect all of the systems you are assigned to
- Select Creators
- Select which content creators you want to see data from
- Reset Changes
- Selecting this will revert to the last saved view before any changes were made
- Cancel / Save
- Cancel or save the modified view
Subscription Email
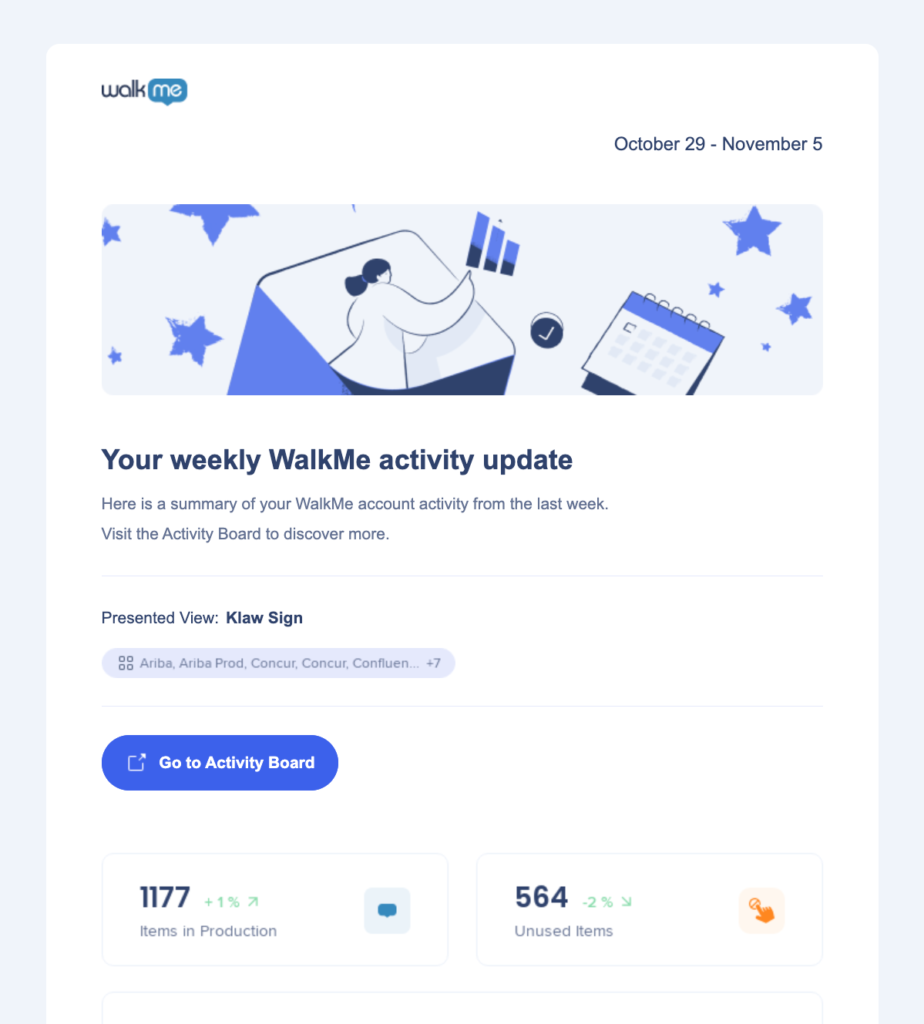
You can subscribe to get weekly email updates for your Activity Board views.
Emails are sent every Monday at 9:00 am UTC time.
- Click the Subscribe button
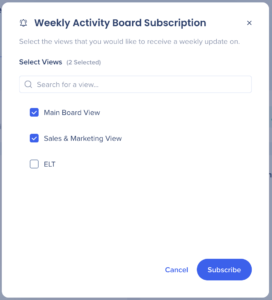
- Select which Activity Board views you want to receive updates on
- Note: You will receive a separate summary email for each view you select
- Click Subscribe
- Enjoy your weekly updates
Unknown Creators
A creator may be shown as "Unknown" for the following reasons:
- The user account was deactivated (they may no longer work at the company)
- Viewer doesn't have user management permissions so all creators will be displayed as “Unknown”
- WalkMe items were copied by WalkMe employees
- WalkMe items were duplicated prior to August 28, 2022
- WalkMe items were created before 2020 (no activity log records)
Technical Notes
- A maximum of 10 board views is supported
- Weekly timeframe is not customizable
- All assigned systems are shown for each user
- Only production environment data is supported
- You can only delete a view if you have more than one
- English and Japanese languages are supported
- Email subscription is available in English and Japanese
- Weekly subscription emails are sent on Mondays at 9AM UTC
- Currently, there is no way to change the time subscription emails are sent

