Brief Overview
When analyzing your apps data in the Insights Apps pages, you can drill down deeper into certain categories, including Smart Walk-Thrus, Walk-Thrus, ShoutOuts, and Surveys. Not only can you get an insightful overview of these WalkMe Items, but you can also investigate each item individually.
To read more about analyzing these WalkMe items as a group, read the Insights Apps Pages article.
Smart Walk-Thrus

General Smart Walk-Thru metrics
- Users Played This Smart Walk-Thru: The total count of unique users who played this particular Smart Walk-Thru, and the percentage of users WalkMe was available to
- Smart Walk-Thru Plays: The total count of times this Smart Walk-Thru was played (including multiple plays by the same user), and the average number of plays per user
- Main Goal Completed: The total count of main goals reached throughout all the Smart Walk-Thru plays, and the percentage of plays resulting in the main goal being completed
- Note: This counts only main goals, not milestone goals
- Activity chart: A visual representation of the three metrics described above over time
- Tip: Hover over a particular point on the chart to see the data for this date
- button: The export will provide a CSV with all the Smart Walk-Thru plays in the selected date range and filters with the following information:
-
-
- Smart Walk-Thru Name
- Initiator Type - the type of initiator that initiated the specific play
- Initiator Id - the id of WalkMe deployable that initiated the specific play
- Initiator Name - the name of WalkMe deployable that initiated the specific play
- User ID - the end user Id that played the SWT
- Last Step Reached Id - the id of the last step reached in that specific play
- Last Step Reached Name - the name of the last step reached in that specific play
- Last Step Reached Index - the index number of the last step reached in that specific play
- Was Goal Reached? - was the goal reached (yes/no)
- Start Time - the timestamp of the first step play
- End Time - the timestamp of the last step play
- Analytic Custom Properties - Name
- Analytic Custom Properties - Role
- Analytic Custom Properties - Type
- Analytic Custom Properties - Status
- Analytic Custom Properties - Info
Smart Walk-Thru Steps Analysis
-
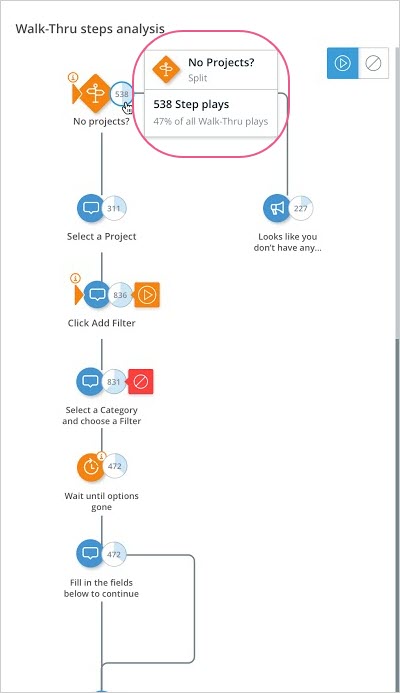
- Walk-Thru Flow: A flow diagram of each step, including branches, of this Smart Walk-Thru. The flow diagram, including names of steps and their position in the flow, reflects the last published state of the Smart Walk-Thru - any changes that were not published won't show up in this usage analysis.
- Numerical Step-Play Indicator: The number in this bubble represents the number of times this step was played of all the times this Smart Walk-Thru was played;
- This is graphically represented by the blue shading in each bubble; the higher the percentage of the whole the bubble's play number represents, the more of the bubble will be shaded in blue;
- Hover over the bubble to see the Step name, Step type, and the percentage of the time this Step was played of all the times this Smart Walk-Thru was played:

How Is This Walk-Thru Being Initiated?
- Provides a list and pie chart indicating the various ways this Smart Walk-Thru is being initiated, and the percentage of total initiations each item represents
Which Initiators Are the Most Effective?
- Shows the relative rates of main Goal completion per initiator type
Goal Completion Analysis
- Type: The dartboard icon indicates this is a main Goal, whereas the road-sign icon indicates a milestone Goal
- Name: Name of a specific Goal tied to the Smart Walk-Thru
- Users Completed Goal (of Total Users Played): The total count of users who reached Goals, and the percentage of total users (of all users who played this Walk-Thru) who reached this Goal
- Goal Completions (of Total Plays): The total count of Goals reached throughout all the Smart Walk-Thru plays, and the percentage of plays resulting in a Goal being completed
Walk-Thrus
The Walk-Thru drill-down page is identical to the Smart Walk-Thru drill-down page, with one exception — The Walk-Thru Steps Analysis section:
Walk-Thru Steps Analysis
- Name: The name and ordinal number of a particular Step in this Walk-Thru
- Step Plays (of Total Walk-Thru Plays): The total count of times a particular Step was played, as well as the percentage of total Walk-Thru plays this number represents.
Surveys

General Surveys metrics
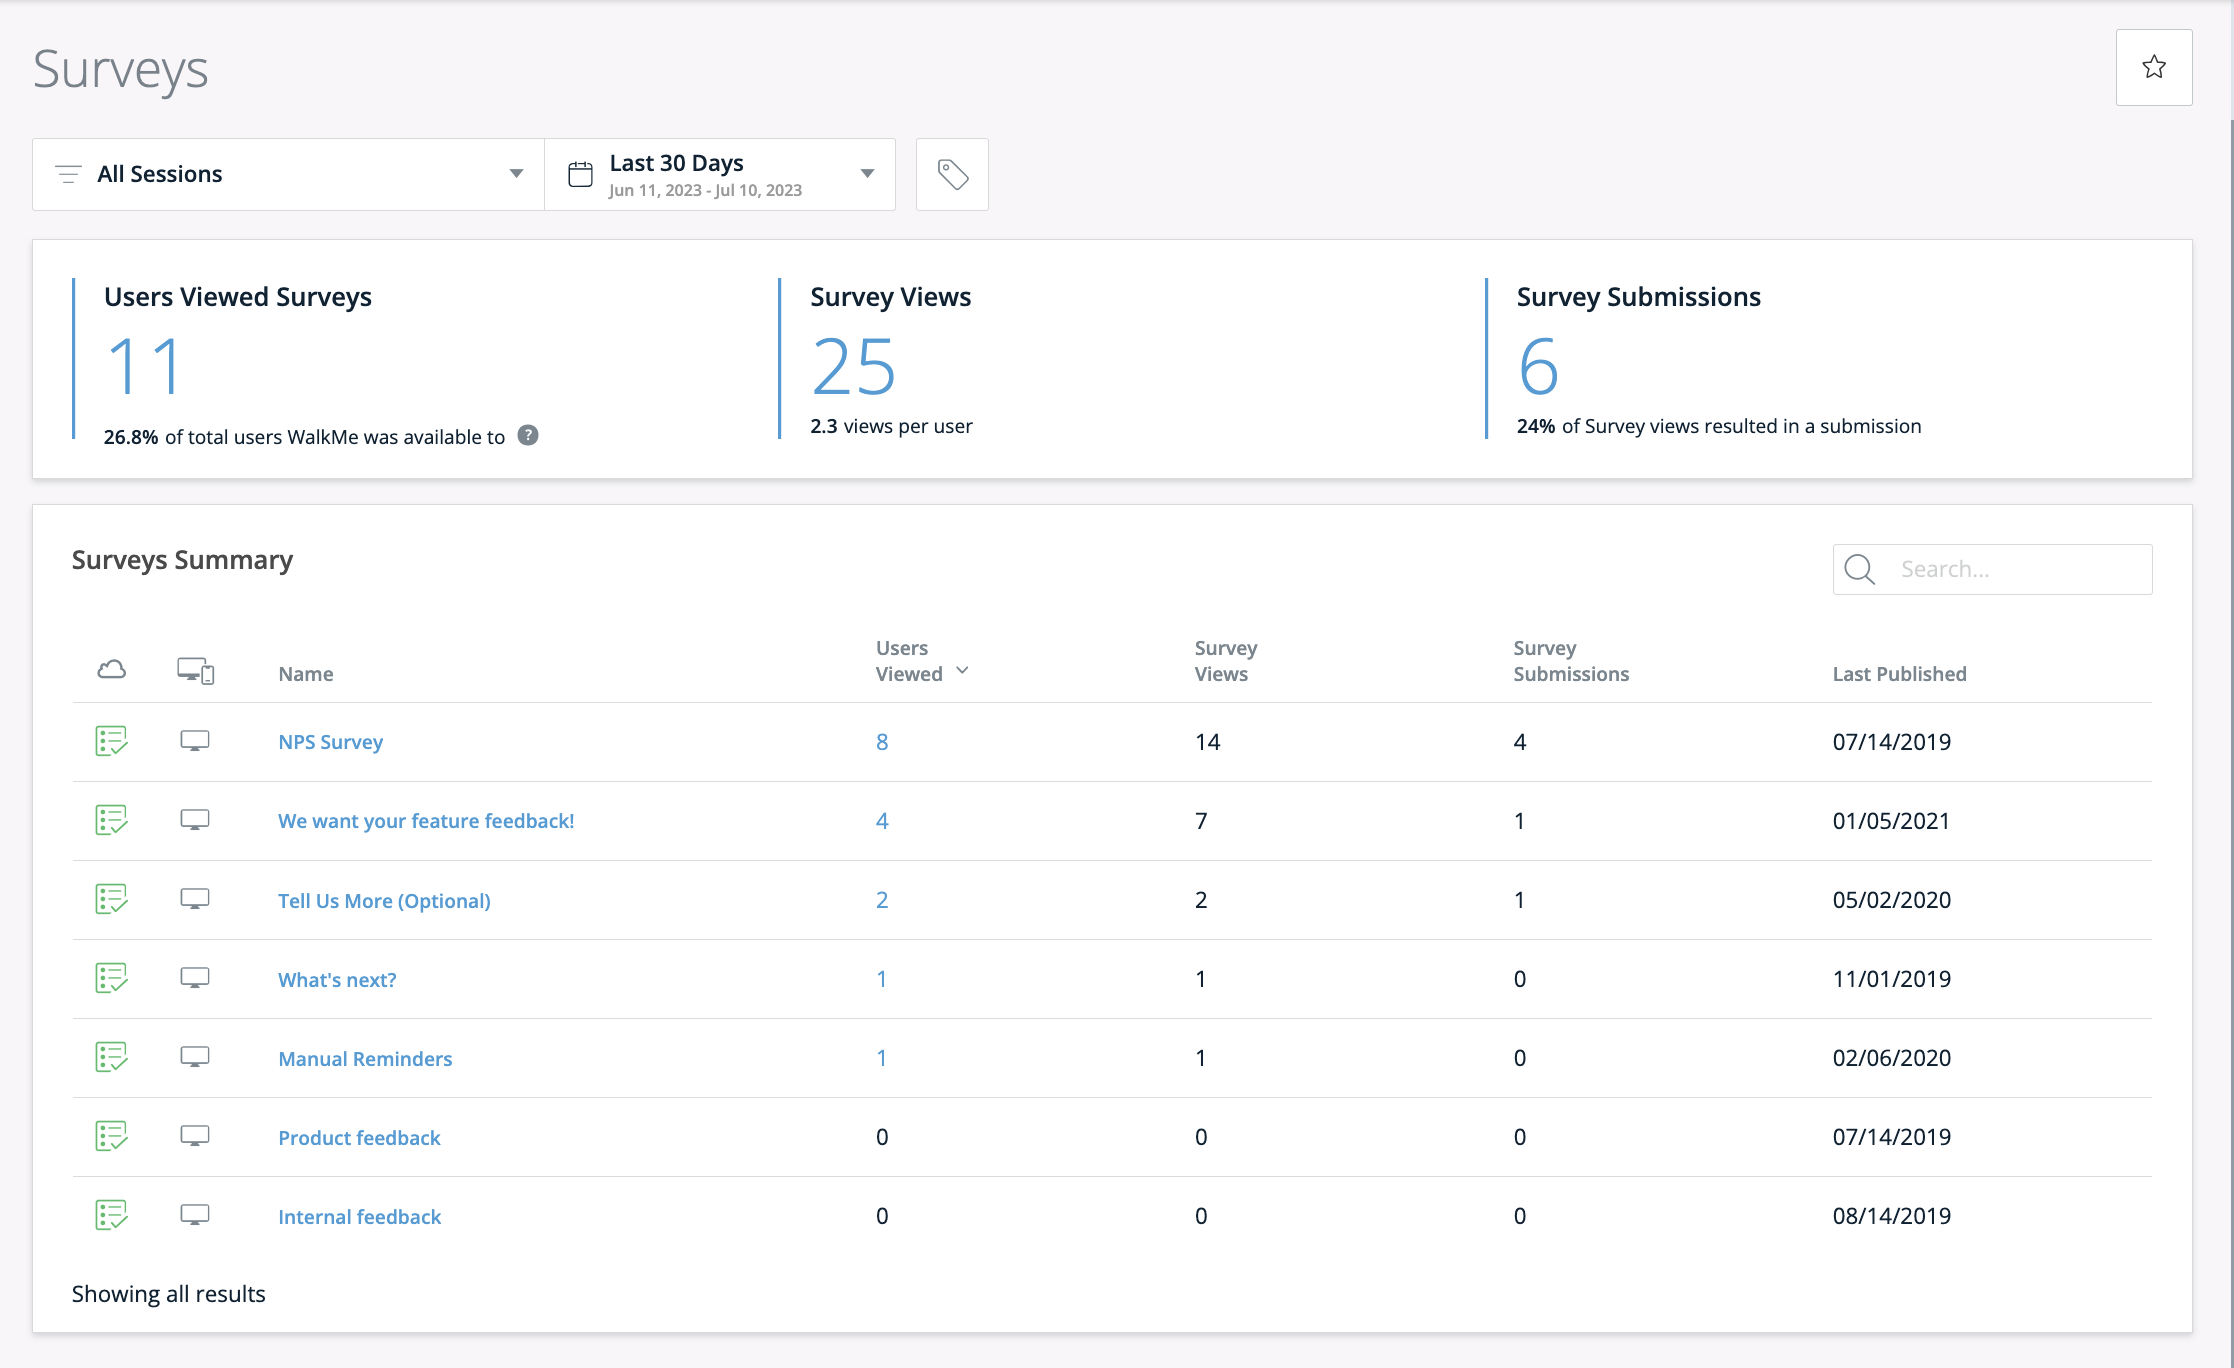
- Users Viewed This Survey: The total count of unique users who viewed this Survey, and the percentage of users WalkMe was available to
- Note: This list can be viewed by clicking the "Click here to view the users list" button.
- Survey Views: The total count of times this Survey was viewed (including multiple views by the same user), and the average number of times each user viewed this Survey
- Survey Submissions: The total count of surveys submitted, and the percentage of Survey views that resulted in a submission
Results Overview
This section shows each question in your Survey and its related statistics. Under the question you can see the question type and number of responses for that specific question.
Multiple selection-type question:
- The overview includes a bar chart showing all the possible responses and the number and percentage of users who selected each response
Single selection-type question:
- The overview includes a pie-chart showing the percentage of users who selected Yes and No respectively
Net Promoter Score-type question:
- The overview includes the overall NPS score, as well as the percentage of users who selected each possible NPS score, and whether they are detractors (potentially harmful to your reputation), passives (unlikely to be harmful or helpful) or promoters (likely to be helpful to your reputation)
- Detractors, passives, and promoters are displayed with two decimal digits - for example: 41.37%
Free text-type question:
- The overview includes each response submitted, the name of the user who submitted it, and the response date
How to get all the responses of a Survey
In order to see all the individual responses submitted by your users (not just an aggregated view), you can export the responses to a .CSV format and review all answers by a user.
The export will output all responses by timestamp, end-user ID, and answer.
ShoutOuts

General ShoutOut metrics
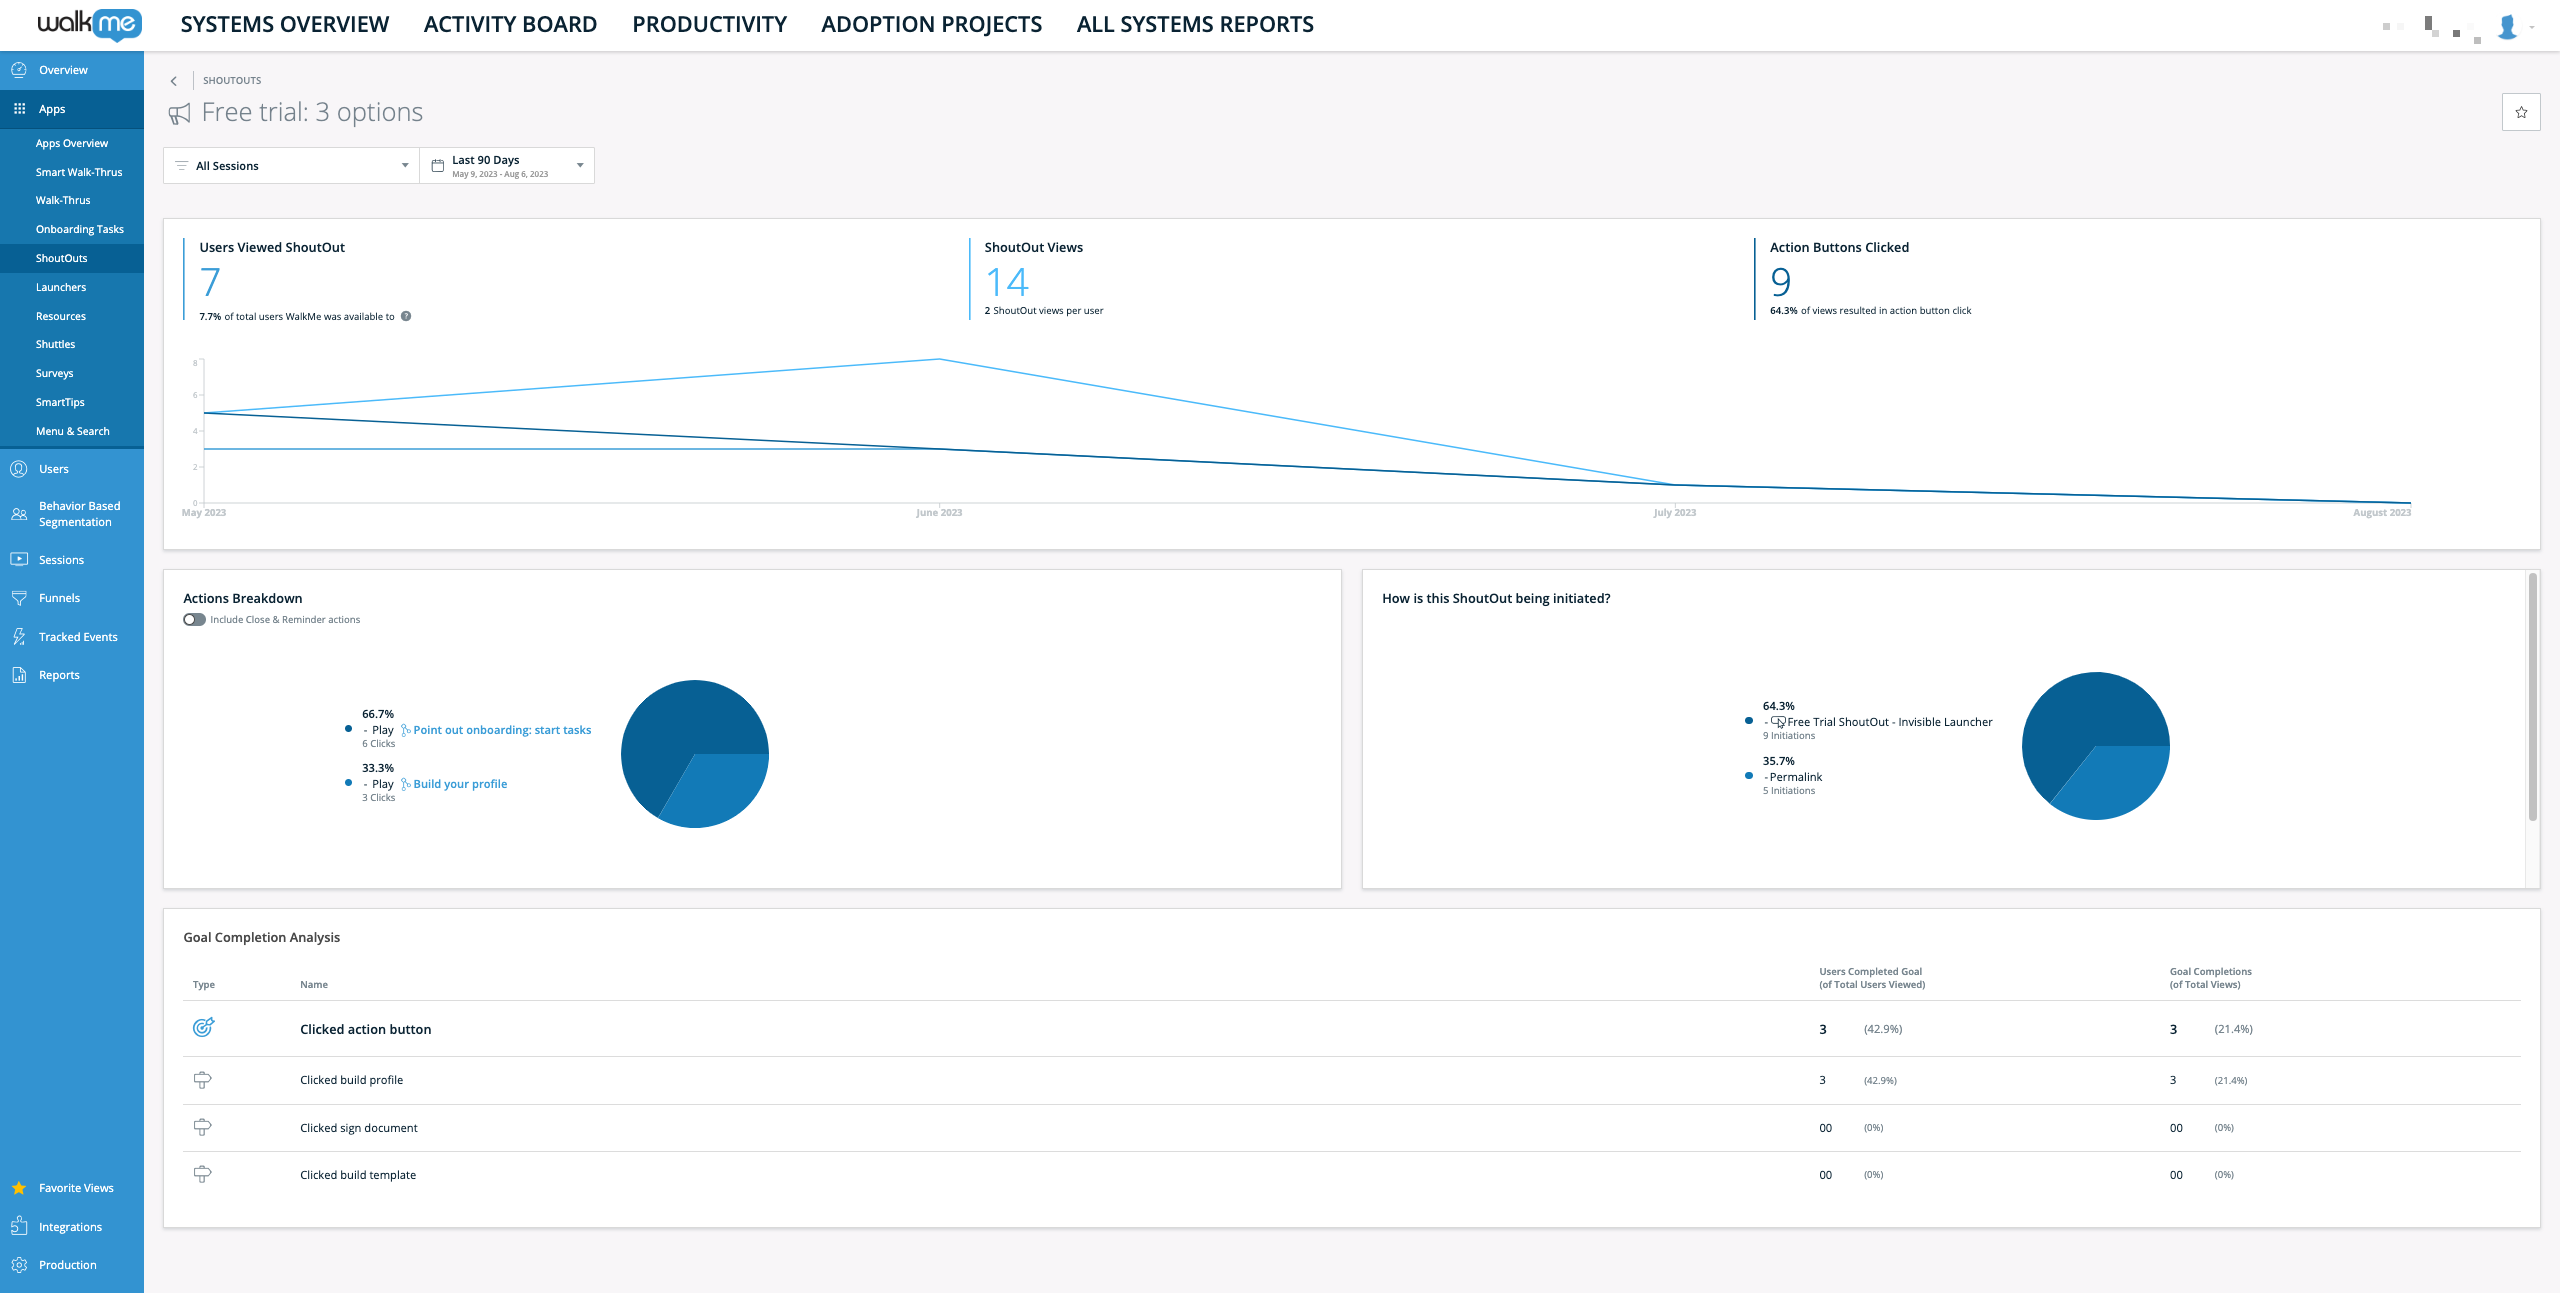
- Users Viewed this ShoutOuts: The total count of unique users who viewed this ShoutOut, and the percentage of users WalkMe was available to
- Note: This list can be viewed by clicking the "Click here to view the users list" button.
- ShoutOut Views: The total count of times this ShoutOut was viewed (including multiple views by the same user), and the average number of views per user
- ShoutOut Action Button Clicked: The total count of action buttons users clicked throughout this ShoutOut views, and the percentage of ShoutOut views resulting in an action button click
Action Breakdown
- Provides a list and pie chart indicating the various ShoutOut actions taken by the user, and the percentage of total actions each item represents
- Includes close/reminder actions toggle, but when turned on the actions breakdown numbers will include also "Close" and "Reminder" actions, by default the toggle is turned off and these actions are not taken into account in the breakdown
-
- In this example, in 70% of the time, the action taken by users exposed to this launcher was Launch WalkThru
How is this ShoutOut being initiated
- Provides a list and pie chart indicating the various ways this ShoutOut is being initiated, and the percentage of total initiations each item represents
- In this example, the ShoutOut was automatically played in 67% of the time
Goal completion analysis
- Type: The "dartboard" icon indicates this is a main Goal, whereas the "road-sign" icon indicates a milestone Goal
- Name: Name of a specific Goal tied to the ShoutOut
- Goal Completions (of Total Plays): The total count of Goals reached throughout all the Smart Walk-Thru plays, and the percentage of plays resulting in a Goal being completed
- Users Completed Goal (of Total Users Played): The total count of users who reached Goals, and the percentage of total users (of all users who played this Walk-Thru) who reached this Goal


