TeachMe Analytics Overview displays combined analytics of all course data based on the following components:
Filters
System
Toggle between your systems to view analytics for the courses on each.
Environment
Toggle between your Test, Production, etc environments to view analytics on each.
Time
The Time Filter allows you to monitor course data within a chosen date range. Once you have chosen your date range, all data fields within this page will display data within that range. The default range is 7 days; after the first change, each new session will display the new range until you change it again.
Historic Data is available in a rolling window of one year.
Metrics
User Started
This field displays the number of users who started at least one course in the date range.
Starting a course means starting any Smart Walk-Thru or Resource that is assigned to that course, even if started outside TeachMe.
User Completed
This field displays the number of users that completed any course within the date range. If the same user completed a course multiple times, the most recent completion is displayed. A course is considered complete when the last open item is completed, even if the item was done outside TeachMe.
Quiz Completion Rate
This field displays the rate of users who passed the quizzes out of the total number of users who submitted a quiz in the date range. This rate is calculated by using the most recent quiz submission per user per course.
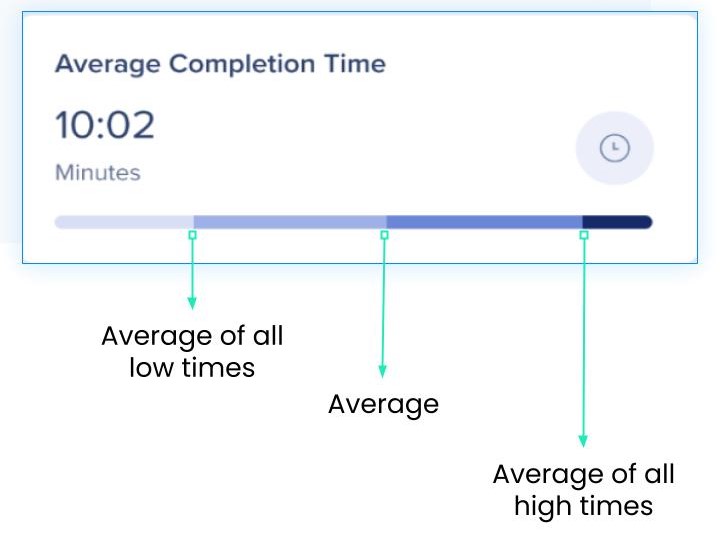
Avg. Completion Time
This field displays the average time between “User Started” and “User Completed”, for a specific course, for each user, within the date range.
Users that only have “User Started” or “User Completed” (not both) in date range, will not be included in this metric.
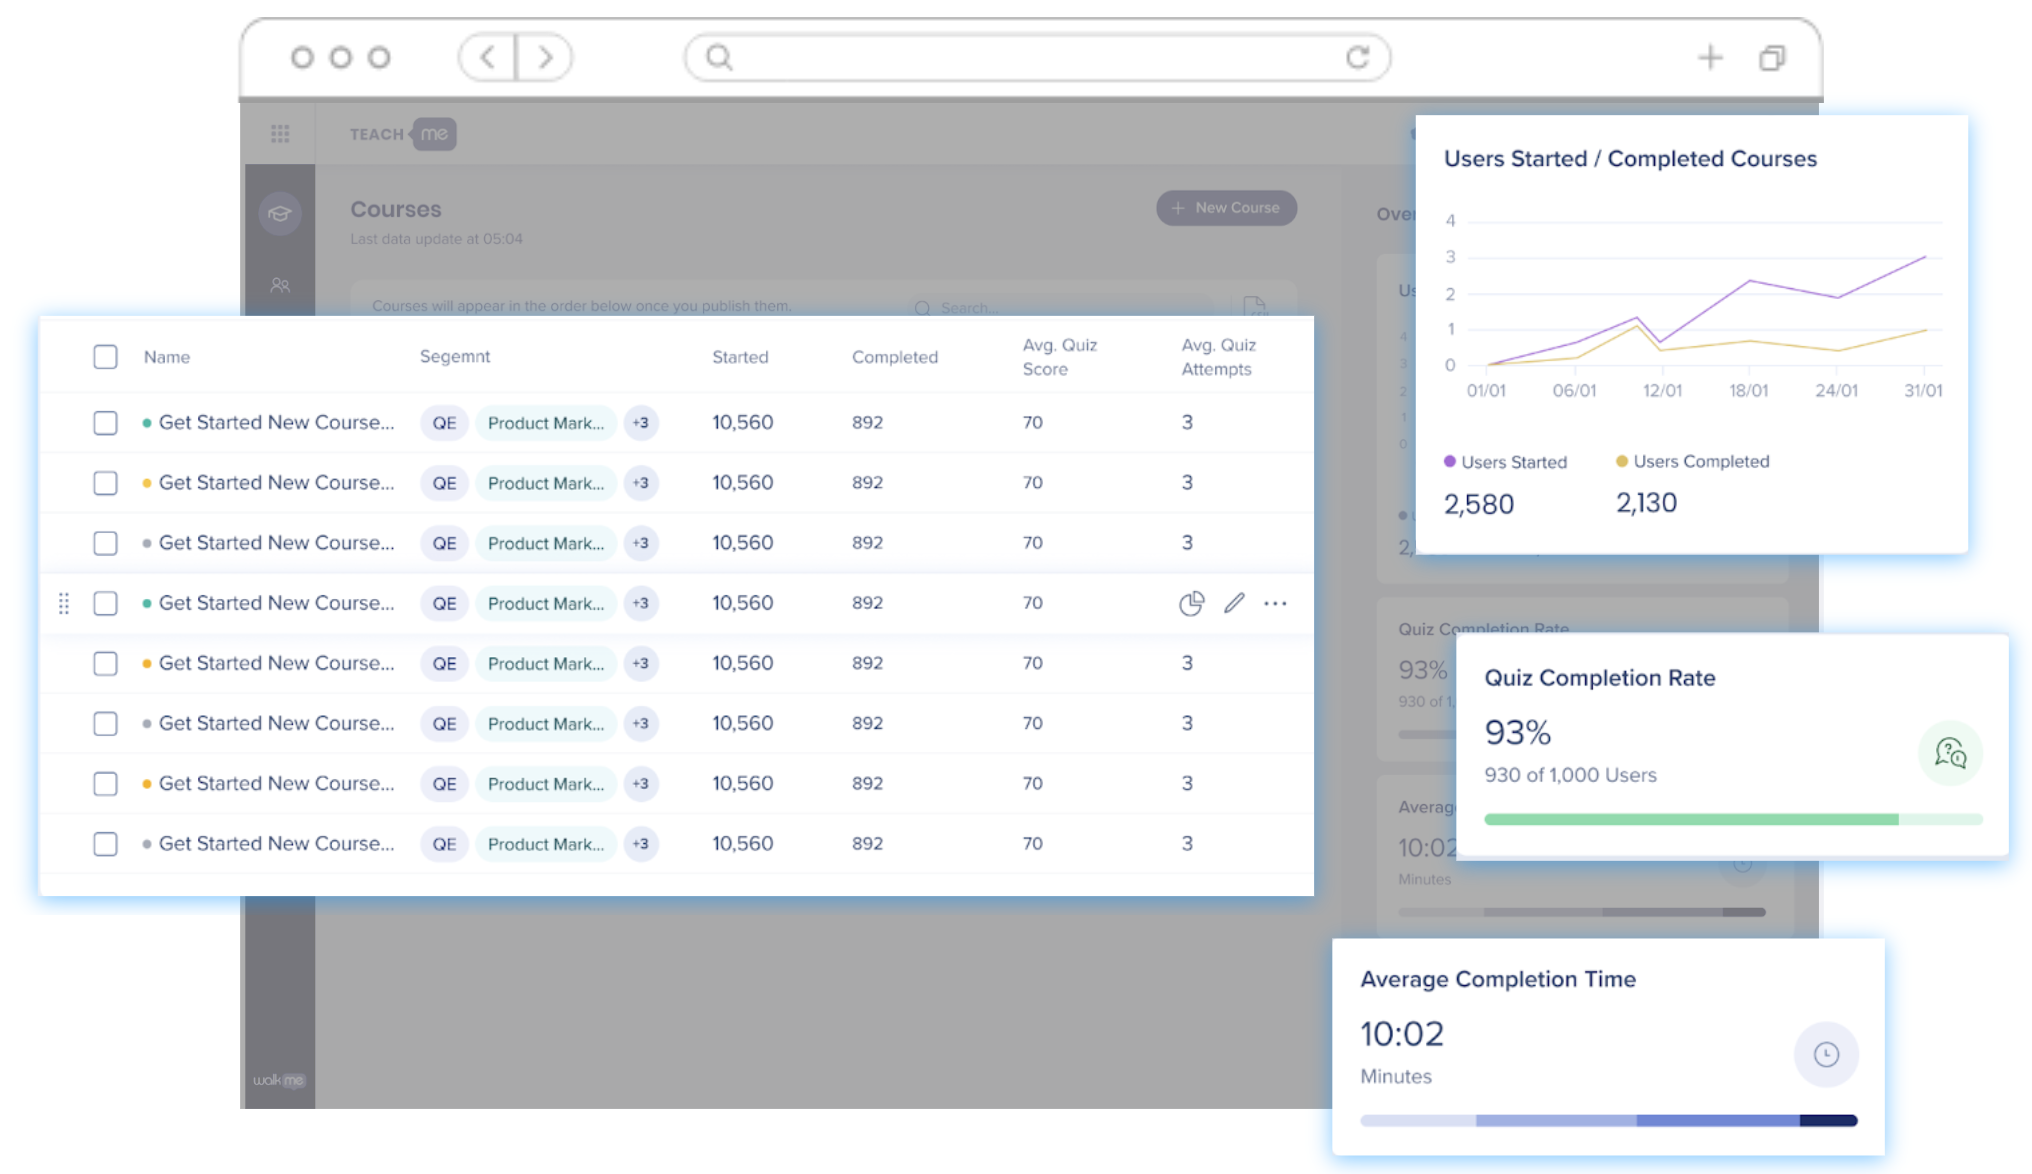
Courses Table
Let's take a look at each column within the Courses table:
Segment: This column displays the audience (or segment) that has access to this course.
Started: This column displays how many users started this course within the selected date range.
Completed: This column displays how many users started and completed this course.
Avg. Quiz Score: This column displays that course's average of all most recent “Quiz Scores” of all users within the selected date range of that course
- If this course doesn't have a quiz, a dash is displayed.
Avg. Quiz Attempts: This column displays the total number of times a user completed a quiz and received a Quiz Score, within the selected date range.
- If this course doesn't have a quiz, a dash is displayed.
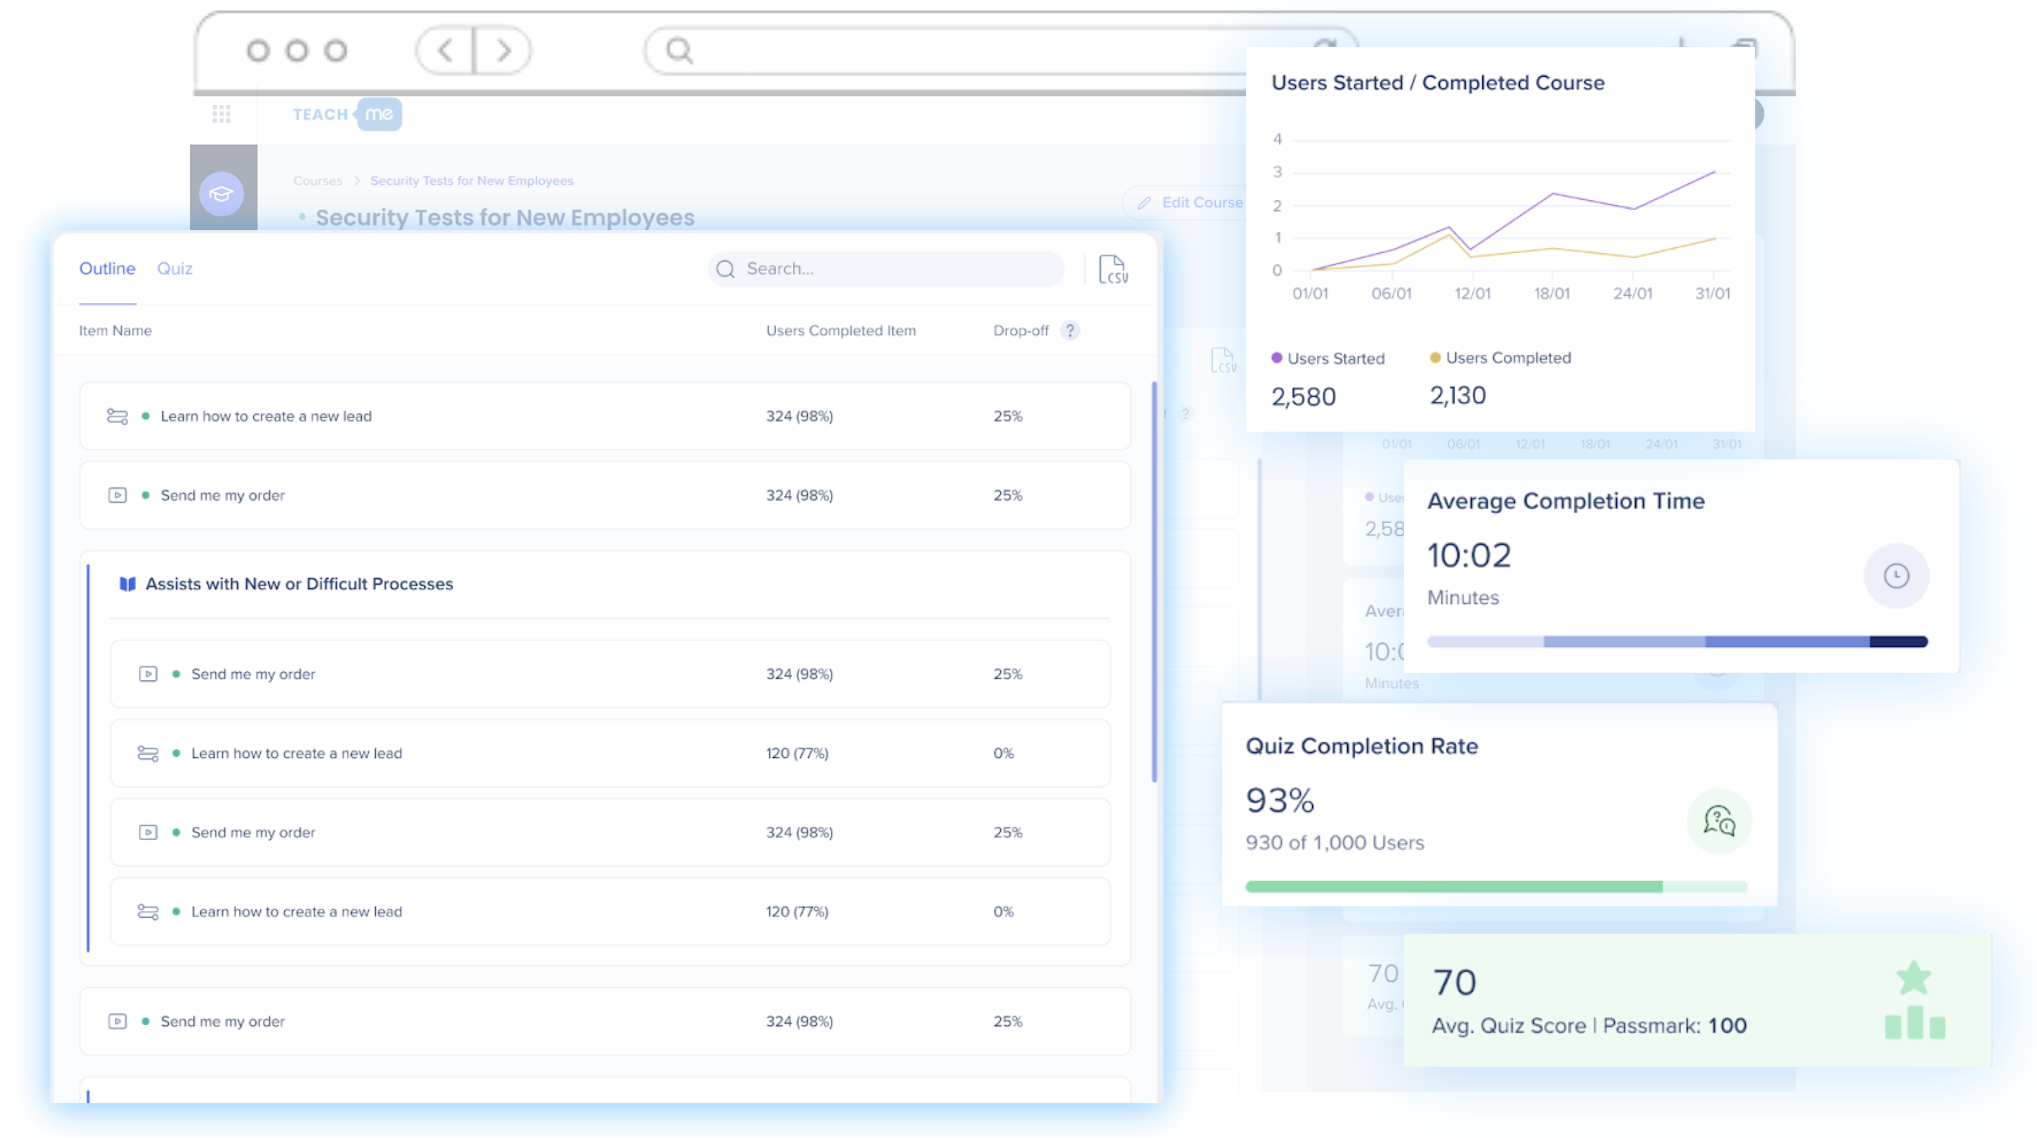
Course Analytics
Course Analytics are very similar to the Overview Analytics, just with a few changes:
- All data is relevant to the selected course only.
- Average quiz score is displayed.
- Course outline tab displays detailed analytics on the learner's progress.
- Quiz tab displays analytics for each question.
For the sake of brevity, let's take a look at only the new analytics:
Outline Tab
The outline tab displays analytics for each item within that course.
Users Completed Item
If the item is:
- Smart Walk-Thru - You will see the number of users who completed the Smart Walk-Thru and the percentage of users who completed it out of the users who started.
- Resources (articles and videos) - You will see the number of users who started the item.
Drop-off
This column will only be populated if you have enforced the order of the course outline.
If the order is enforced you will see the following data for each item:
- Smart Walk-Thrus - The number of users who haven't completed the SWT and percentage of users who started the SWT.
- Resources - Since we can't actually track if a user has completed a resource, this number will always show 100%.
Quiz Tab
Quiz analytics gives you a deep dive on how your users are managing on each quiz.
To access quiz analytics, click the relevant course from the Courses page then navigate to the Quiz tab.
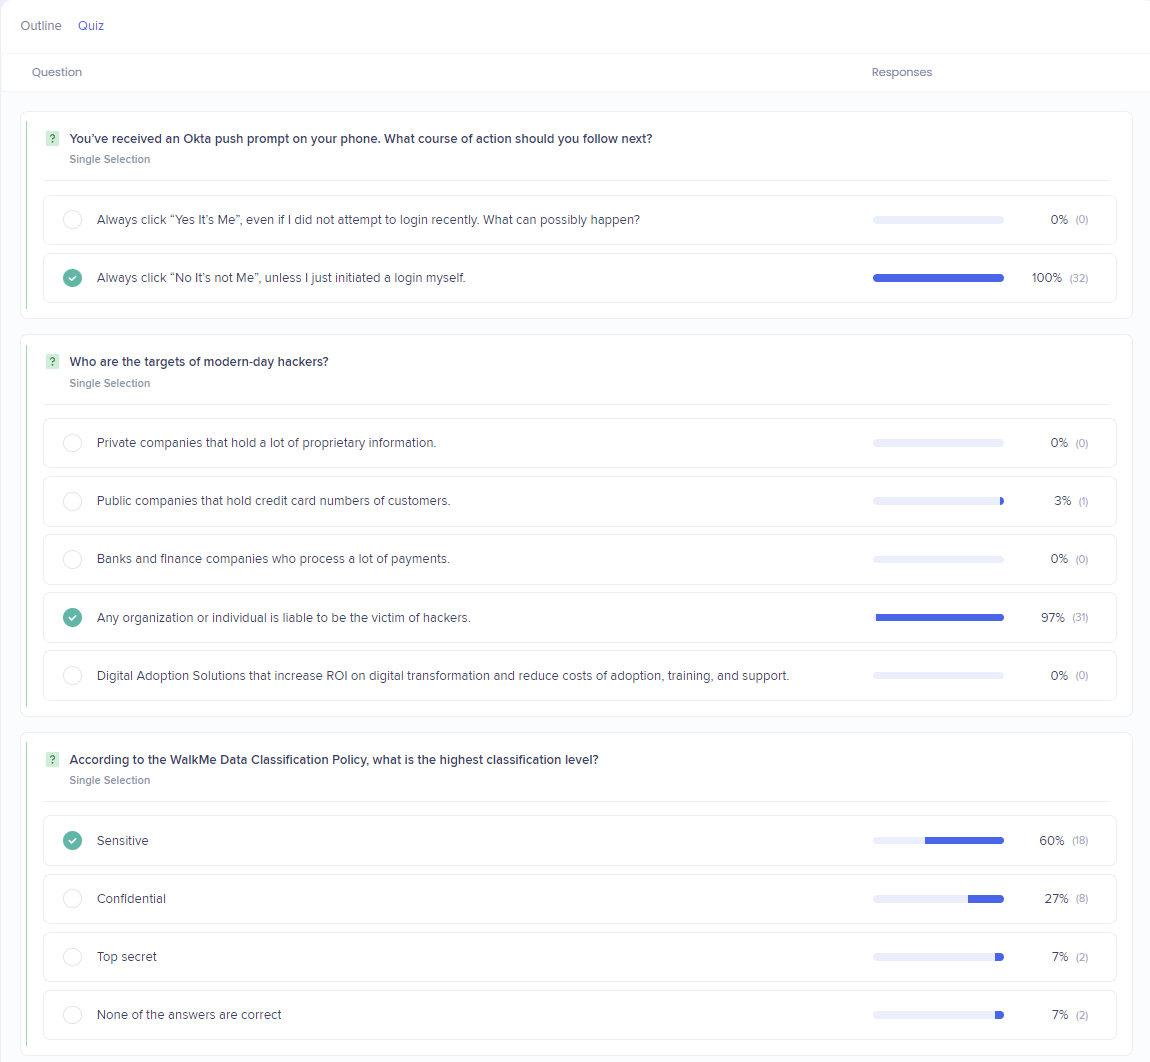
The Quiz Tab displays the following analytics for this course:
Question & Responses: Here you will see each question within the quiz and all the responses associated with that question.
- The percentage next to the answer is the percent of the total number of users who took the quiz that selected this answer on their most recent submission within that date range.
- The number (#) next to the percentage is the number of unique users who selected the answer on their most recent submission within that date range.
Updating questions and answers - If the text of an answer is updated or changed, the date range you select will display the most recent change if we select a date range before that specific day, we would still see the most recent version of the question's text. The question ID does not change if we change text.
User Analytics
The User Analytics is a great way to get insight on each individual user's progress. The User Analytics page displays:
- Which course the user has taken.
- When they started, completed, how long it took them to complete the course.
- The user's quiz result.
- How many times the user took the quiz.
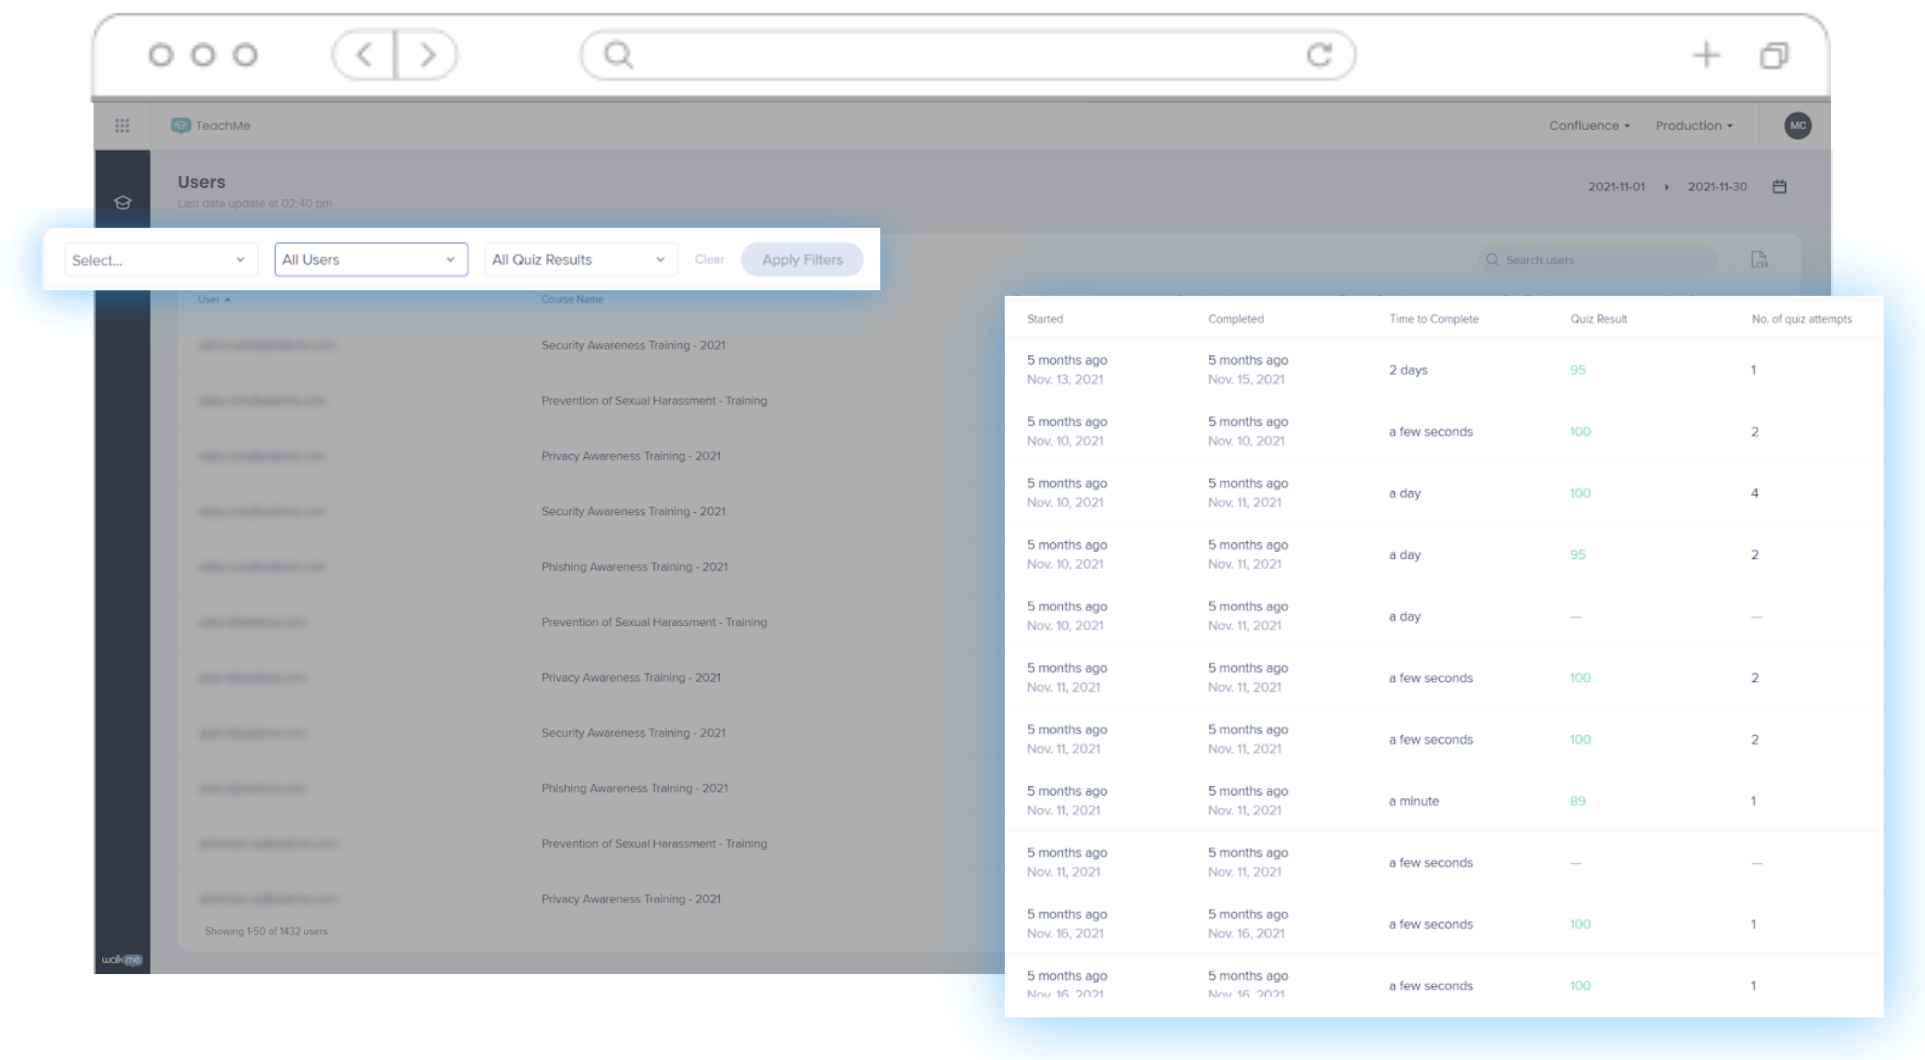
User Analytics can also be filtered via time, environment, or system (as above) as well as the following:
Course
Select the course for which you'd like to view user analytics.
User Progress
Filter based on user completion or incompletion.
Quiz Results
Filter between users who passed or did not pass a quiz.
User Analytics Table
Let's take a look at each column of the User Analytics table:
User: The UUID of the user as defined when setting up the system.
Course Name: The name of the course that this users has started
Started: The most recent start date of any Smart Walk-Thru or Resource that is assigned to that course, even if started outside TeachMe, within the selected date range.
Completed: The date the user completed the course.
Time to Complete: How long it took the user to complete the course.
Quiz Result: Displays the score of the most recent quiz that was submitted by that user within the selected date range.
- If this course doesn't have a quiz OR the user hasn't completed it, you will see “⊘ Did not submit.”
No. of Quiz Attempts: The total number of times this user submitted the quiz for a specific course and received a Quiz Score, within the selected date range.
TeachMe vs Insights analytics
Why am I seeing different data on Insights about TeachMe courses?
TeachMe logs the first occurrence of user activity. Meaning, TeachMe keeps the first time a user starts and completes a course or quiz for analytics.
Insights tracks all user activity, including latest user activity. If a user decides to revisit a course or quiz, Insights will track it. TeachMe does not track this activity.
Typically, in terms of learning and development, the most valuable data is the data from the user's first interaction with the course, which indicates whether or not a user understood the content, or if further development is needed.
It is not recommended to update a course and request users to retake it. If a course needs to be changed, a new course should be created instead. This will maintain the integrity of the data in relation to the course content.