Brief Overview
Common business workflows require employees from multiple functions and departments to follow processes that span across multiple applications. In order to make those processes more efficient and effective, organizations need to identify problem areas along that workflow.
Flow Analytics changes how organizations approach digital adoption by focusing on the business issues and outcomes at hand, allowing the ability to analyze and address friction across workflows.
By using Flow Analytics, enterprises can map, analyze, and optimize their business processes across multiple applications and multiple users. You can uncover the entire journey of users, with or without WalkMe content.
Use Cases
- Sales - Measure and influence sales onboarding, best practices (sales modeling)
- HR - Measure and influence hiring, onboarding, employee experience processes, reduce time to hire a new candidate
- Finance - Measure and influence expense management, financial reporting
- IT - Measure and influence internal support processes
Get to Know & Use
Flow Analytics is a powerful tool that allows you to visualize and optimize user journeys by tracking the progression of individual users through a series of defined steps.
Flows focus on the sequence of user actions rather than isolated events. Each step in a flow must be completed in order for the user to progress to the next step. If a user does not complete a step, they will not be recorded for subsequent steps, and no data will be shown for that user beyond the incomplete step.
This sequential tracking ensures that you can accurately identify where users may encounter obstacles in their journey, allowing you to address these issues effectively. With this understanding, you can now proceed to set up your flows, ensuring each step is clearly defined and aligned with your objectives.
How to create a flow
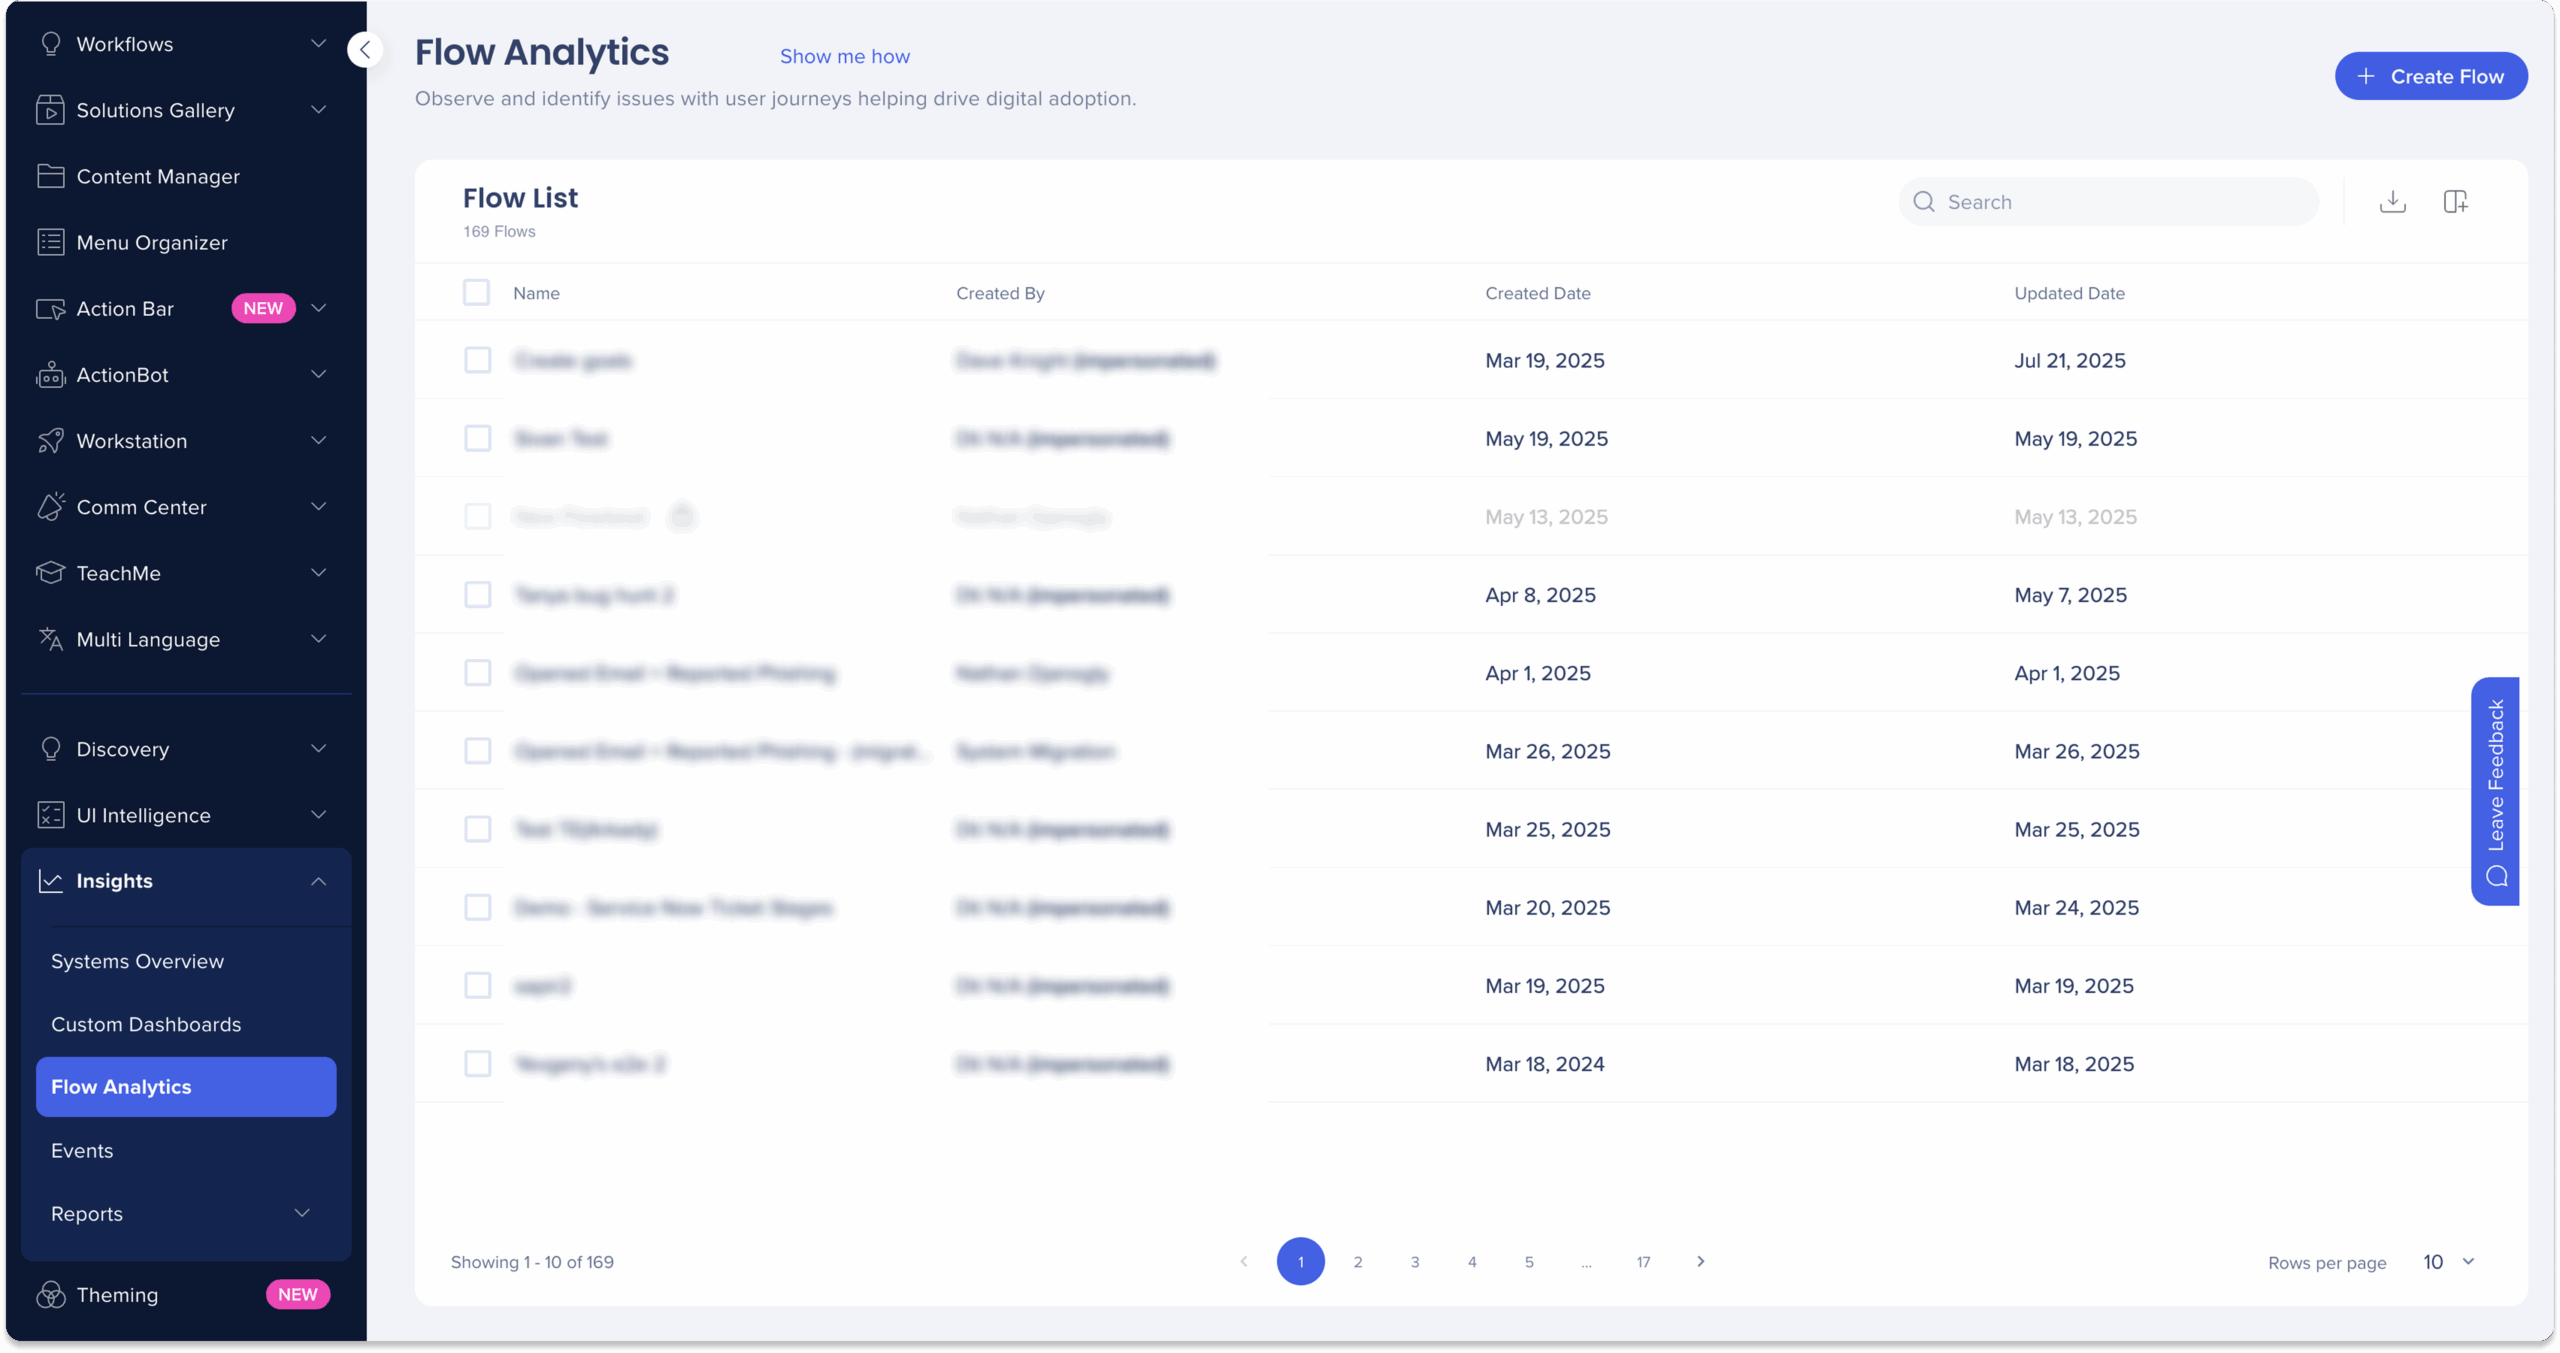
-
Navigate to the Flow Analytics page in the console:
-
US Database: WalkMe Console
-
EU Database: WalkMe Console
-
Click + Create Flow
3. Choose whether you want to create a Funnel or Paths by clicking the Funnel/Paths toggle
-
-
Enter a name and description (optional) in the top left-hand side of the page
-
Click the plus button + to add your first step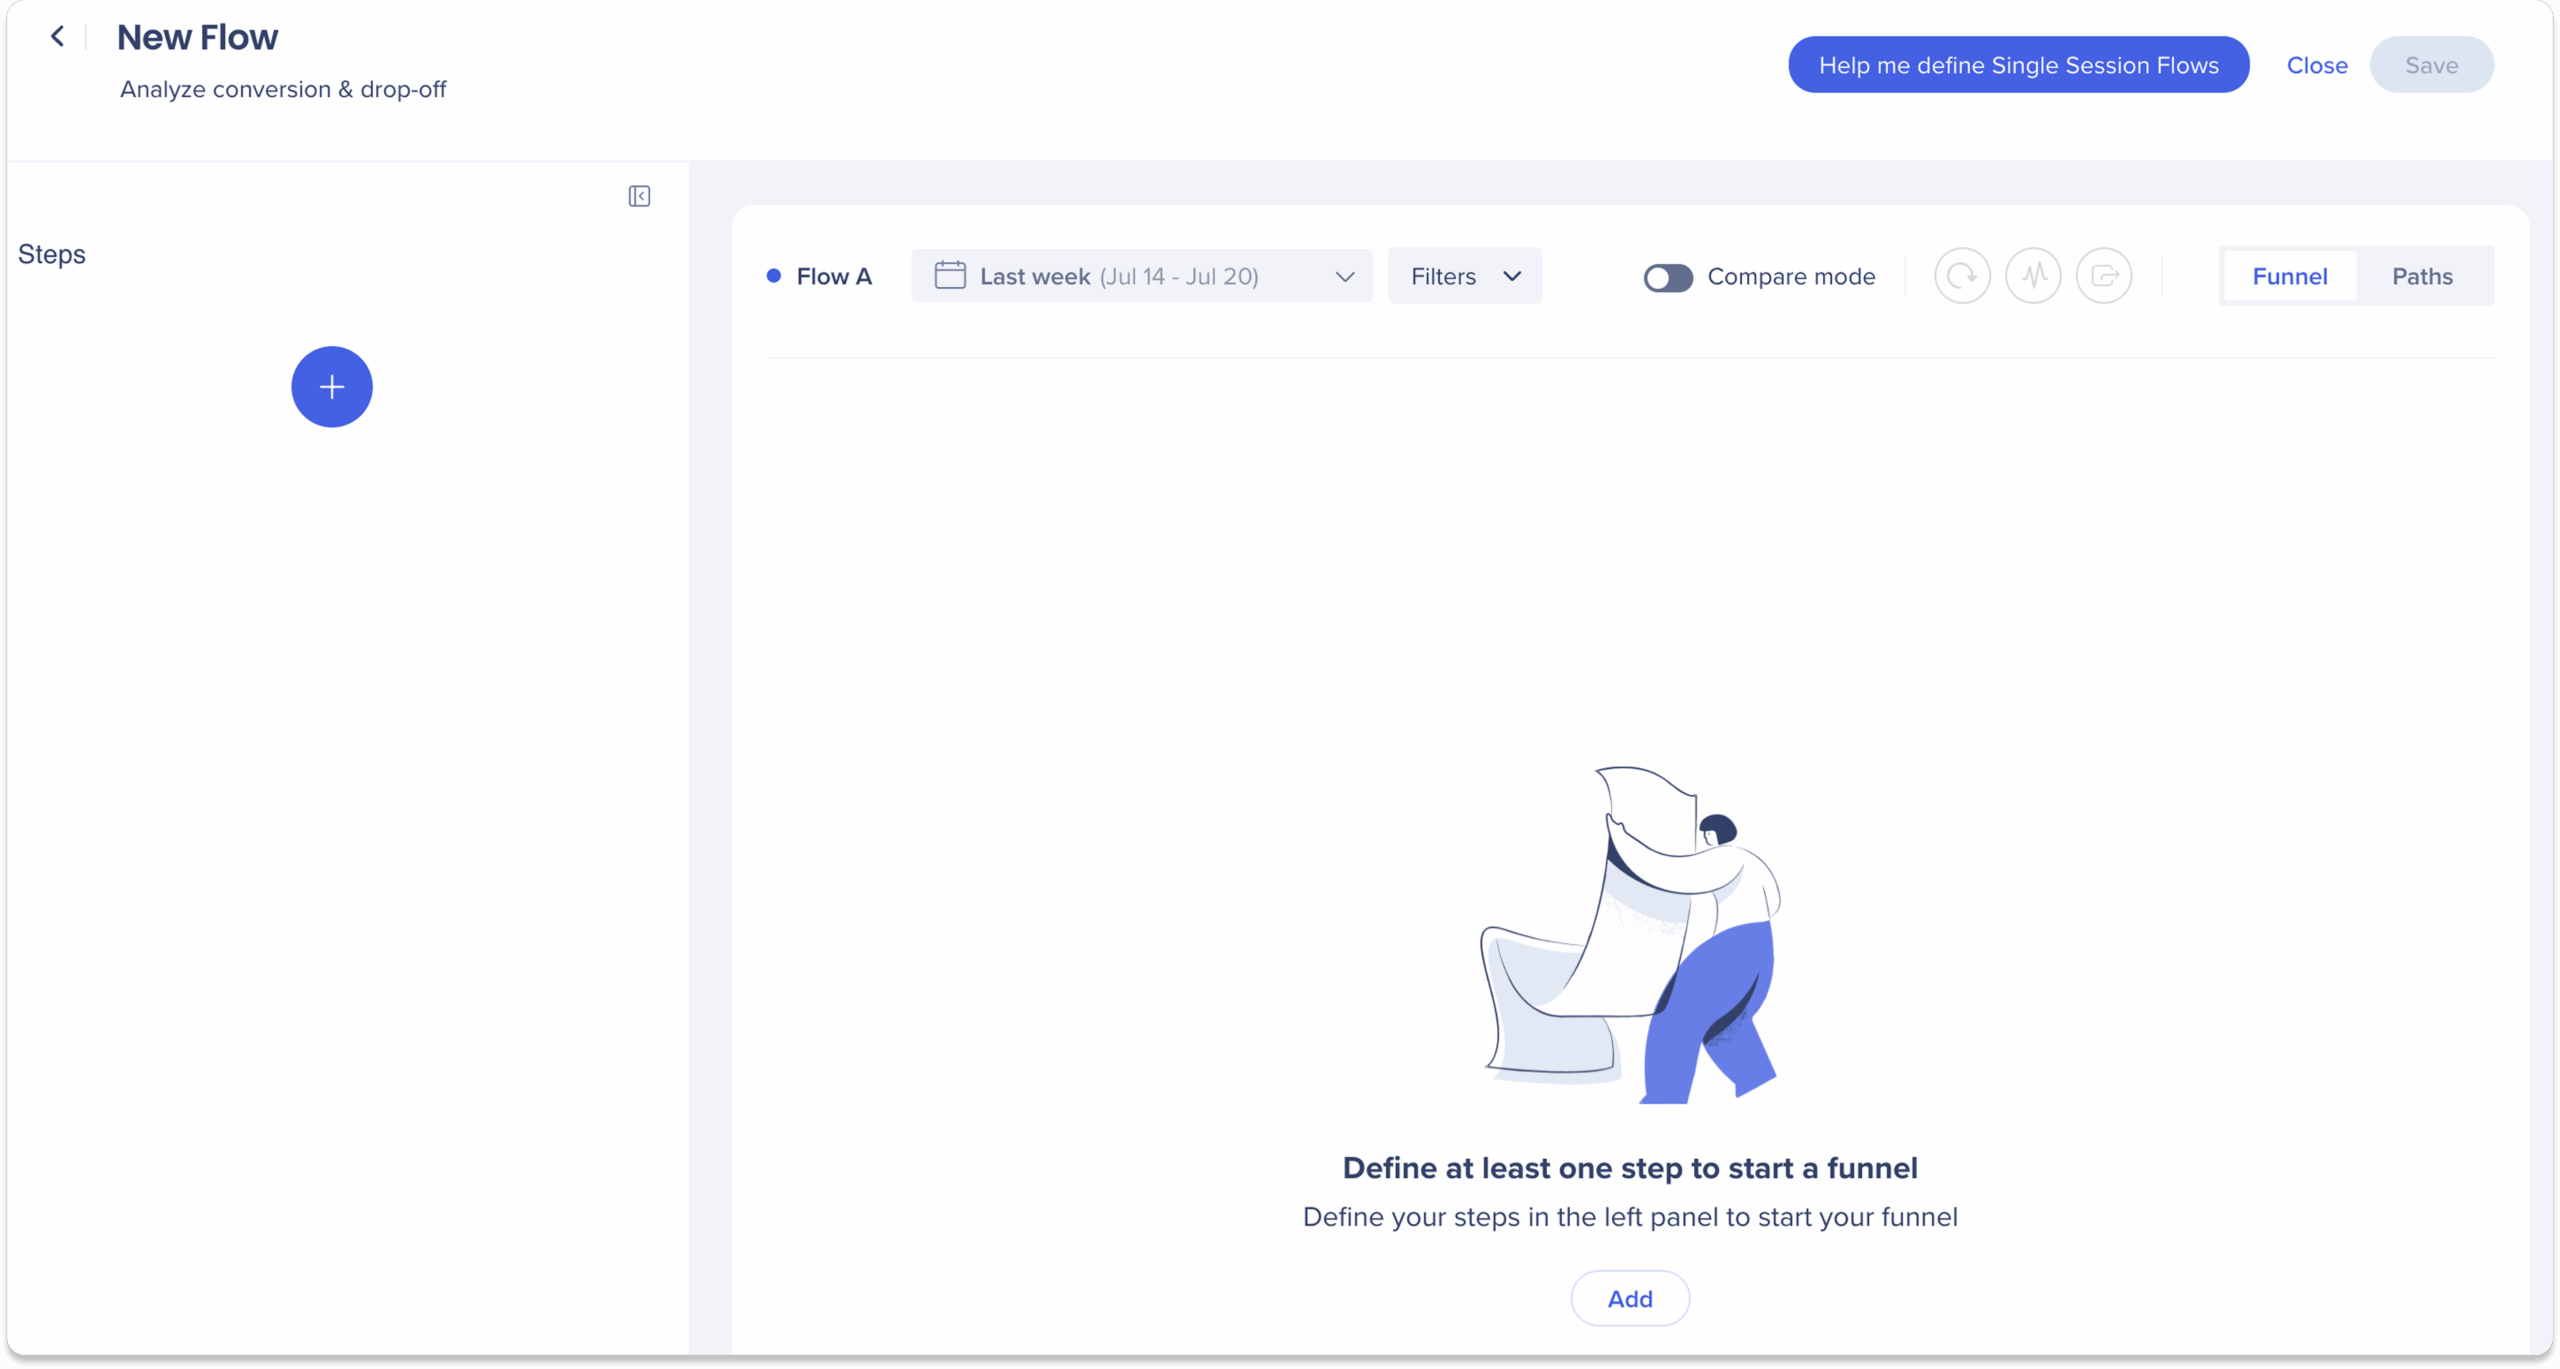
-
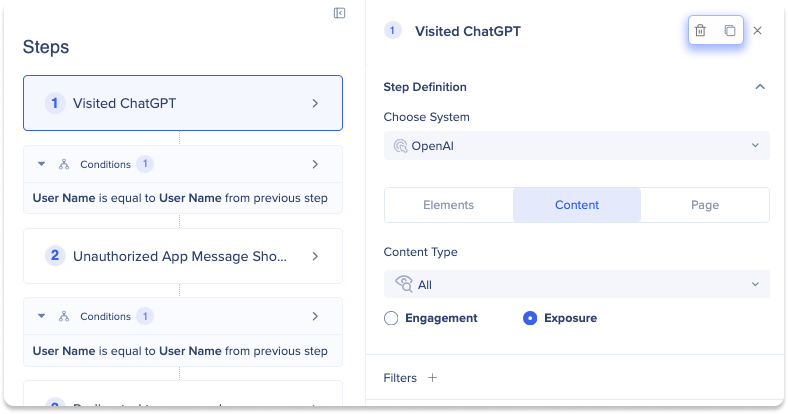
Enter a name for your step in the Untitled Step field
-
Select a system from the Choose System dropdown
-
Select an environment from the Environment dropdown
-
Select one of the following step definition setups:
-
One-Time Setup: Define a one-time setup specifically for this flow, ideal for flow steps that are not intended for reuse in Insights
-
Includes data on WalkMe content items or page visits
-
Events: Select a Tracked Event or Engaged Element from your events list
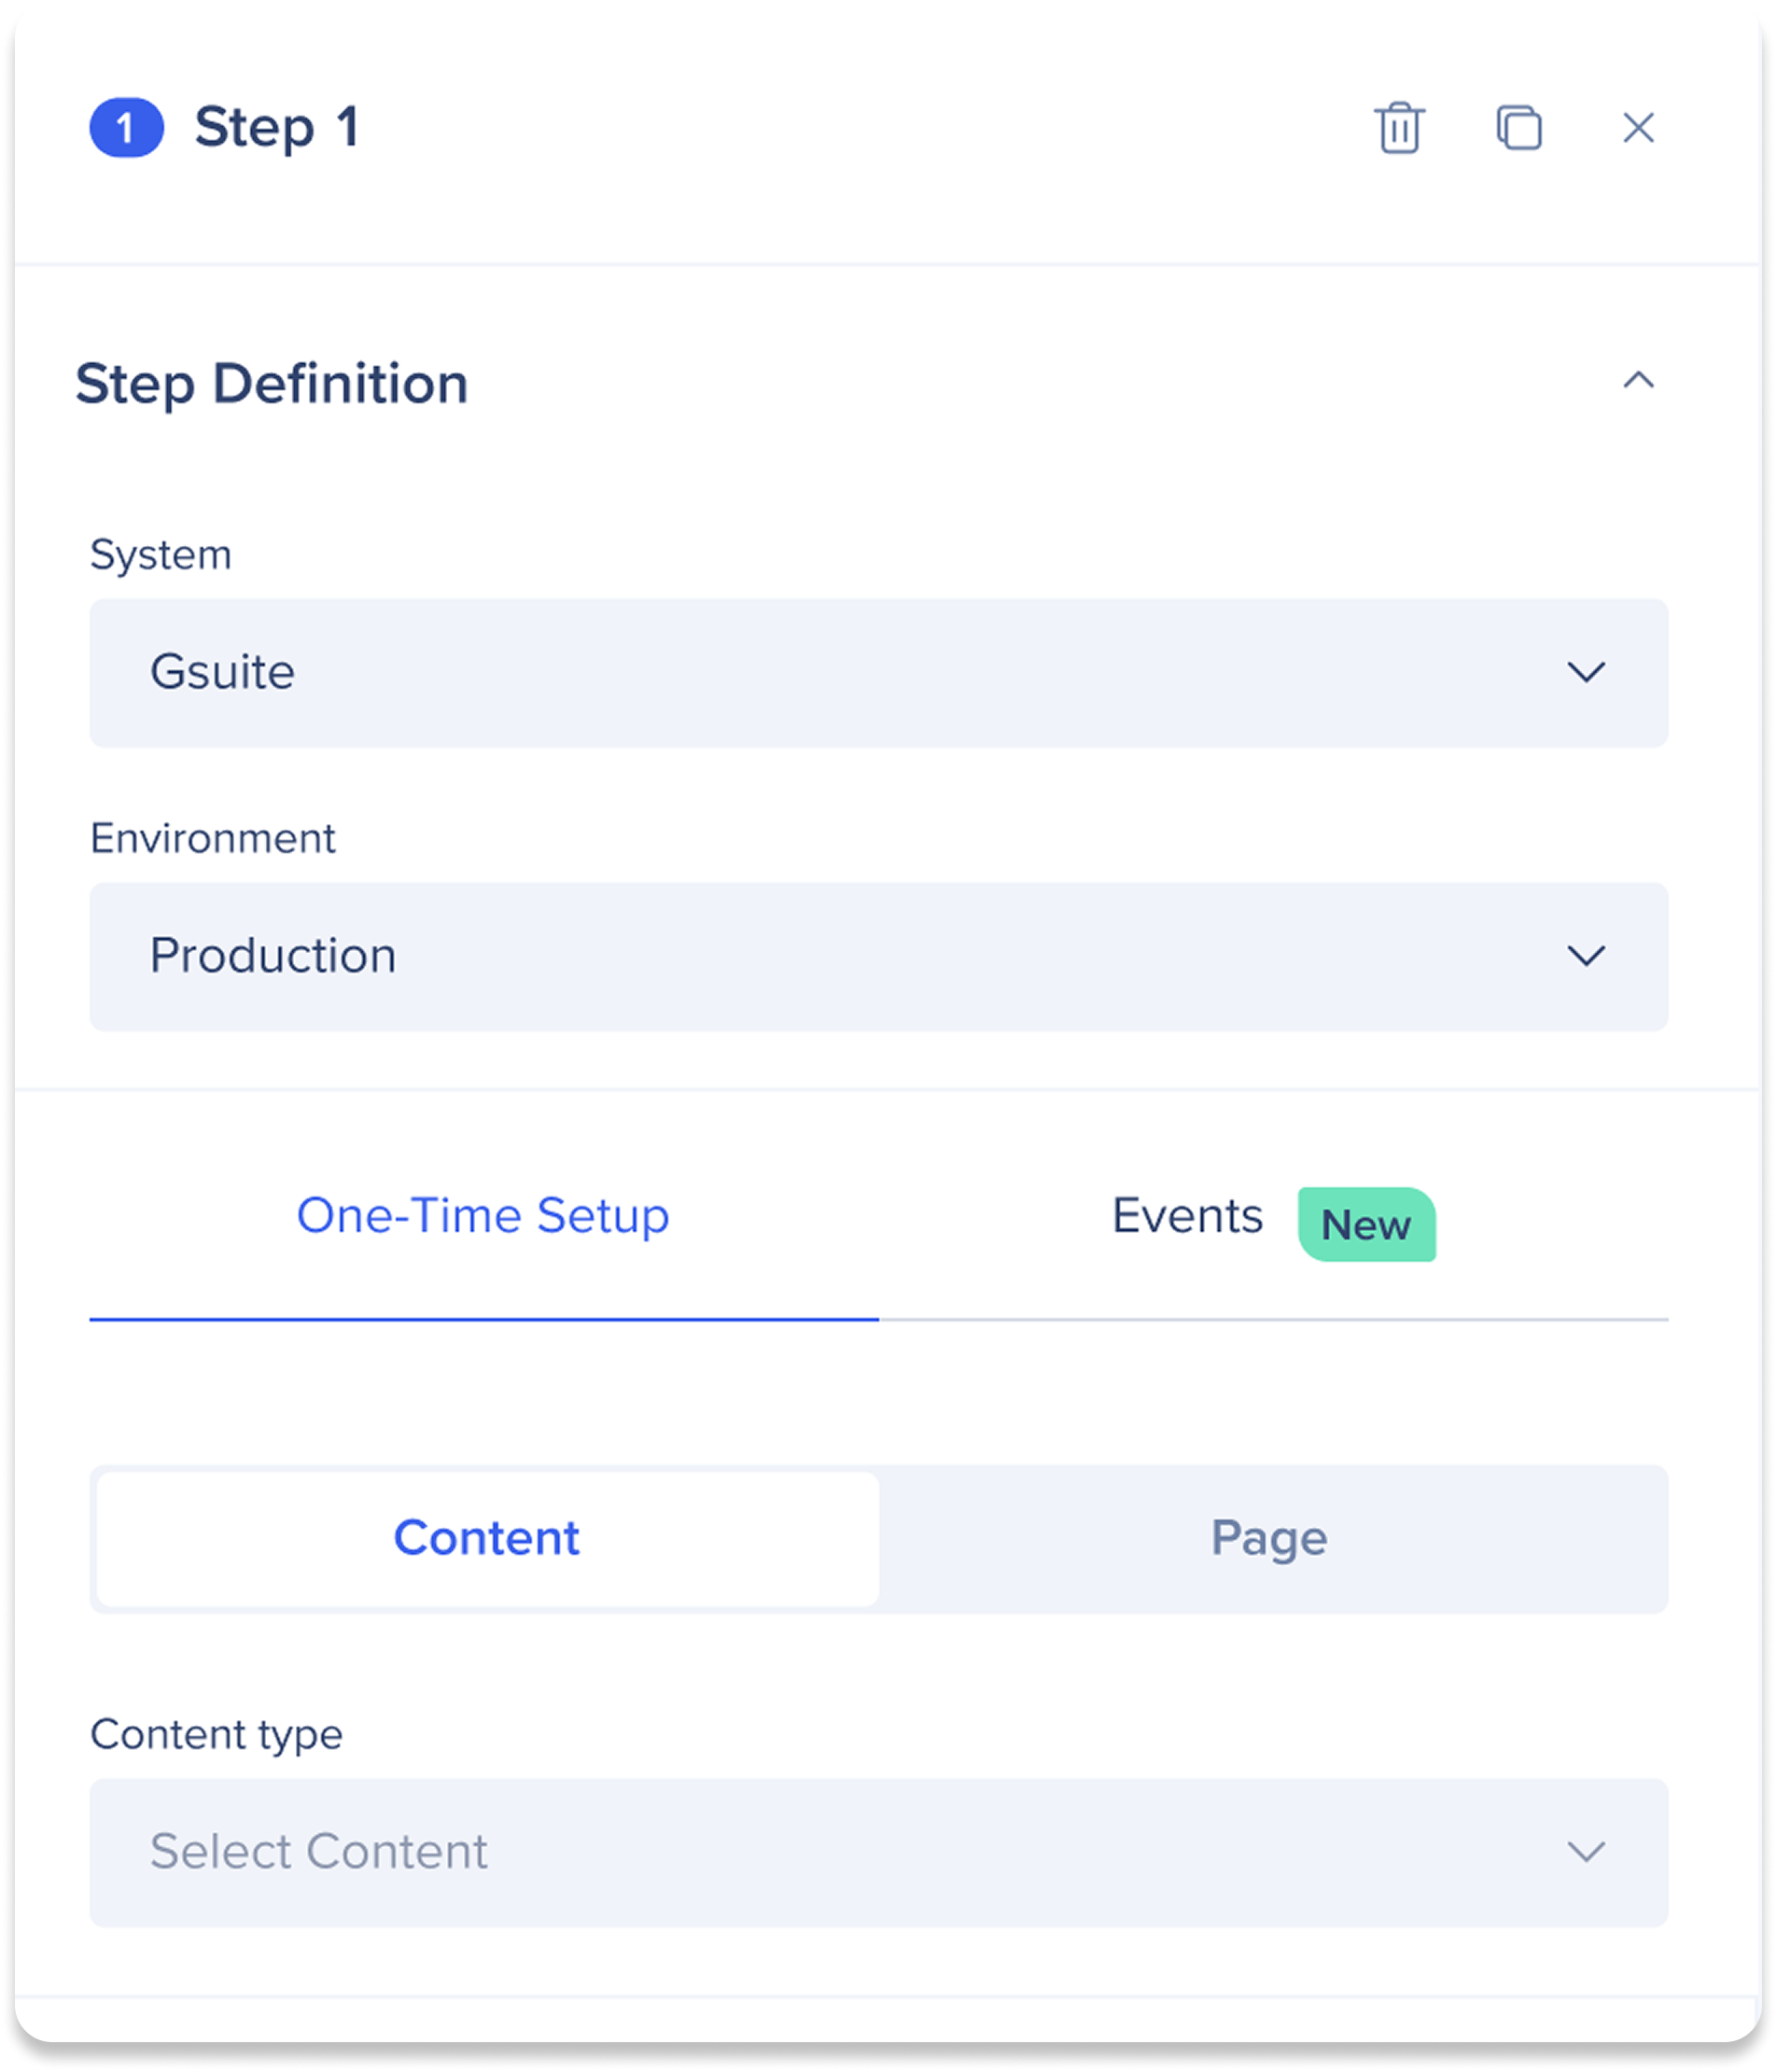
One-Time Setup
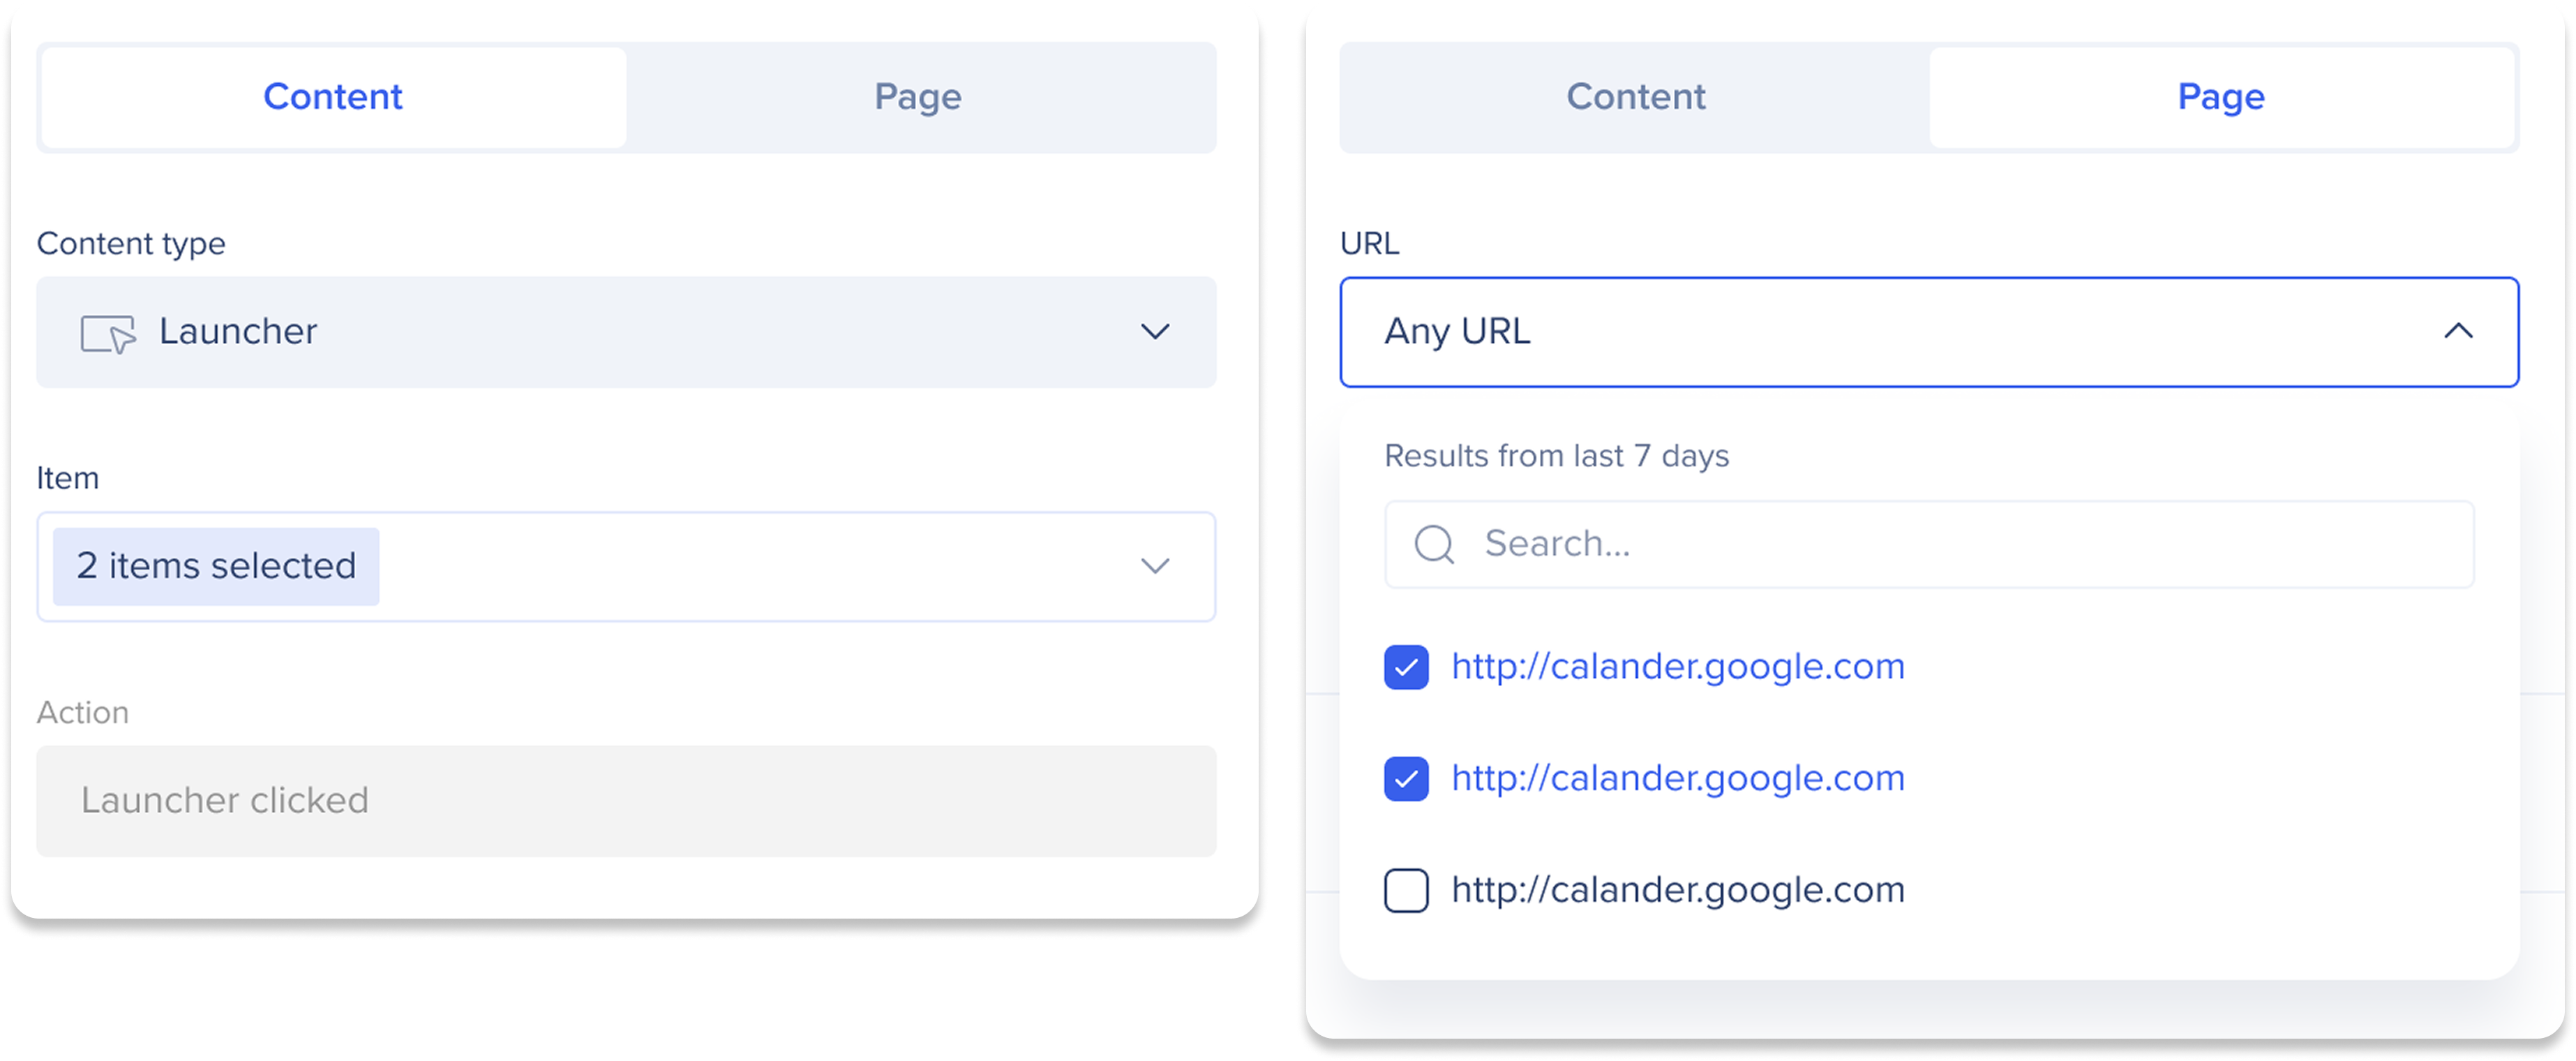
Select Content or Page to decide where the step action will occur:
-
Content: Existing WalkMe content (Launcher, Smart Walk-Thru, etc.)
-
Page: Page URLs visited by users
Note
To collect page data, which may contain PII (personally identifiable information), you need to ensure that the Collect page view setting is enabled in the WalkMe Insights environment settings.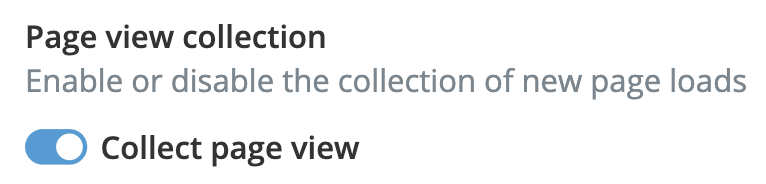
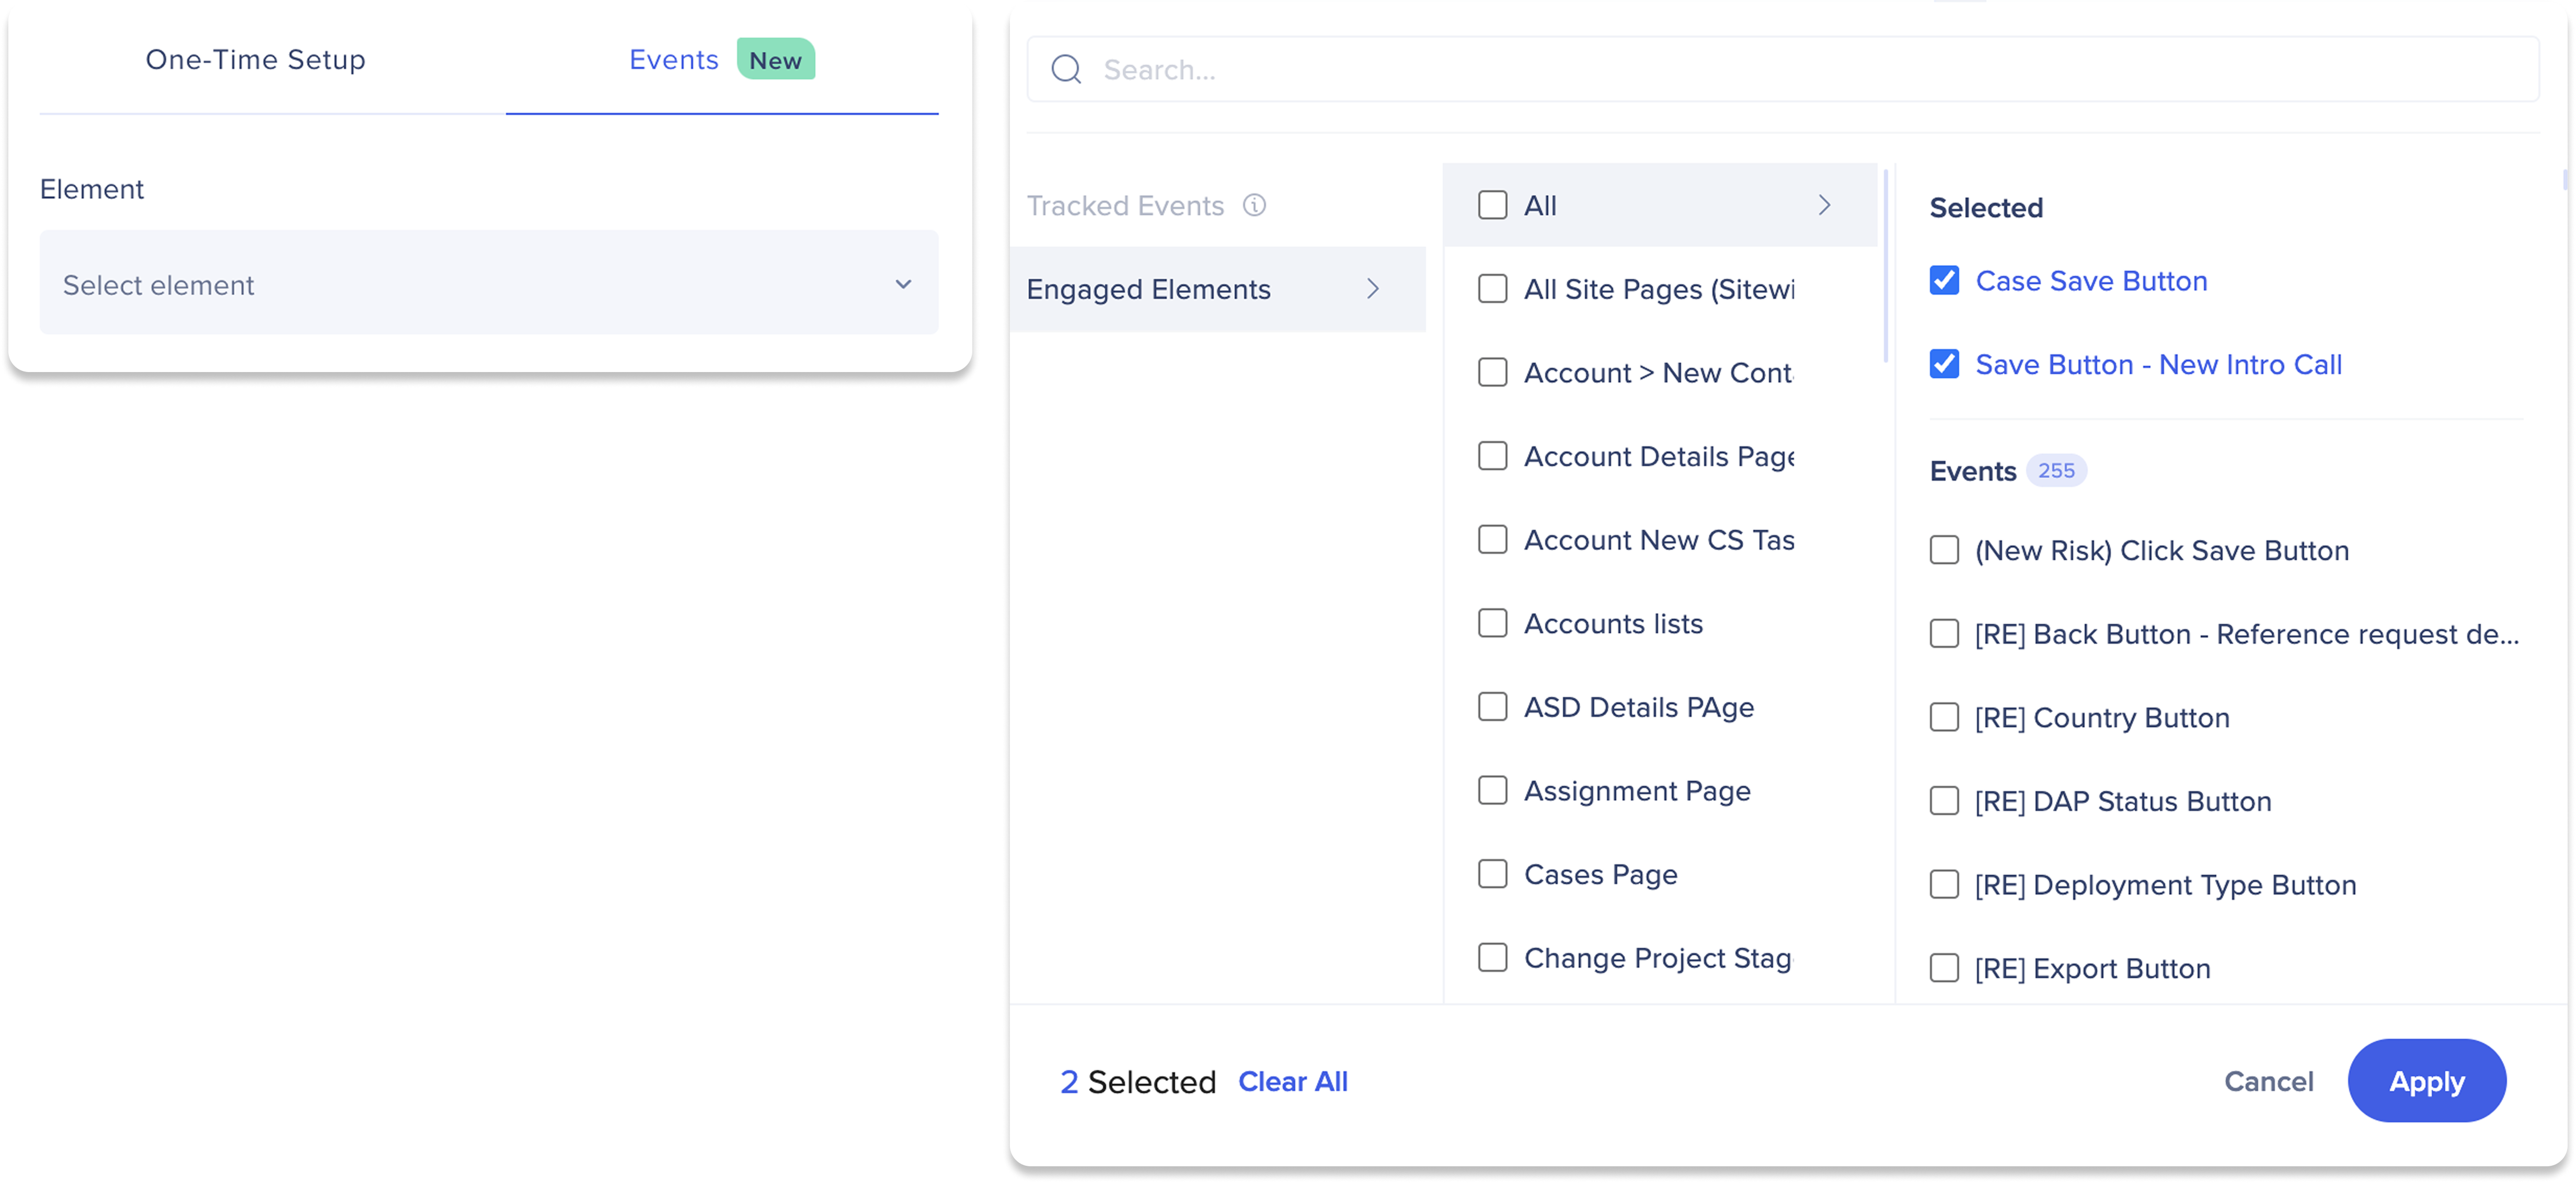
Events
Click Events to select a Tracked Event or Engaged Element from your events list for this step.
-
Click the Select element dropdown
-
Select either a Tracked Event or Engaged Elements
-
Click Apply
Notes
-
You can only select one Tracked Event at a time for performance reasons. To compare multiple user journey paths, please use Engaged Elements
-
You can only select either a Tracked Event or an Engaged Element, not both
-
If needed, add filters to your step
-
Click the Filters Plus button +
-
Select a property from category or WalkMe Content to filter by
-
Choose a rule to filter by (ex: is equal, is not equal)
-
Select values
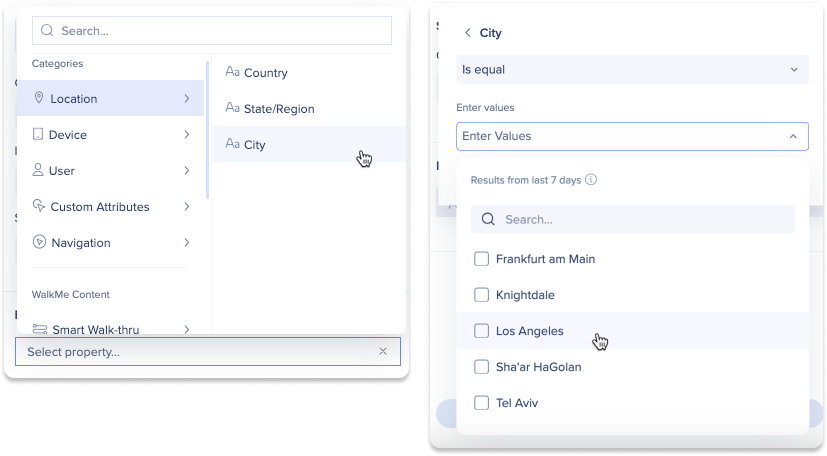
Note
To enhance performance, some filter fields are populated with only the last 7 days worth of data. If a customer doesn't see the option they expected they can enter it manually using Specify.
11. Click Calculate to add it to your funnel/path
-
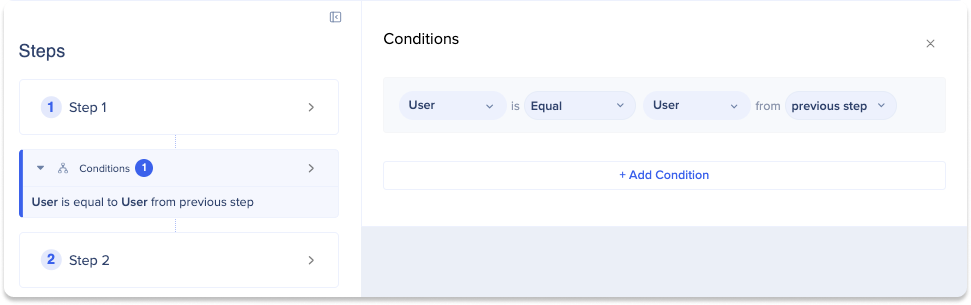
Once you add more than one step, you can apply conditions, or constraints according to which data is calculated, you would like between your steps
-
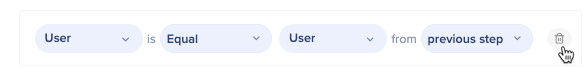
Click the right arrow to add a conditions between your steps
-
Click + Add Condition to add multiple conditions
Notes
- Use Duration to filter flow results by time spent on a step. To use it, first select Timing, then Duration. It can only be used as an “and” condition
- Hover over a condition and click the trash icon to delete a condition
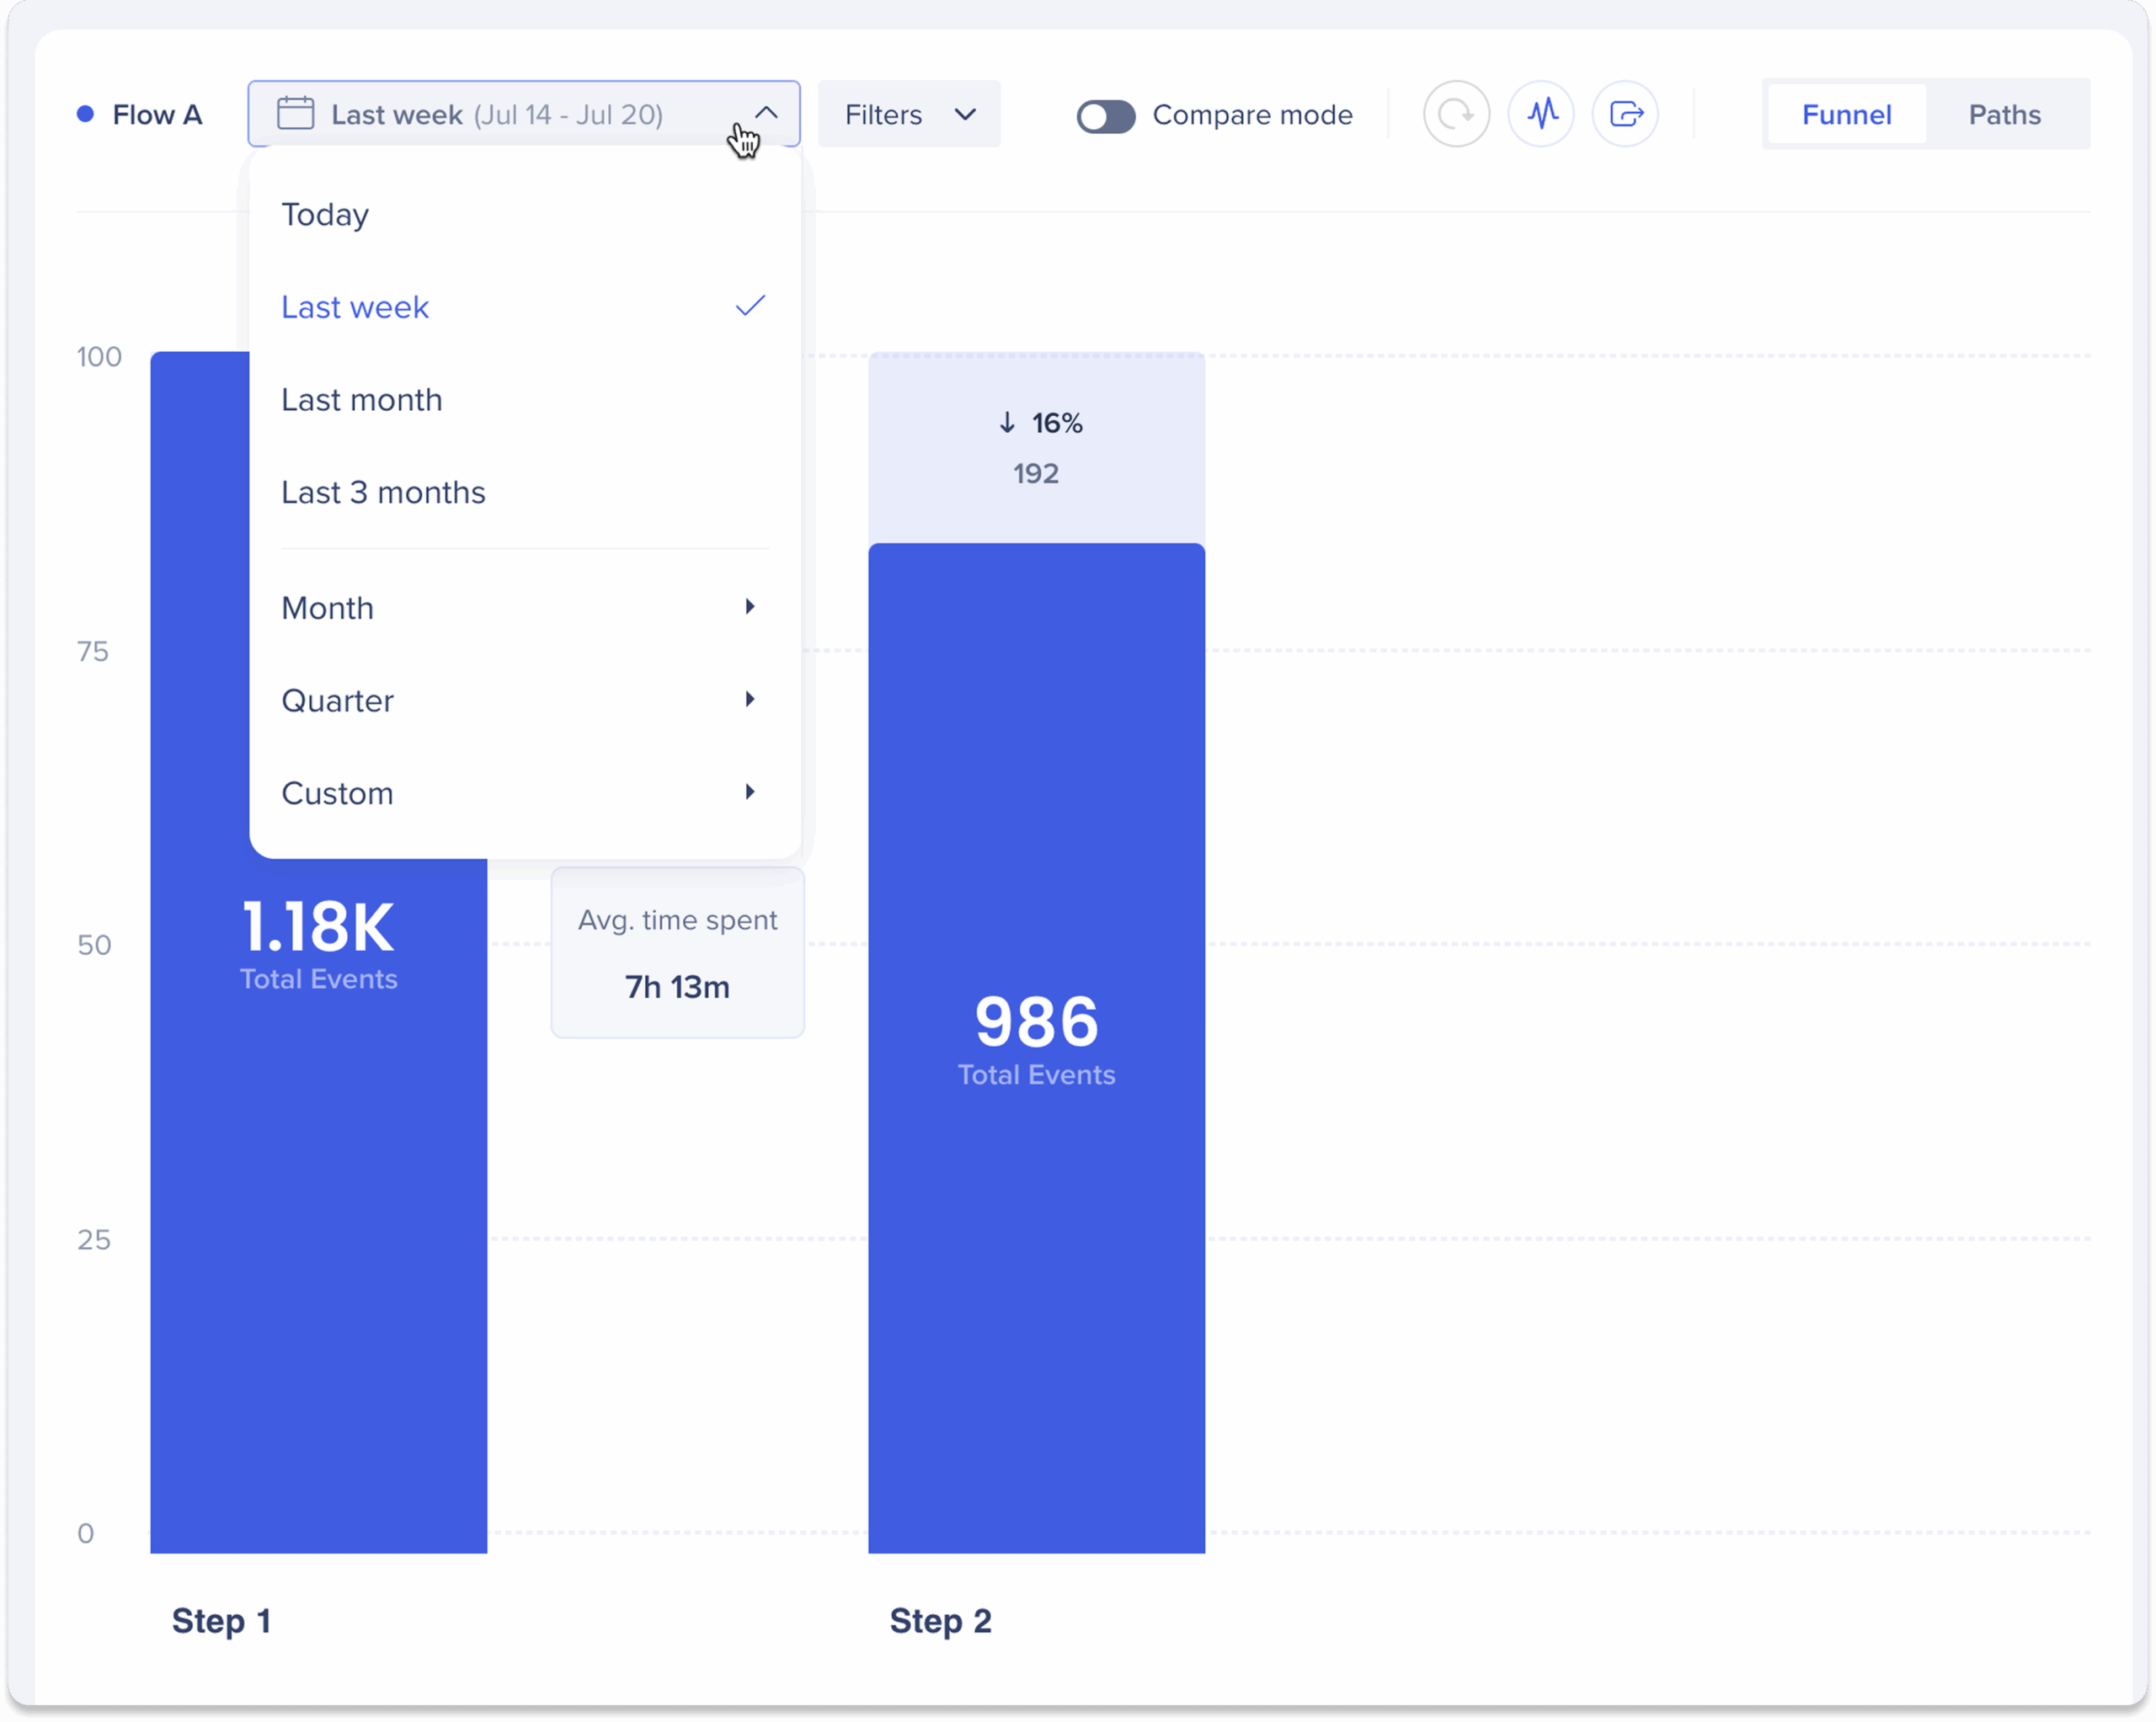
15. Once you have defined a step, you will see your flow calculate
Tips
-
Data Viewing Options: You can view data for Today, Last 7 days, Last 30 days, Last 60 days, Las, and Last 90 days, or create a custom viewing duration
- Time Spent: Between each step you will see an indication of the time spent
- Only available for the funnel view
-
Click Save to save your work
Delete/Duplicate steps
How to delete a step
-
Select the step you'd like to delete
-
Click the trash icon
How to duplicate a step
-
Select the step you'd like to duplicate
-
Click the duplicate icon
Analyze Your Flows
To dive deeper into your events, you can utilize the Analytics Menus. These menu offers different options that can help you identify the most and least successful paths and analyze completion rates and user paths. The options are as follows:
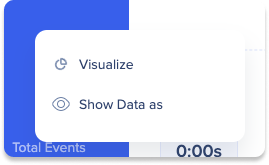
On Funnel View
-
Visualize: This option enables you to view and analyze your data in a deeper, more detailed way
-
Show Data as: You can use this option to select a specific property and view data according to that property
On Paths View
-
Visualize: This option enables you to view and analyze your data in a deeper, more detailed way
-
Split by: This options allows you to split a data by a property in the Paths view
- Regroup: The options allows you to regroup split data back together
-
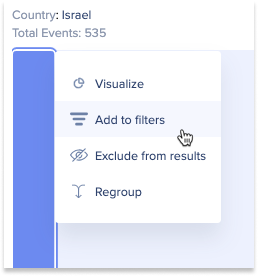
Add to filters: After using the Split by function, this option allows you to select a segment in the split and make that segment the be only result shown in the chart
-
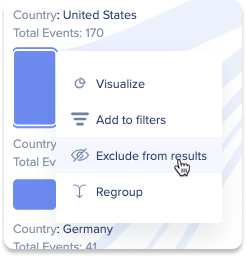
Exclude from results: After using the Split by function, this option allows you to select a segment in the split to exclude from the results shown in the chart
-
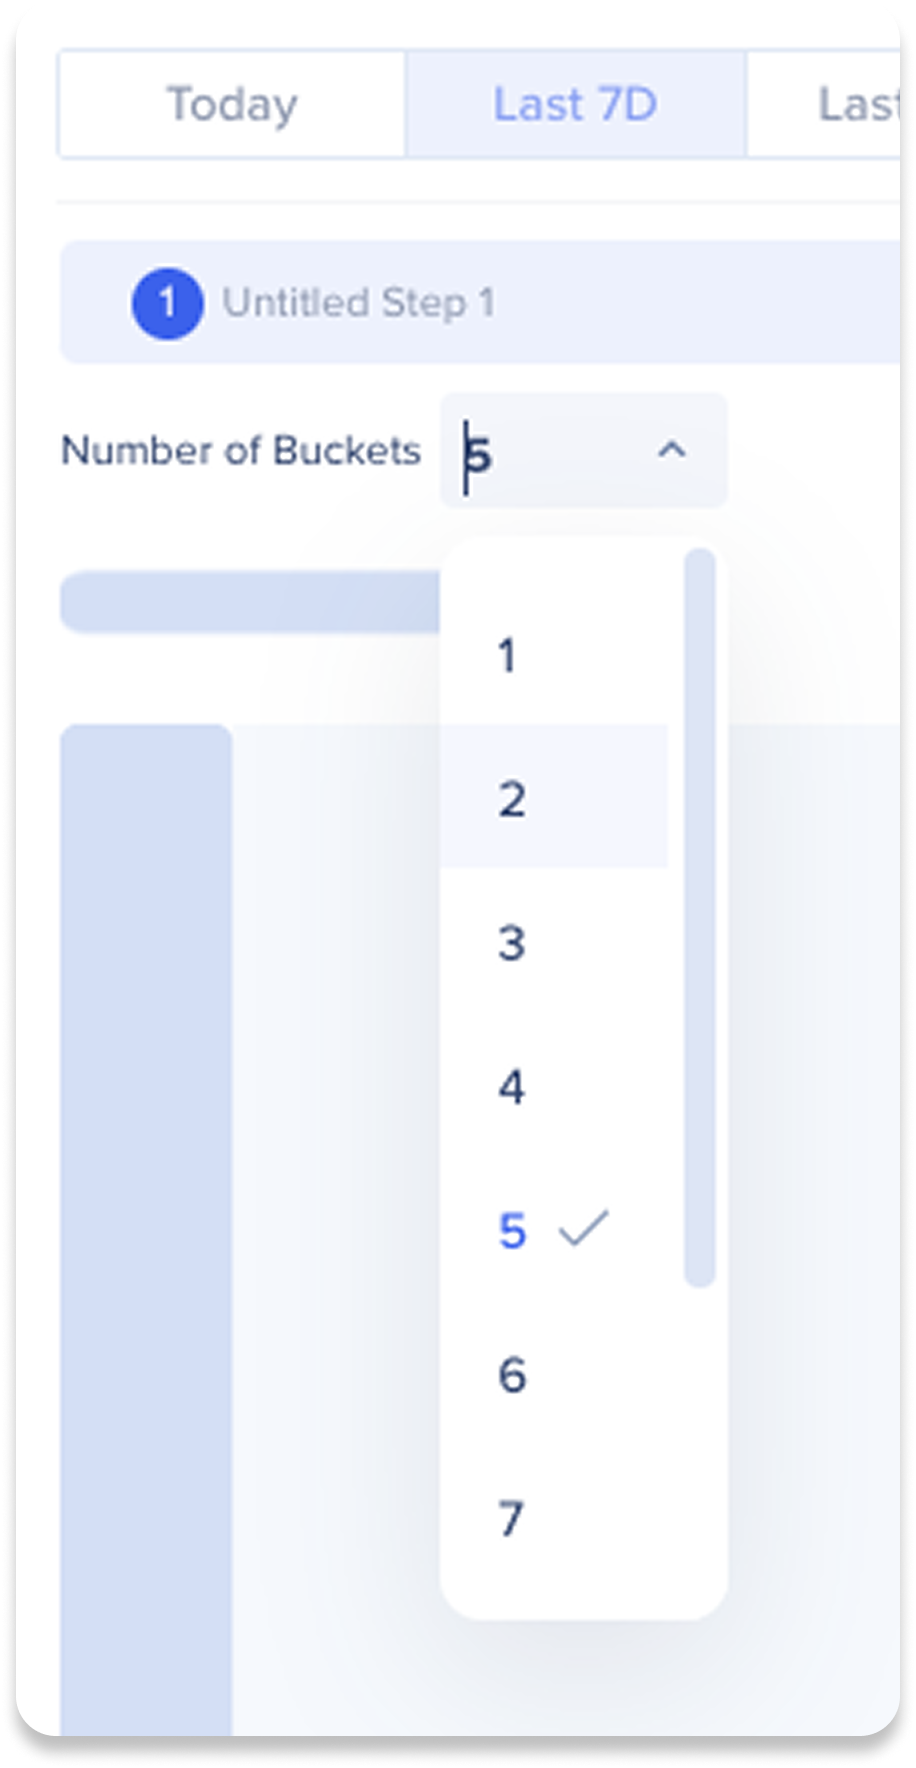
Number of buckets: This option allows you to choose how many groups you would like to view when using the Split By function (not in the click bar menu, this appears as a dropdown over the event bars)
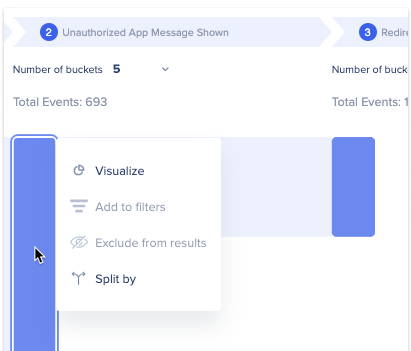
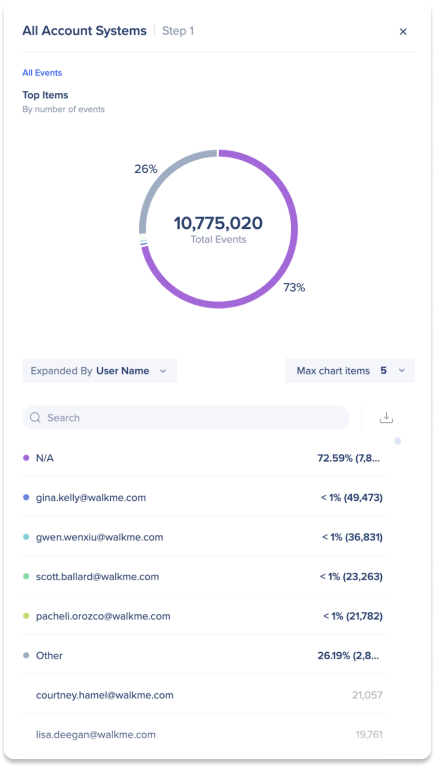
Visualize
Visualize allows you to gain a deeper understanding of your data by presenting it in an easily digestible format. With Visualize, you can view your data in graph form and apply filters to display only the data you need to see.
-
Click the bar in the chart area that relates to the step
-
Select Visualize
-
A side panel will open
-
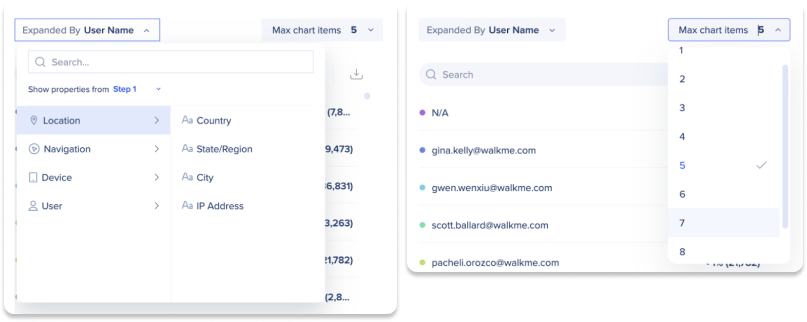
Use the dropdown to view specific data. Here are your options:
-
Expand by a different property (ex: Location, Device etc..)
-
Change number of chart items
-
Click a specific item and deep dive further
Show data as
Show data as enables you to select a particular property and analyze your data based on that property. This means you can analyze your data not just by events, but also by other factors such as "Country" or "Browser". This can be particularly helpful when trying to identify specific issues within an event, rather than analyzing the event as a whole.
Click Apply to see data for the bar you selected, or Apply to All to see for the entire Workflow.
-
Click the bar in the chart area that relates to the step
-
Select Show data as
-
Select the property you would like to show
- Click Apply to see data for the bar you selected, or Apply to All to see for the entire Workflow
-
Now events will be grouped according to a unique count of that property
Example: If you had 10k events from three different countries and you want to display the data by country, the count will show as three
Tips
-
When using Show data as, you no longer will see a drop in data, but the relationships, conditions, and filters that are still present
-
To clear Show data as and go back to events view
-
Click a bar in the chart
-
Click Show data as
-
Click clear
Split by
Split by enables you to segment data based on a property in the Paths view. This allows you to analyze data for each step based on additional factors such as "Country" or "Browser" ., and view the results into under that step.
-
Select Paths Toggle
-
Click the bar in the chart area that relates to the step you want to split
-
Select Split by
-
Choose which property you would like to split by
To undo a split
-
Click any split part of the bar
-
Select Regroup
Add to filters
After using the Split by function, this option allows you to select a segment in the split and make that segment the be only result shown in the chart.
-
Select Paths Toggle
-
Click the bar in the chart area that relates to the step you want to add to filters
-
Select Add to filters
Exclude from results
After using the Split by function, this option allows you to select a segment in the split to exclude from the results shown in the chart.
-
Select Paths Toggle
-
Click the bar in the chart area that relates to the step you want to exclude from results
-
Select Exclude from results
Number of buckets
This option allows you to choose how many groups you would like to view when using the Split By function (not in the click bar menu, this appears as a dropdown over the event bars)
-
Select Paths Toggle
-
Click the Number of buckets dropdown
-
Select the number of buckets you would like to see
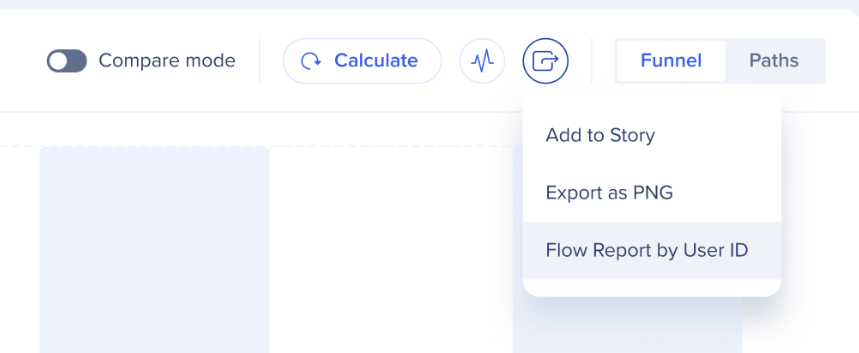
Flow Reports
Export comprehensive, user-level flow data as a report for deeper analysis, seeing each step, duration, and completion across the entire funnel.
How it works
-
Click the Export icon
-
Choose Flow Report by User ID
-
The report will appear in the Exports & Subscriptions page in Insights
Notes
-
-
The report shows data by User ID
-
Reports are exported per individual flow. Exporting multiple flows in a single report is not supported
-
In comparison mode, both flows (A & B) are included
-
Users cannot subscribe to this report or use it with outgoing integrations
-
The report can be downloaded even before the UI finishes loading all the data
How We Calculate Funnels
Steps must be completed in order
- Actions must be completed in the specified order to be counted in the funnel
- Example: If a user completes Step 2 without having completed Step 1, Step 2 will not be counted
- Monday: User completes Step 2
- Tuesday: User completes Step 1
- Wednesday: User completes Step 3
- Result: No data would be shown because they don't follow the required order
We don't count actions per session
- Example: if a user completes the correct sequence in different sessions they are still counted
- Monday: User completes Step 1
- Tuesday: User completes Step 2
- Wednesday: User completes Step 3
- Result: All steps are counted because they follow the required order
Steps don't have to occur immediately one after another
- Users can perform other actions between steps as long as the required steps are completed in order
- Example: If a user completes Step 1 on Monday, performs several unrelated actions, and then completes Step 2 on Tuesday, both steps will be counted
- Monday: User completes Step 1
- Tuesday: User does various other actions
- Wednesday: User completes Step 2
- Result: Both steps are counted because Step 2 follows Step 1, even with other actions in between
If a user does a step multiple times: we only count the first step that occurs after the previous one
- Even if a user repeats a step multiple times, only the valid occurrence that follows the previous step will be counted
- Example: If a user completes Step 1 once and then completes Step 2 six times, only the first occurrence of Step 2 will be counted
- Monday: User completes Step 1
- Tuesday: User completes Step 2 six times
- Result: Only the first occurrence of Step 2 is counted
- This means that when a Flow Analytics user sets a Duration condition between two steps, such as "Step occurred less than 30 minutes after the previous step" and "Step occurred more than 30 minutes after the previous step," the numbers won't simply add up. This is because a user can trigger the event multiple times and fall into both time categories
Flow Comparison
What is Flow Comparison?
Flow comparison allows you to compare the same flow using different:
The comparison is displayed side-by-side, showing key statistics for both versions of the flow (Flow A and Flow B), so you can identify differences in behavior.
How to use Compare Mode
-
In the Flow header, turn on the Compare mode toggle
-
You'll now see two panels: Flow A (your original flow) and an empty Flow B
-
In Flow B, set a different date range, apply a saved filter, or both
-
 Click the Calculate icon to load results
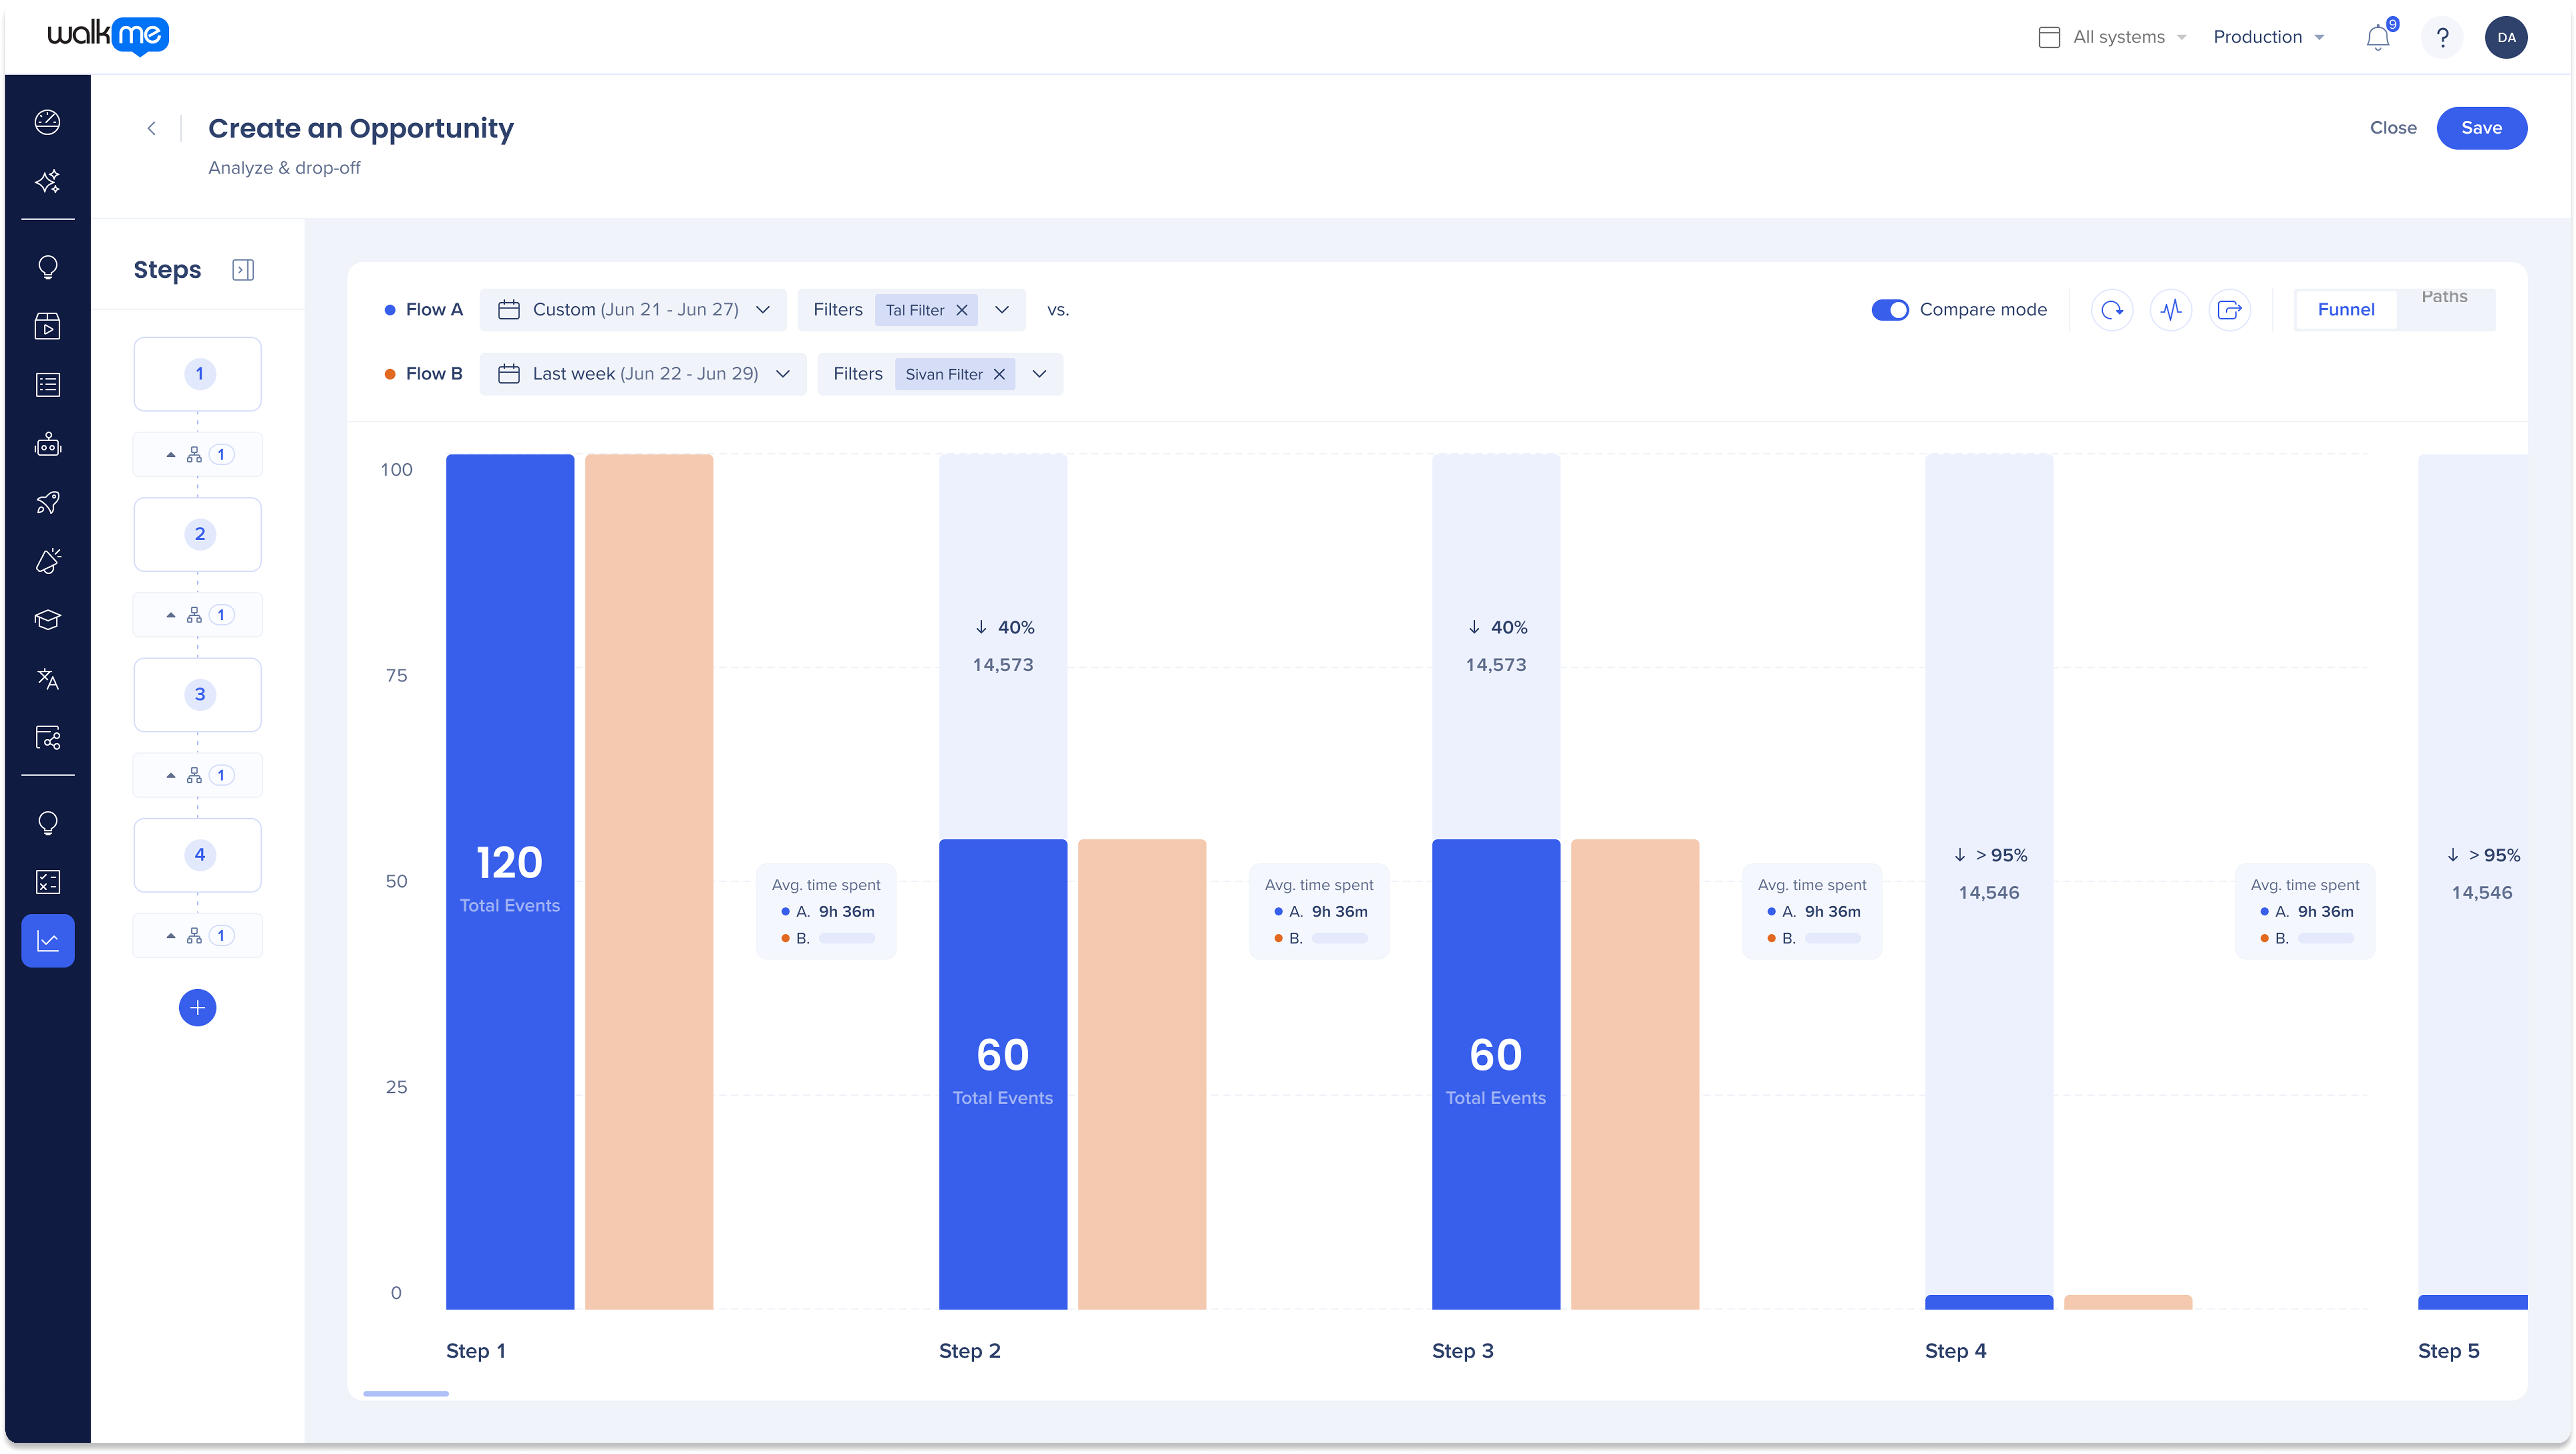
Comparison results
In Compare mode, each step in the funnel displays results for both Flow A (Blue) and Flow B (Orange) side-by-side. For each flow, you'll see:
-
Total Events: The number of times users completed the step
-
Drop-off Percentage: The percentage decrease in users compared to the previous step
-
Average Time Spent: The average duration between steps
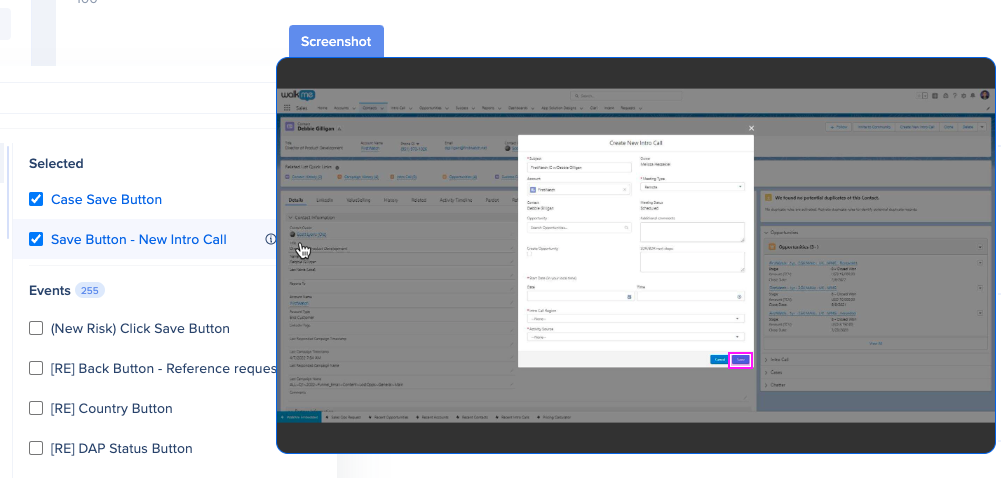
When you hover over any step, you can:
-
Click Visualize to open a side panel showing a detailed breakdown for that specific flow and step
-
Use Show data as to segment results by properties such as browser, location, or department — helping you analyze differences between user groups
Flow comparison statistics
 Click the Statistics icon in the flow header to open the Flow Statistics popup, which provides a detailed summary of flow performance metrics, available for both Flow A and Flow B when Compare Mode is on.
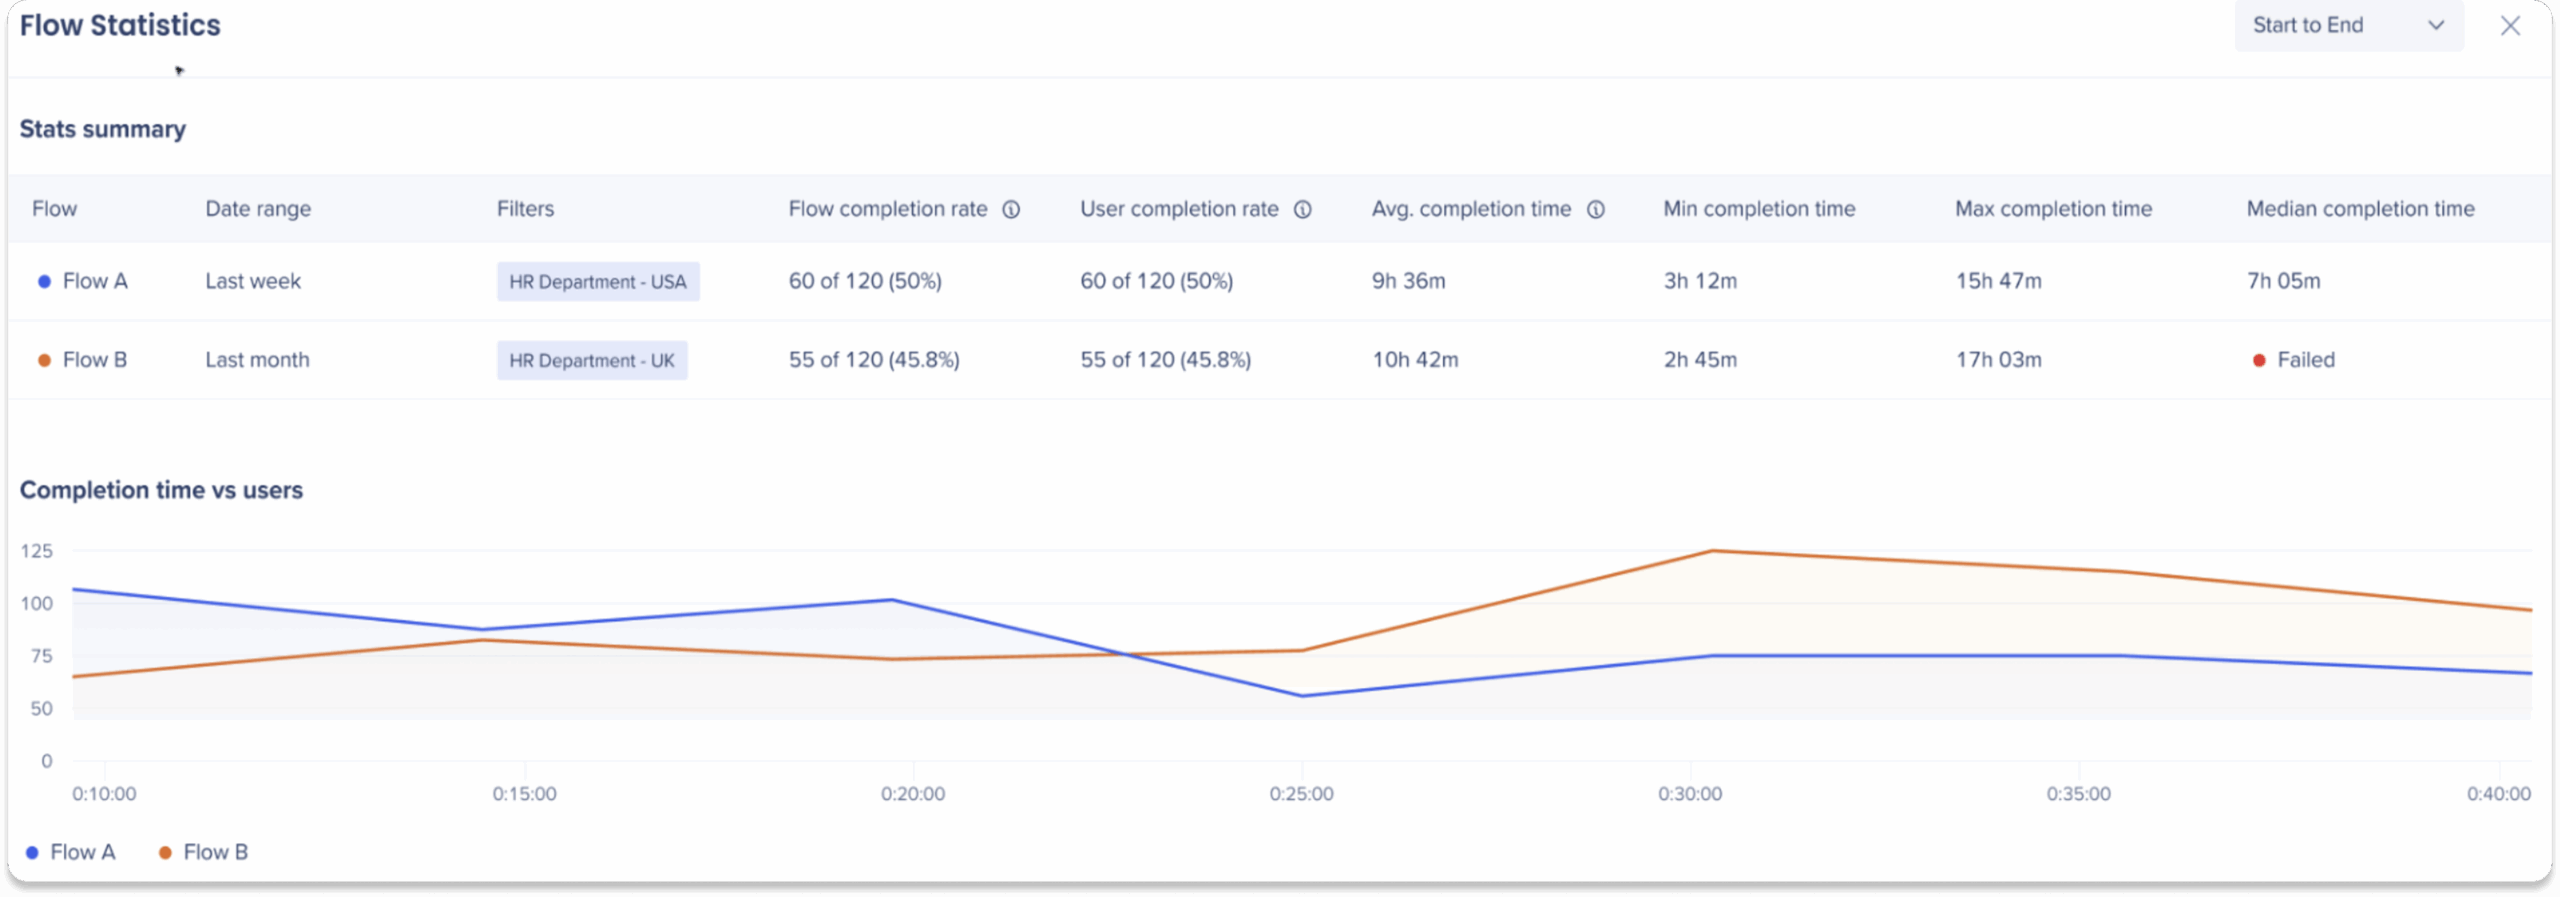
Stats Summary
At the top of the popup, you'll see a Stats summary table with the following metrics:
|
|
|
|
|
Flow completion rate
|
Measures how many times users completed the last step in the selected range, compared to how many times the first step was triggered.
|
Flow: Add to Basket → Check-out
That's:
Flow completion rate = 1 / 6 = 17%
This helps you measure how many total attempts reach the end, even if the same user contributes multiple times.
|
|
User completion rate
|
Measures how many users completed the last step in the selected range at least once, compared to how many unique users triggered the first step.
|
Flow: Add to Basket → Check-out
That's:
-
2 users started the flow
-
1 user completed it
User completion rate = 1 / 2 = 50%
This helps you understand how many people are successfully completing the process, no matter how many times they tried.
|
|
Average completion time
|
Measures the average time it takes to go from the first step to the last step in the selected range.
|
Flow: Add to Basket → Check-out
-
User A: adds to basket at 11:00, checks out at 12:00 = 1 hour
-
User B: adds to basket at 10:00, no check-out ❌
Only User A will be counted.
Average completion time = 1h / 1 = 1h
This shows how long it typically takes users who complete the flow.
|
|
Min / Max completion time
|
Shows the fastest and slowest times it took any user to complete the selected step range.
|
Flow: Add to Basket → Check-out
-
User A completed in 2h
-
User B completed in 5h
Min = 2h, Max = 5h
Use this to spot outliers or large timing gaps.
|
|
Median completion time
|
Shows the midpoint of all valid completion times. Half of completions were faster and half were slower.
|
Flow: Add to Basket → Check-out
Median = (2h + 3h) / 2 = 2.5h
Helps you understand the typical user experience without being skewed by outliers.
|
Notes
-
 Metrics reflect the selected filters and time range for each flow being analyzed
-
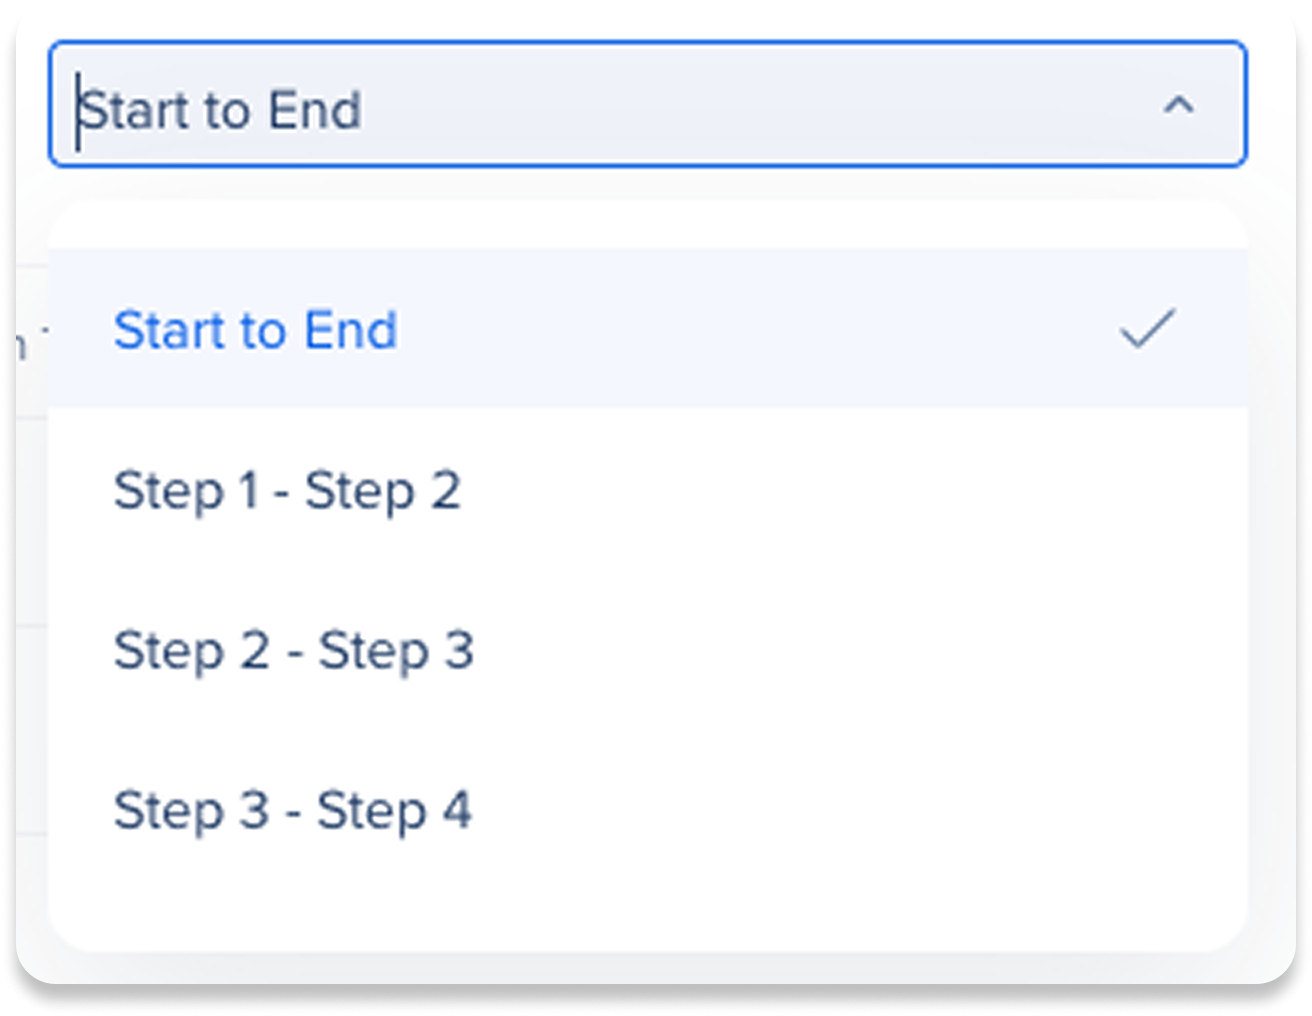
Use the Step Range dropdown in the top-right of the popup to view statistics for the entire flow (Start to End) or for a specific step range (For example, Step 2 to Step 3). If steps have custom names, they will appear instead of step numbers
-
The Step Range dropdown only supports consecutive steps. You can select ranges like Step 2 → Step 3, but not skipped steps like Step 2 → Step 4
-
If there are no completions, time-based metrics will display as N/A
-
Calculated values are rounded down, so some results may appear as 0 even if completions occurred
-
Flows using the pre-built filters “Not exposed” or “Not interacted” with WalkMe may experience longer load times and are more likely to result in errors on large datasets
-
Comparison Mode is not available in Paths view
Completion Time vs Users Chart
Below the summary table is a line chart showing Completion Time vs. Number of Users for each flow:
This helps you spot completion trends, outliers, or bottlenecks between audiences.
Pre-built Filters
Flow Comparison includes a set of out-of-the-box (OOTB) pre-built filters that help you analyze how users who were exposed to or interacted with WalkMe content behave differently from those who weren't. These filters apply across the entire selected time range, not individual sessions.
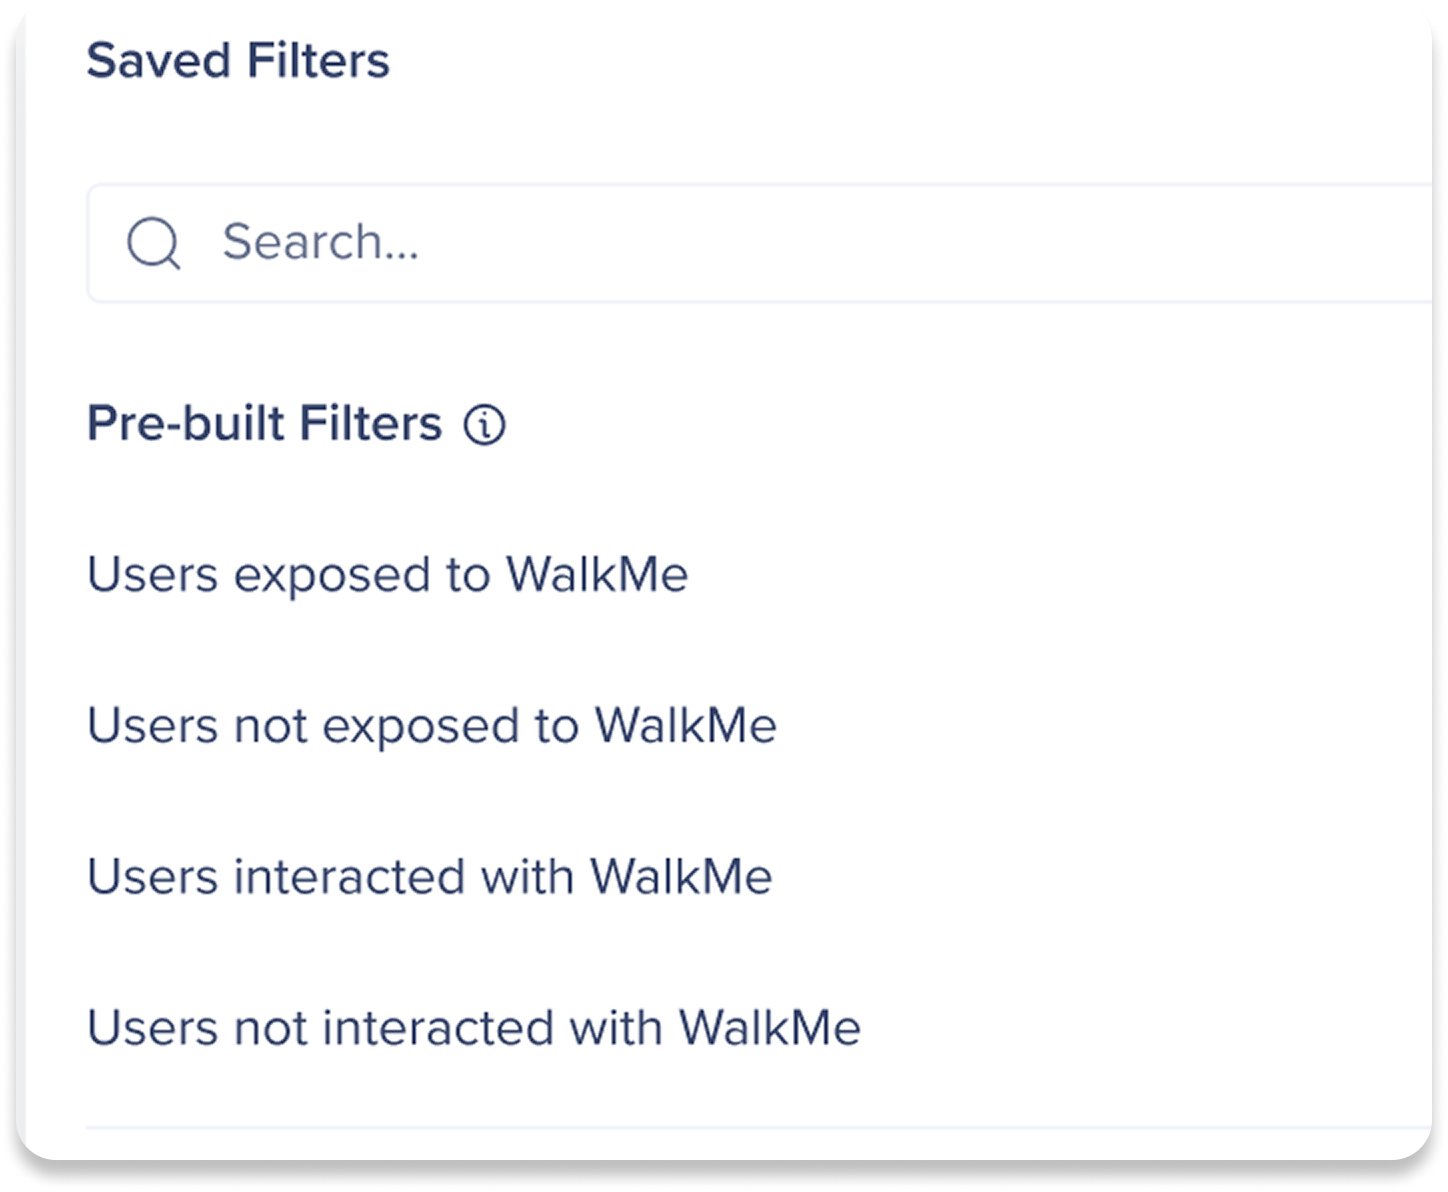
Filter Definitions
Users Exposed to WalkMe
Users who had at least one WalkMe item visible or available to them (with any segmentation and rules applied) in the selected time range.
Real-life example:
Scenario
Analysis
Users Not Exposed to WalkMe
Users who did not have any WalkMe item visible or available to them (with any segmentation and rules applied) in the selected time range.
Real-life example:
Scenario
Analysis
Note
However, if your flow includes a step that tracks interaction with WalkMe content (e.g., clicking a Launcher), applying this filter will return zero users, since interacting with content means they were, by definition, exposed.
Users Interacted with WalkMe
Users who engaged with at least one WalkMe item (e.g., clicked a Launcher, played a Smart Walk-Thru, etc.) in the selected time range.
Real-life example:
Scenario
Analysis
Users Not Interacted with WalkMe
Real-life example:
Scenario
Analysis
Note
However, if your flow includes a step that tracks interacting WalkMe content (e.g., clicking a Launcher), applying this filter will return zero users, since interacting with content means they were, by definition, interacted.
Understanding Filter Logic
"Not Exposed" or "Not Interacted" may contradict flow logic
If your flow has a step that tracks WalkMe engagement, like clicking a Launcher, using the filters "Not Exposed" or "Not Interacted" will show zero results.
Example
Analysis
Filters are not deployable-specific
Filters apply to any WalkMe content — not a specific ShoutOut, Launcher, or Smart Walk-Thru.
Recommendation
-
Add the specific WalkMe item as a step in your flow, such as "ShoutOut shown"
-
Then, apply a general exposure or interaction filter
-
Note that you cannot use "not exposed" or "not interacted" for this purpose
Filters use time range logic, not session logic
Pre-built filters are applied across the entire selected time range, not per session like in Insights Classic. This means users are included if they were exposed to or interacted with WalkMe at any point during the date range, even if that happened before or after the flow steps.
Scenario 1
-
Flow steps: Create goal → Save Goal
-
Time range selected: Monday → Friday (Marked in green in the tables)
-
Filter selected: User was exposed to WalkMe
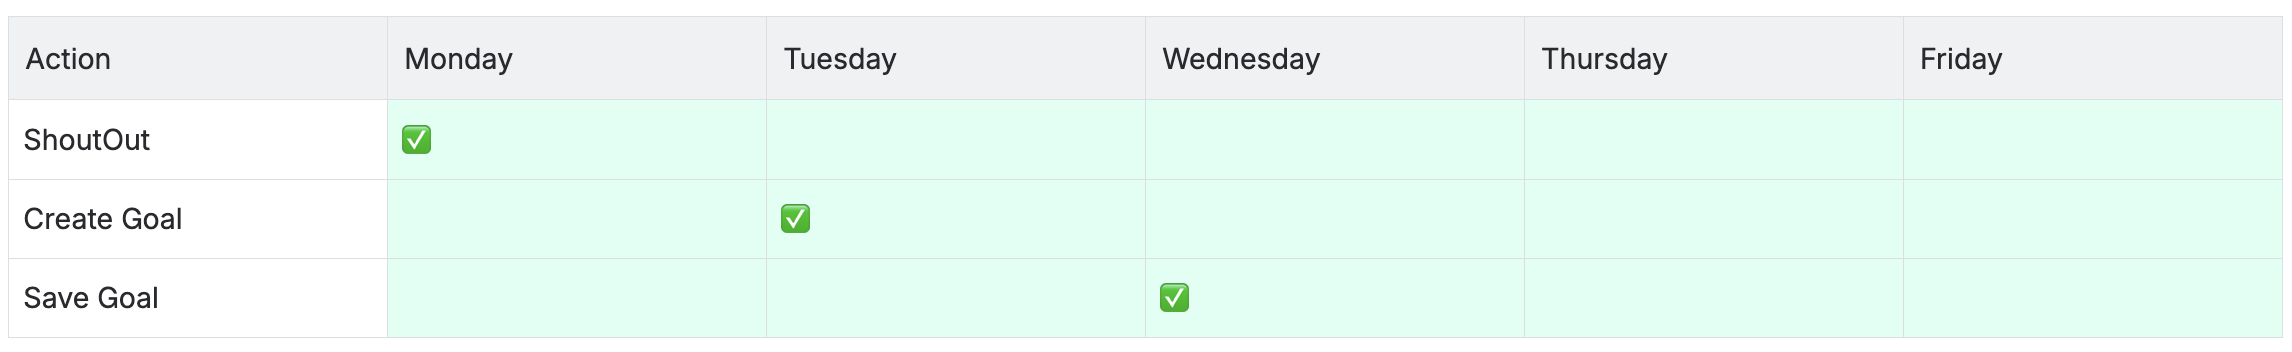
Analysis: In this scenario, a user is counted as Exposed to WalkMe since they encountered the ShoutOut during the selected time range.
-
Unlike Classic Insights, this exposure isn't tied to a specific session. The user doesn't need to view the ShoutOut on the same day as the flow step create / save goal; it just needs to occur within the chosen period.
-
So even if the shoutout was viewed before or after the flow steps, it will be counted as Exposed to WalkMe as long as it's in the selected time range
Scenario 2
-
Flow steps: Create goal → Save Goal
-
Time range selected: Monday → Friday (In time range marked in green / Out of time range marked in red)
-
Filter selected: User Not Exposed to WalkMe
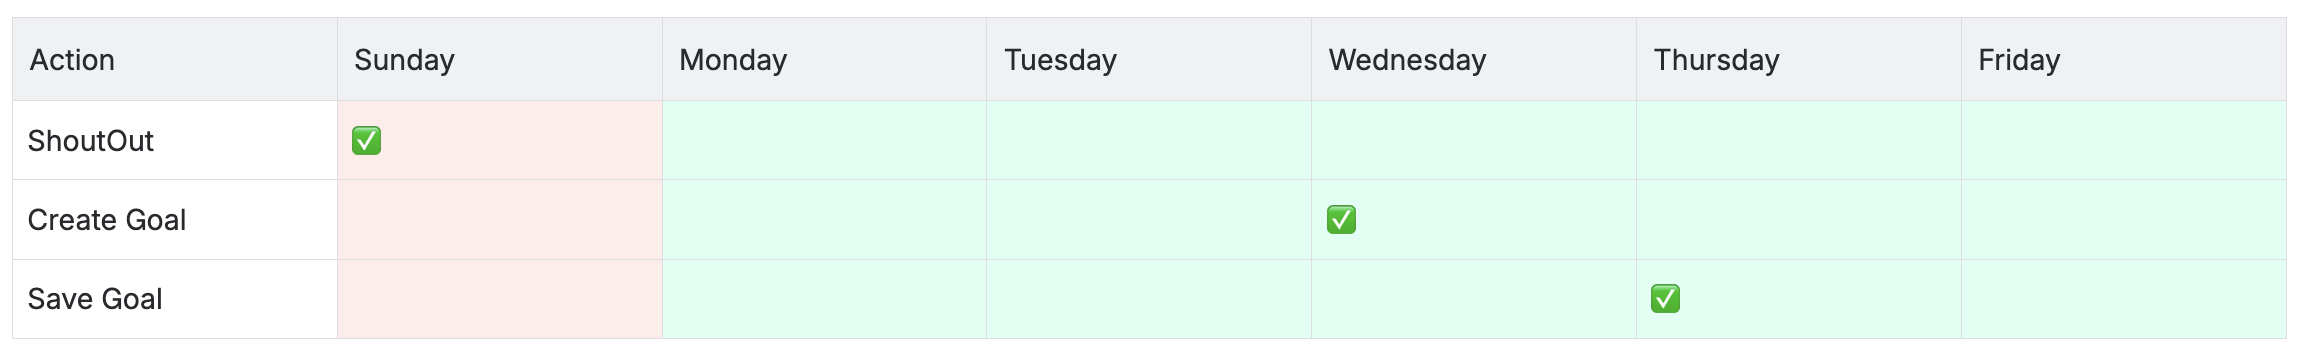
Analysis: In this scenario, a user is counted as Not Exposed to WalkMe since they did not encountered the ShoutOut during the selected time range.
Support
Optimize Flow Analytics Performance
Flow Analytics is ideal for understanding specific flows or processes. Rendering speeds may increase when searching across more events.
-
Searching more Time/Systems/Users Steps/Content/Pages/Elements can lead to longer loading times
-
For systems with thousands of users, the request may exceed the 60-second time limit and cause the page to timeout
-
In such cases, we recommend restricting the number of events by adding filters and reducing the number of steps, systems, or the timeframe
Technical Notes
Prerequisites
-
WalkMe must be deployed via Extension or Snippet
-
DeepUI is a prerequisite for using Engaged Elements
-
For Cross app tracking, the user ID must be similar when tracking user behavior cross app
-
Must have access to a System to view a flow that contains that System
-
To support Page view tracking, the user needs to have Page view collection or full DXA enabled
Limitations
-
10 steps maximum are supported in a funnel (need more? we'd love to hear more use cases to support this requirement.)
-
Maximum 5 conditions between steps
-
Maximum 5 filters per step
-
No session playback of funnels
-
No custom attributes from Engaged Elements
-
No more single session vs multi session
-
Existing Funnels will not be ported over
-
Number of buckets is limited to 10
- Content type conditions for SmartTips, Resources, Shuttles, Goals, Menu & Search, and Onboarding Tasks are visible but not supported for mobile native systems
- Web-only filters remain visible in steps, funnel, and path views when using a mobile native system — these filters do not apply to mobile native data
Flow Analytics support
-
Desktop/Mobile systems aren't supported
-
Session playback isn't supported
-
Mobile web data isn't supported
- TeachMe, WalkMe Menu, and ActionBot data isn't supported
Insights Classics vs Flow Analytics
|
Insights Classic Funnels |
Flow Analytics |
| Multi-system support |
Steps Limited to only one system |
Steps can traverse multiple systems |
| # of steps |
5 |
10 |
| Conditions between steps |
Not available |
Can set conditions for users between steps e.g only care users who completed the previous step within 5 minutes of the last one. |
| Management |
Not available, just one long list |
Can see who created, modified and has access to your flows. |
| Path support |
Not available |
See how users move through multiple paths to get to their destination. |
| Step filtering |
Not available |
Filter a specific step. Only want the users based in USA or who used Chrome. Now you can. |
| Step data deep dive |
Not available |
Now you can dig into a specific step and deep dive into the data to understand what's really happening. (Select an item from the graph and click Visualize) |
| All system, Engaged Element or content |
Not available, have to select a specific item |
Can now see All the engaged elements or content to get a high level view of all your WalkMe content. |
| Export |
Not available |
Quickly export a PNG of the graph so you can tell the WalkMe value story. |
| Non user tracking Beta |
Not available |
Allows the tracking of a non user object through multiple systems e.g a support ticket that moves from service now to Jira to salesforce can now be tracked. |
| Tracking for all events |
Not available, tracks unique users rather than all events. This means that if a user triggers an event multiple times in a session, it will only be counted once. |
Allows tracking for all events and not just for unique users. |
| Customer defined sessions |
Session defined by WalkMe (For example, 12 hours maximum or ends after a 30 minute period of inactivity) |
Customers can define a duration condition to define a session as they wish |