
Business Productivity Dashboard
Last Updated March 18, 2025
Brief Overview
The Business Productivity Dashboard is one place where managers can gain visibility into software usage, and business productivity of their employees. Using a simple and visual user interface to easily understand the current needs of your business. This is the perfect tool for executives, managers and business owners who want to confirm that their employees are maintaining a high productivity level, and have access to all relevant IT resources.
Use Cases
- Monitor the business productivity of employees
- Understand organization-wide software usage
- Manage IT spend by uncovering unused software licenses, duplicate systems, or underachieving platforms
About this feature
The Business Productivity Dashboard includes 5 major panels:
- Filters and Date Pickers
- General Productivity Metrics
- Employees by Region
- Systems Used
- Employees
Productivity Dashboard Breakdown
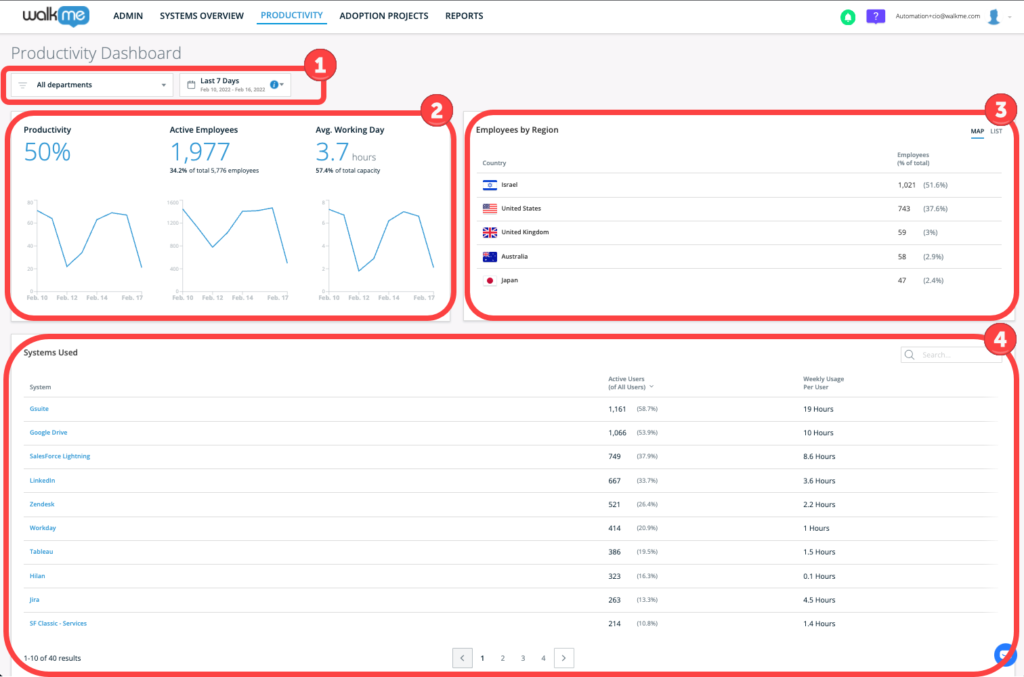
- Filters and Date Pickers
- Filters: The filter drop-down contains every "Department" that is pulled via the IDP integration of the customer
- User can select All Departments, Multiple Departments or Single Department by clicking "Show Only"
- User can only single select the department filter - "None", to count all the UIDs that do not have a value in the IDP department attribute
- The "department" data is updated in real time
- The data shown on every report on this page relates to the chosen filter
- Date Picker: Likewise, The data shown on every report in this page relates to the chosen date range.
- Filters: The filter drop-down contains every "Department" that is pulled via the IDP integration of the customer
- General Productivity Metrics
- Productivity:
- Productivity = 0.5 * (Avg. Working Day / Working Day Capacity) + 0.5 * (Active Employees Ratio / Full Employee Capacity)
- Working Day Capacity is set at 8.5 hours. This can be reconfigured by a request to your Account Manager.
- Full Employee Capacity is set yo 0.9. This can be reconfigured by a request to your Account Manager.
- Active Employees:
- The value in the large font is the number of Active Employees (Employees who had at least one session, only in a monitored system)
- The value in the small font ("Total X Employees") is the total number of monitored employees, i.e. employees who had at least one session on an extension installed browser (either in a monitored or non-monitored system). This is 100% of potential unique employees. Users are counted via a pulse event that is sent via the extension once a day.
- The % in the small font ("X% of") is the ratio between Active Employees and Total Employees. Active Employees Ratio = Active Employees / Total Employees
- Avg. Working Day:
- Calculated as the average sum of durations of all browser sessions during the selected period, divided by the number of days in the period
- Avg. Working Day = (session duration sum / number of users) / (number of days in selected period)
- Productivity:
- Employees by Region
- Table: Shows a breakdown of the top 5 countries with the highest number of employees, and the ratio of the total number of employees who has the extension installed
- Map: Shows the geographic distribution of Active Employees by top 5 countries
- Hovering over a country shows the number of Active Employees in the country, as a percentage of total Employees.
- Systems Used
- Shows the breakdown of usage of all systems tracked by:
- Active Users and (% of All Users) who have used the system in the defined period
- Weekly Usage Per User - Average number of hours per week per Active User who have used the system in the defined period
- Active Users = Active Employees
- Search for a specific platform via the search bar
- Sort the table by any of the 5 columns, by clicking on the column's title
- Shows the breakdown of usage of all systems tracked by:
Prerequisites
The following pre-requisites are needed for the account in order to have this feature enabled:
- Account that consists of 2 or more systems
- An extension is being used for Production with 2 or more of the systems
- The account has to use IDP integration for user identification
IDP Integration
- Department filter uses the “department” attribute, which can either be integrated directly using IDP or mapped manually by request.
- Important: This dashboard relies on the “department” (lowercase "d") attribute from the IDP integration. In case the attribute in the customer's IDP integration is named differently, you should map your attribute manually, as needed.
- For more information on IDP integration.
Was this article helpful?
Yes
No
Thanks for your feedback!