Brief Overview
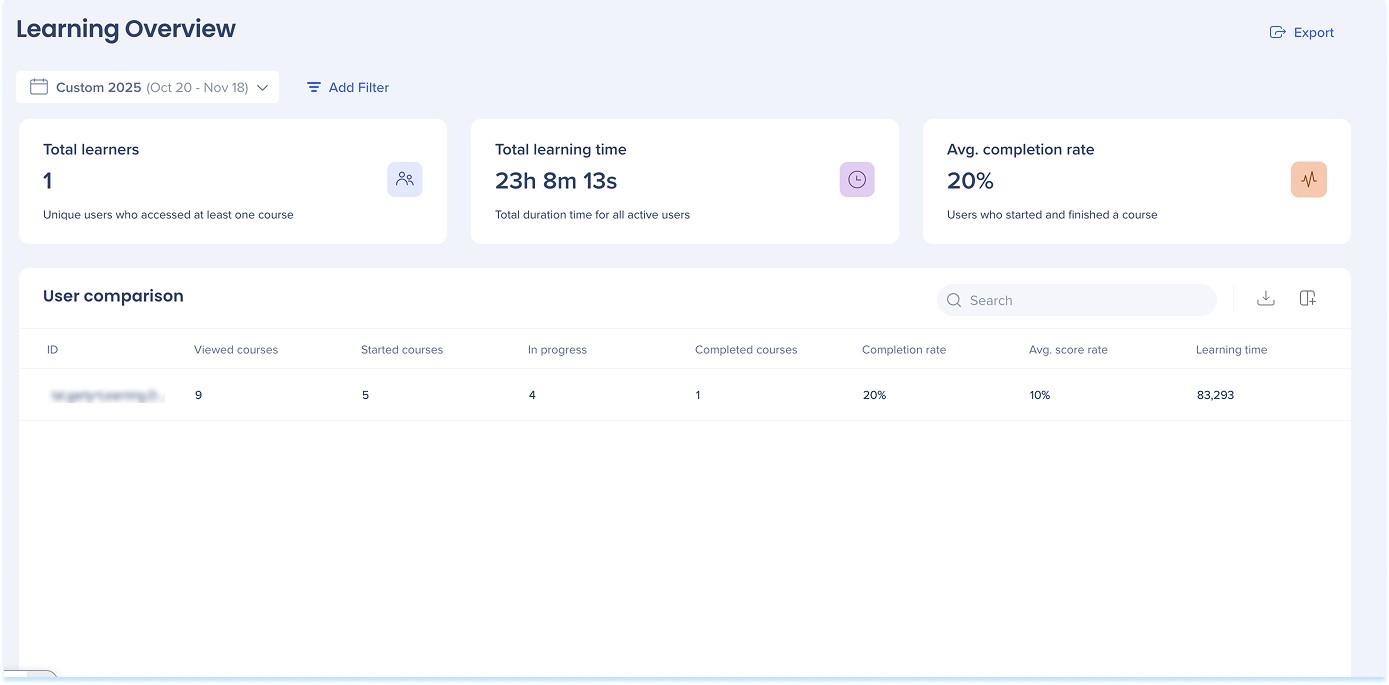
The Learning Overview page helps you track learner engagement and performance across all courses. Use the page to view overall learning trends, monitor completion rates, and identify learners who may need additional support.
Access
To access the Learning Overview page, navigate to it by clicking on the Learning Overview page in the console navigation or use a direct link to the page:
How It Works
Dashboard-level metrics
The dashboard-level metrics section shows overall learning activity across your organization. Use these widgets to understand learner engagement and performance at a glance.
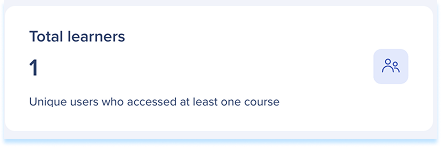
Total users
The number of distinct learners who have interacted with at least one course in the selected date range.
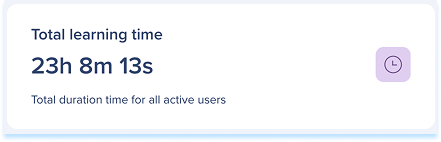
Total learning time
The total duration time learners have spent in active learning sessions.
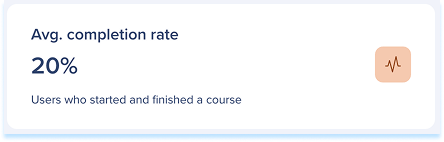
Avg. completion rate
The average percentage of courses completed by users who started them.
Additional features
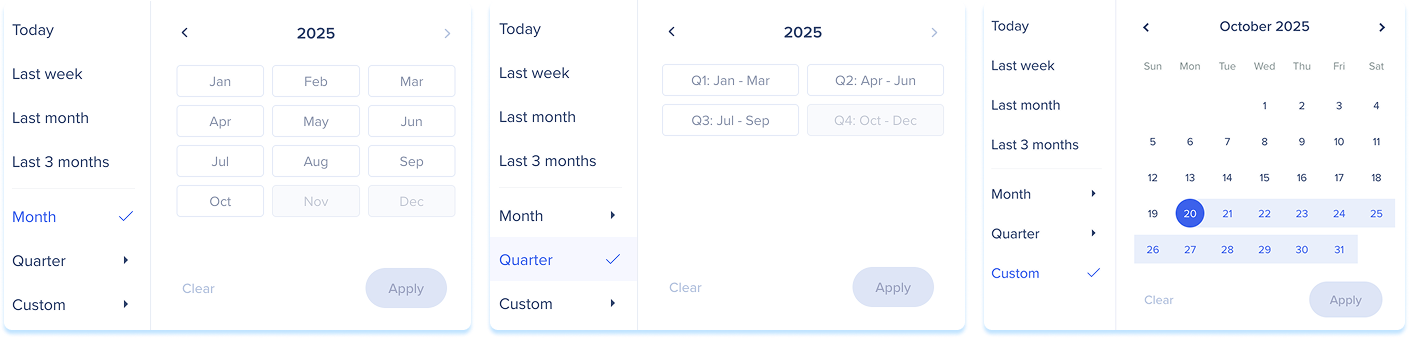
Date filters
The dashboard filters enables users to view and analyze a smaller part of your data set.
Users have the following filter options:
- Today: This filter shows data from the current day
- Last week: This filter shows data from the previous day
- Last month: This filter shows data for the previous month
- Last three months: This filter shows data for the last three months

- Month: This filter shows data from the selected month and year
- To use this filter, Last month or Last three months needs to be selected first
- Quarter: This filter shows data from the selected quarter and year
- To use this filter, Last month or Last three months needs to be selected first
- Custom: This filter allows you to select a custom date range to view data
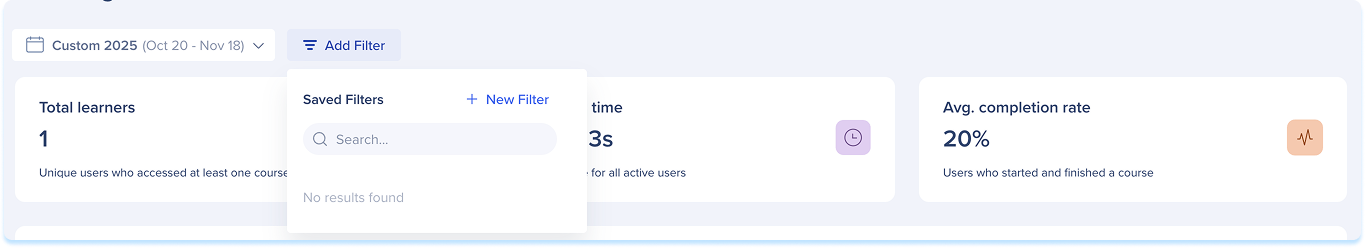
Add filters
Use the Add Filters feature to streamline your search and find information faster.
Export
Click the Export button to download a PNG file
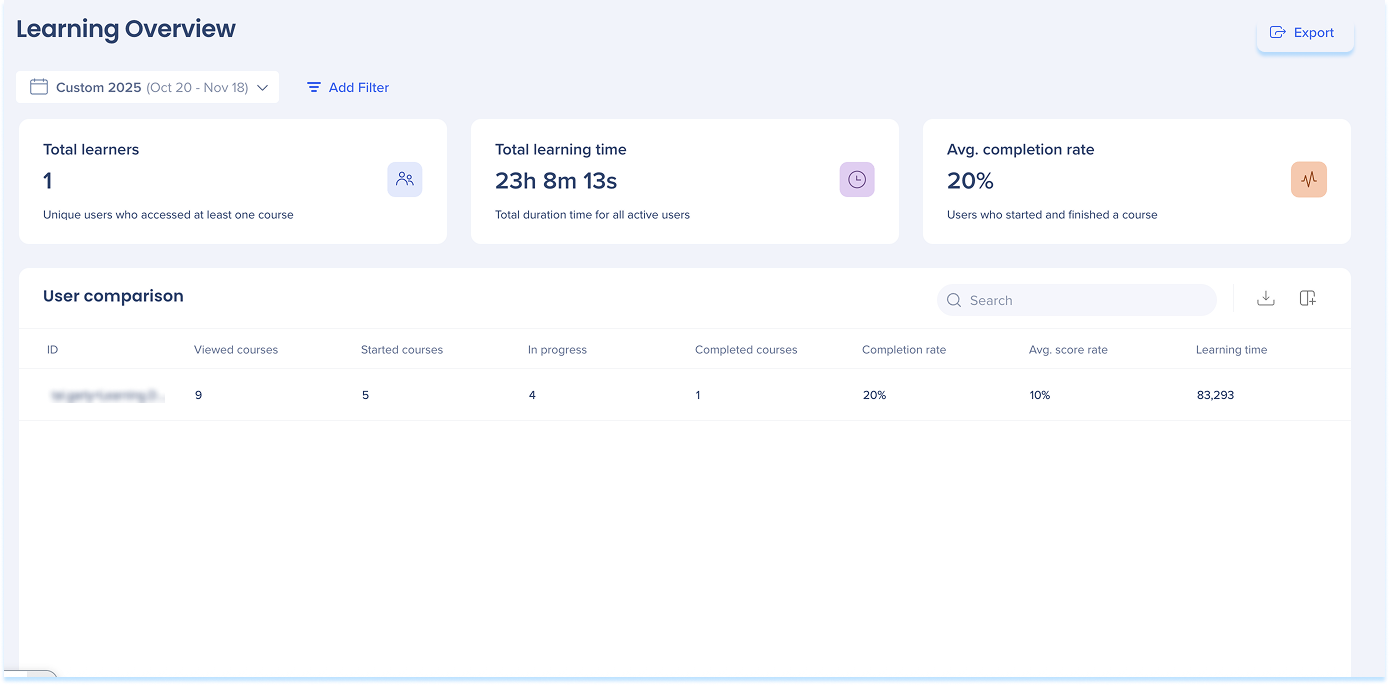
User comparison table
The user comparison table provides a detailed view of each learner's activity and performance.
Use this table to compare engagement, progress, and completion rates across all learners.
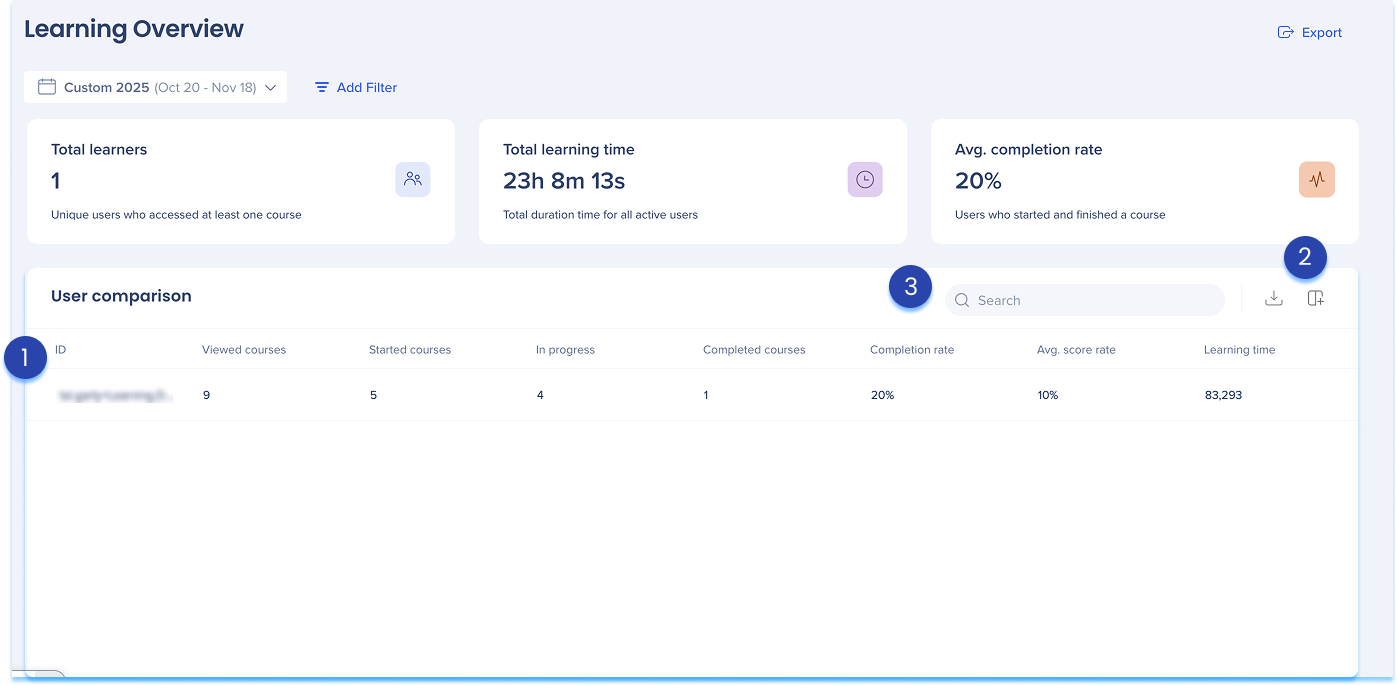
1. Table columns
- Name: The name of the user
- Viewed courses: Number of distinct courses the user has viewed
- Started courses: Number of courses the user has actively started
- In progress: Courses that have been started but not yet completed
- Completed courses: Number of distinct courses successfully completed
- Completed rate: Percentage of started courses that were completed
- Avg. score rate: Average quiz score across completed courses
- Learning time: Total active learning duration per user
2. Table icons
Manage Columns
- Remove or add columns from the table
- Click the Manage columns icon
- Select which columns you'd like to have in the table
- Click Apply
Group by Column
You can group columns by values
- Click the Group by Column icon to organize the table by a specific value
- This collapses the data into a group folder that can be expanded to view the data, making it easier to organize and view your data
Export
- Click the Export icon to download the file to either:
- CSV
- XLSX
3. Search bar
- Use the Search bar to quickly find the learner you need


