
Insights Migration to WalkMe Console
Brief Overview
WalkMe Insights, your go-to destination for understanding the performance of your DAP Initiatives, will gradually transition into the WalkMe Console. This updated platform offers a more comprehensive analytics experience for your DAP initiatives, and allows you to manage all of your favorite WalkMe applications, including Discovery, UI Intelligence, many more from one convenient location.
Many main features have already been migrated to the console. Users should begin familiarizing themselves with the console and consider switching over. While the original web application, "Insights Classic," will remain available until January 1, 2026, we encourage you to start using the console. Insights console will be continuously updated with the latest and most advanced capabilities. For example, the newly launched feature of creating custom dashboards is now available exclusively on the Insights Console.
Use Cases
-
Measure usage and optimize your WalkMe solution
-
Measure usage and optimize your underlying website
-
Analyze your end-users behavior
-
Recognize instances of end-user confusion and capitalize on these opportunities to improve
Access
The new Insights is located in the WalkMe Console. The Systems Overview page serves as the primary Insights dashboard and default homepage for all accounts. To access the page:
- Hover over the navigation sidebar in the console
- Click Insights (NEW)
- Click Systems Overview
What's changed?
High level changes
- Design: The page features a sleek new design
- Enhanced filters: We've added the ability to select specific months and quarters to our time filters to improve the user experience
- Updated widgets: The metrics widgets have undergone significant updates, with outdated ones being replaced by new and improved versions. Additionally, reused metrics have been updated with new titles, tooltips, and design to enhance their clarity and usability
- Export: Now using the export button, you can export pages to png files, and export individual widgets to CSV / XLSX files
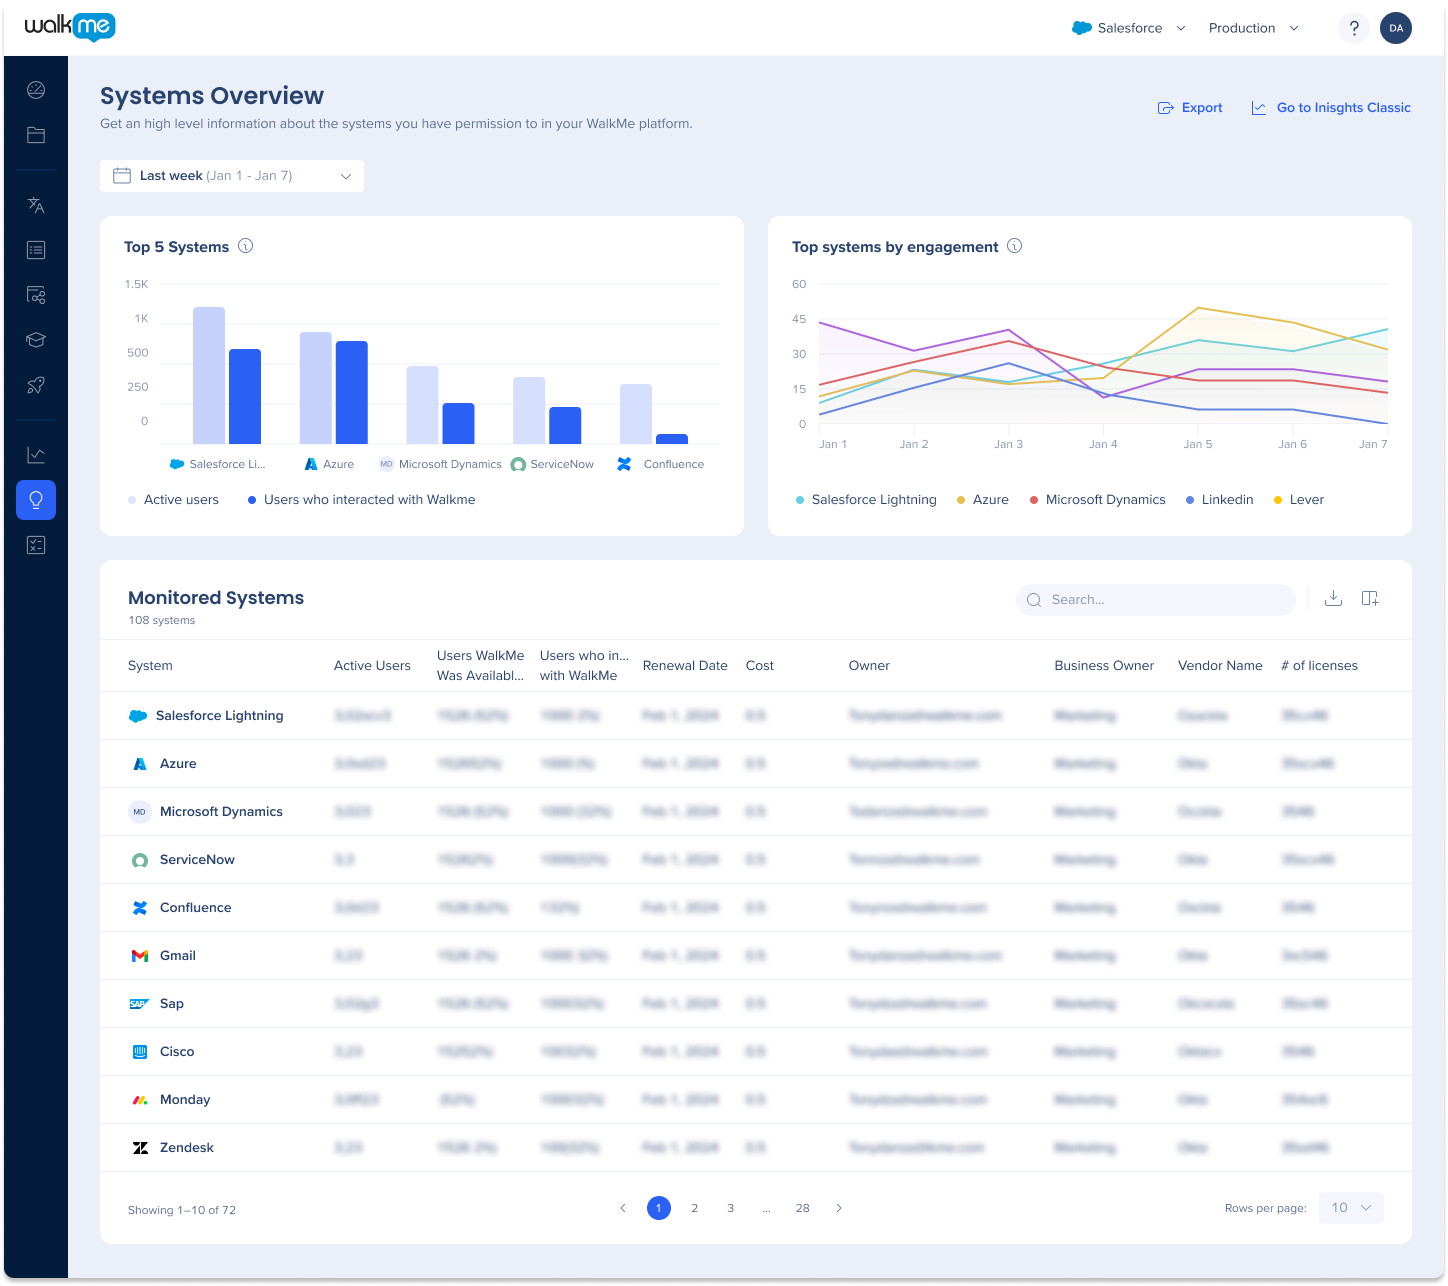
Systems Overview
The new Systems Overview dashboard page offers a high-level view of software usage across an organization, allowing users to track frequently used systems and those with high WalkMe engagement. Users can also view a list of monitored systems in the WalkMe account.
The widgets have undergone significant updates and you can learn more about them here.
New capabilities include:
- Add widgets to custom dashboards
- Export widgets to CSV / XLSX files
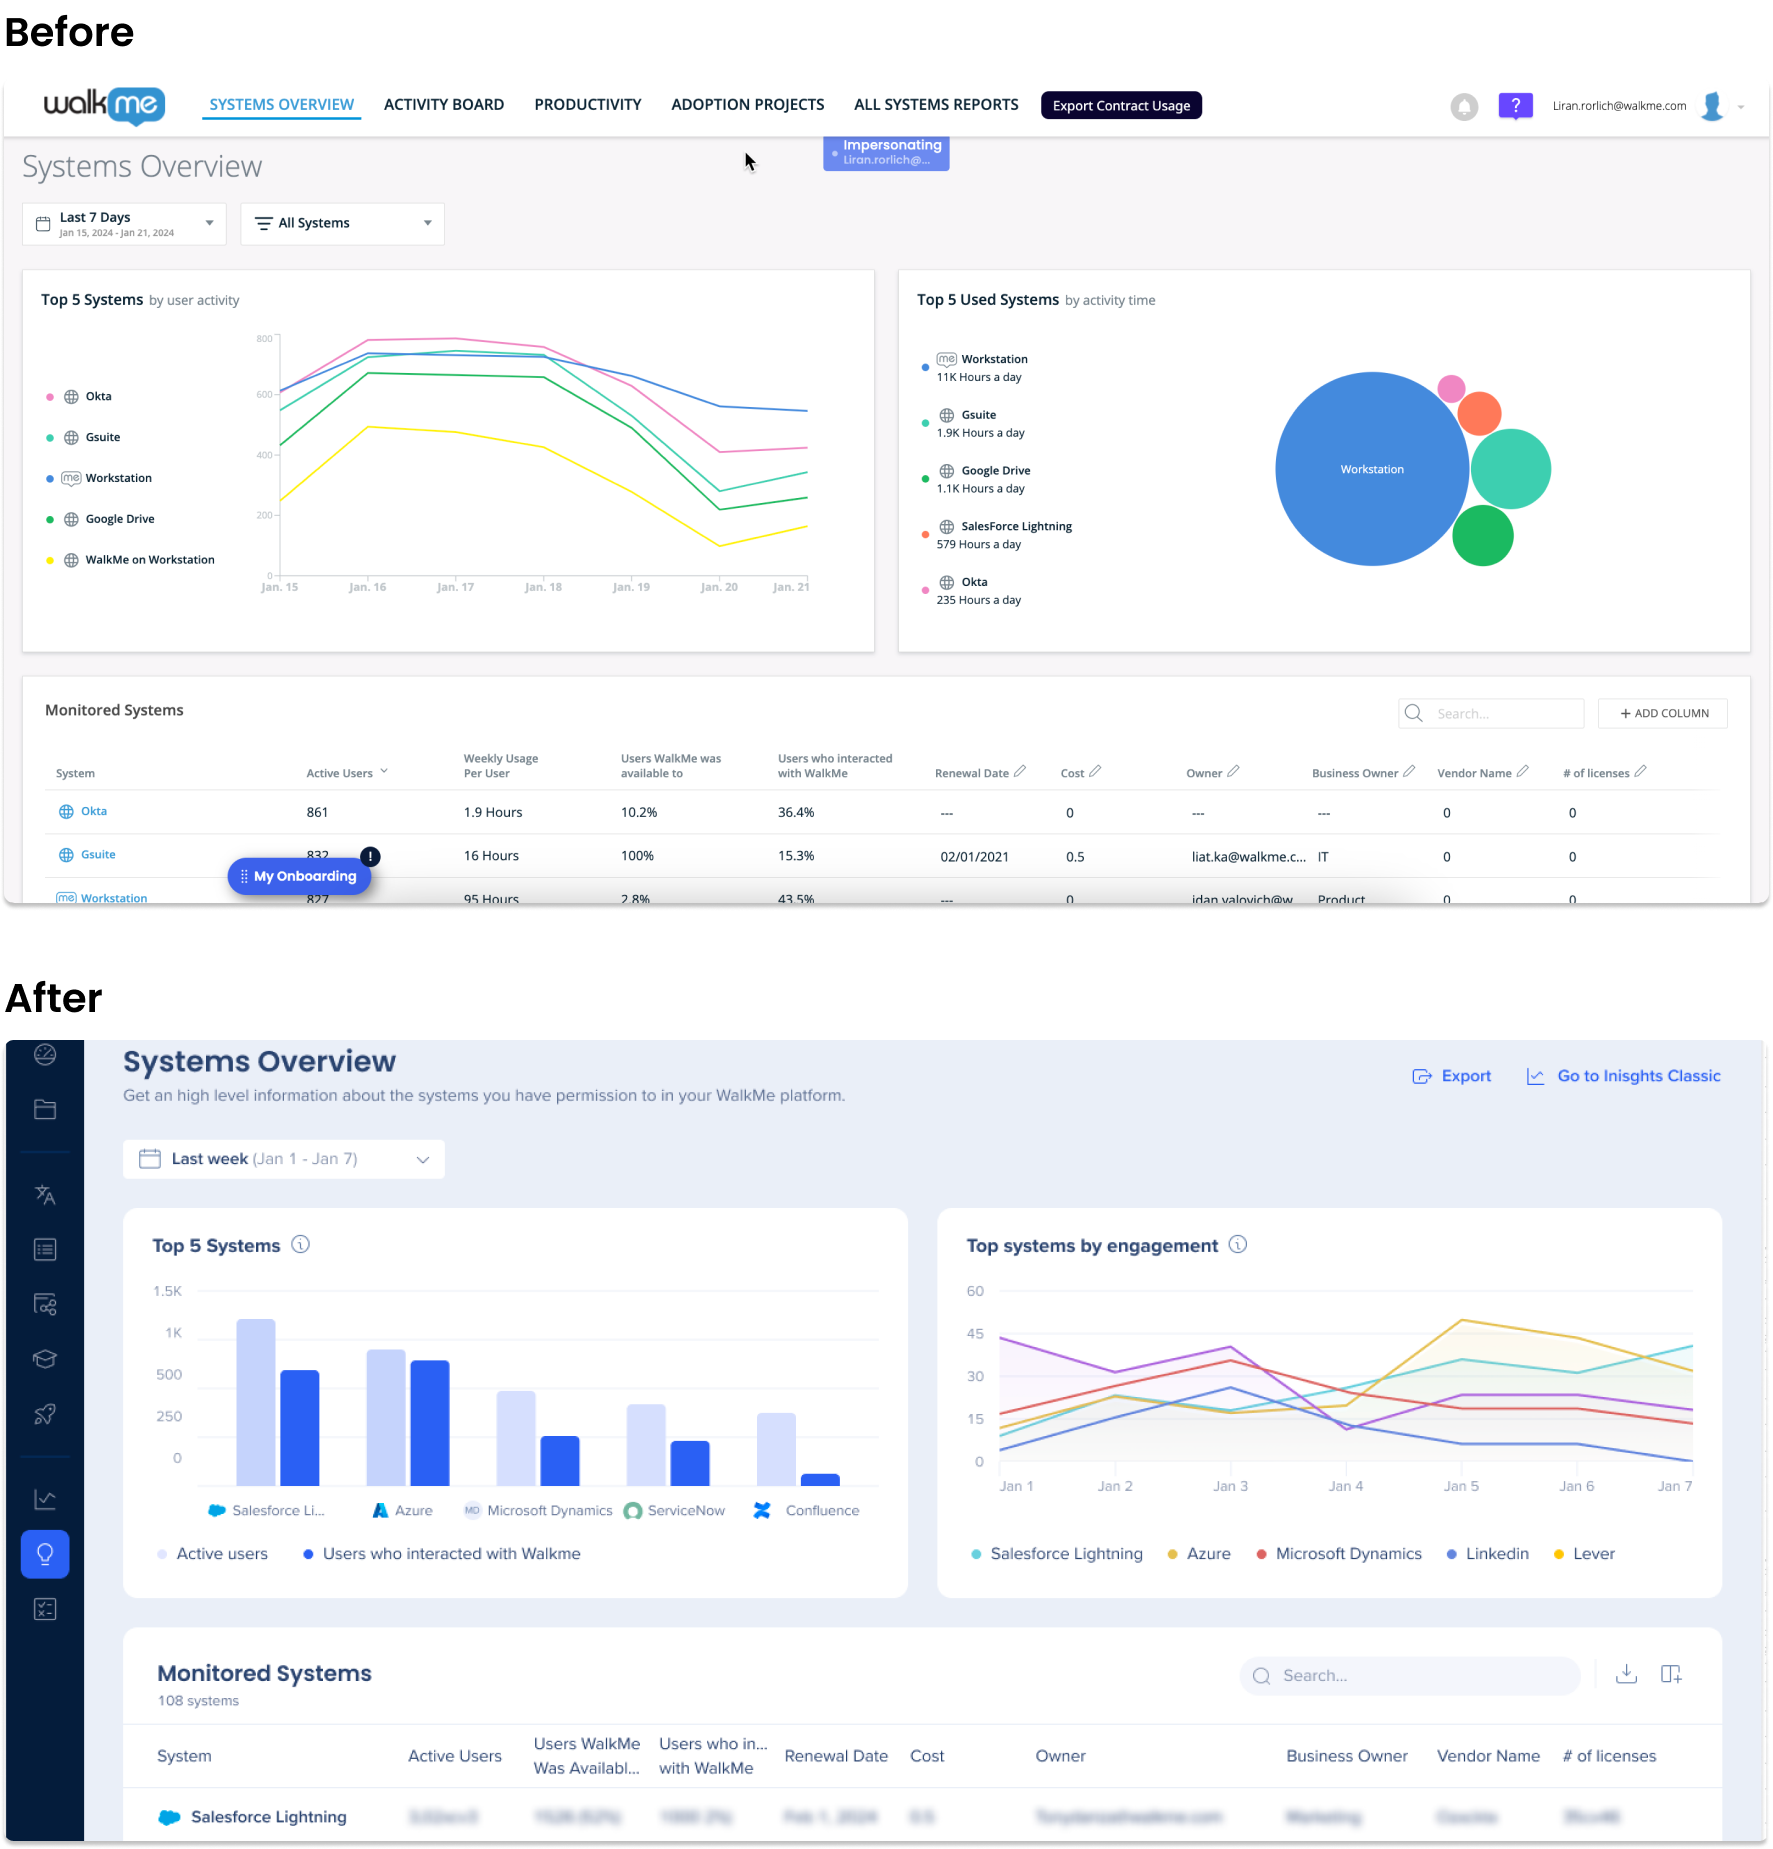
System Overview
The new System Overview page in the console provides a dashboard with visibility into the most commonly used software applications and user engagement within systems, leveraging the data from Discovery. It is made up of several widgets showing user analysis funnel, user analysis trends, where users access from, WalkMe interactions, top content, and top goals.
New updates and capabilities include:
- The widgets have undergone significant updates, with outdated ones being replaced by new and improved versions. Additionally, reused metrics have been updated with new titles, tooltips, and design to enhance their clarity and usability
- Apps sidebar moved to tabs on the system overview page
- Add widgets to custom dashboards
- Switch widget view from graph to list view
- When hovering and clicking on user metrics in list view, a side panel will open lists of the unique users
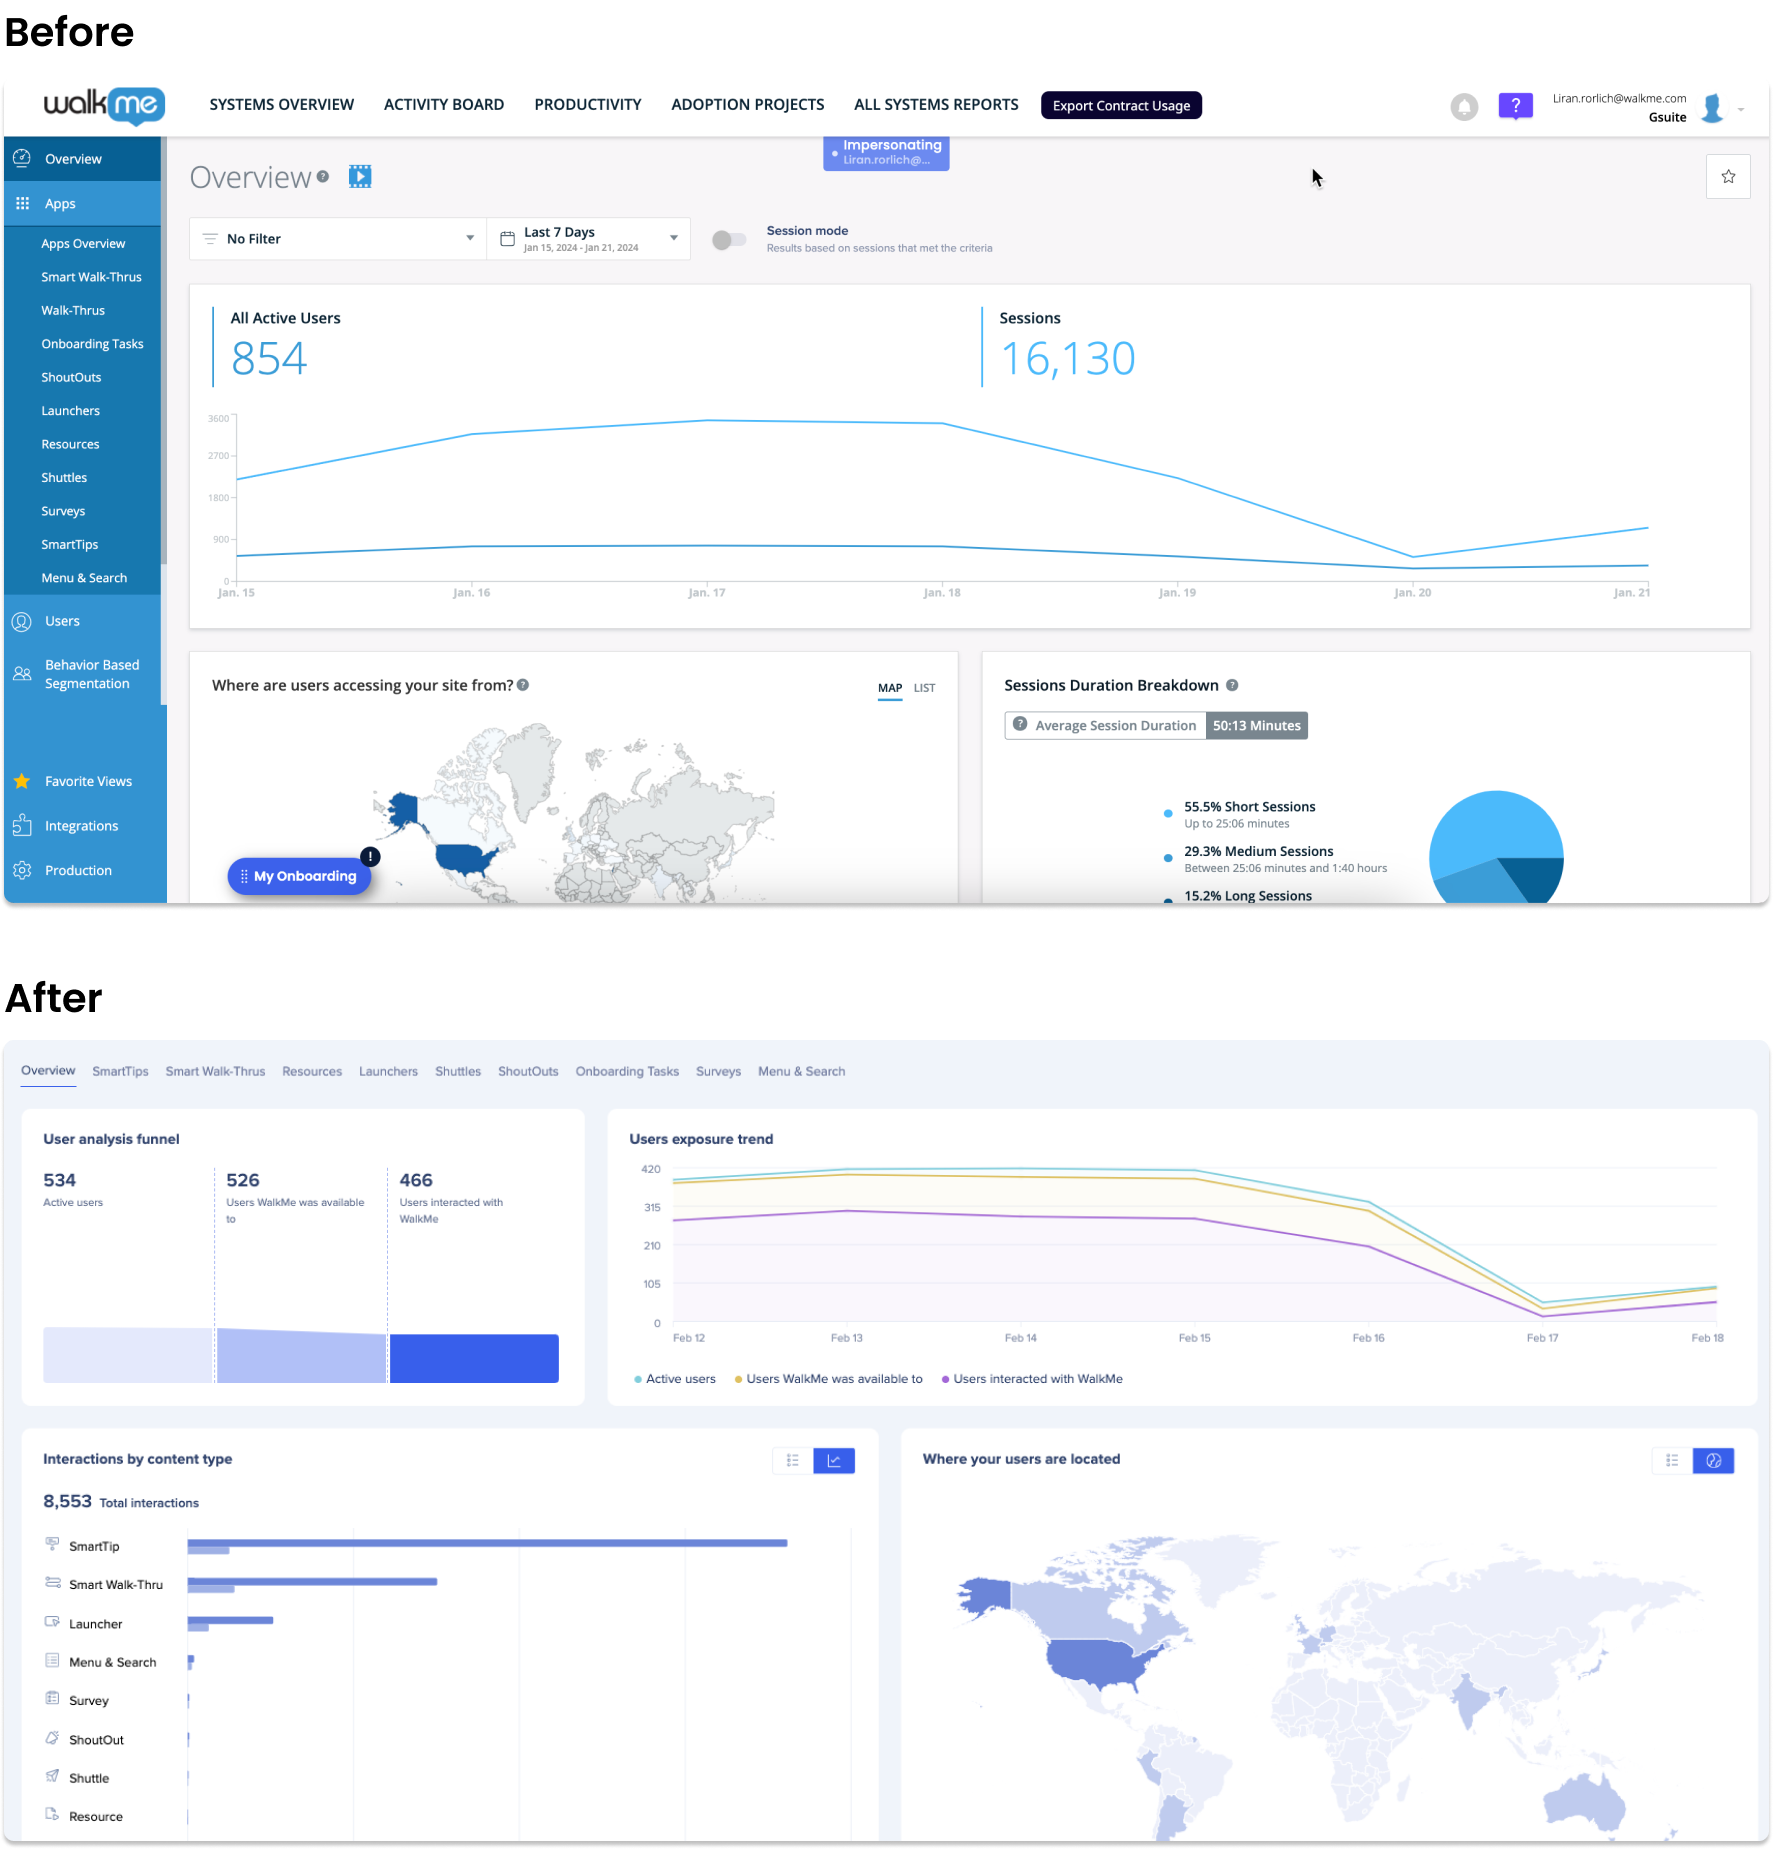
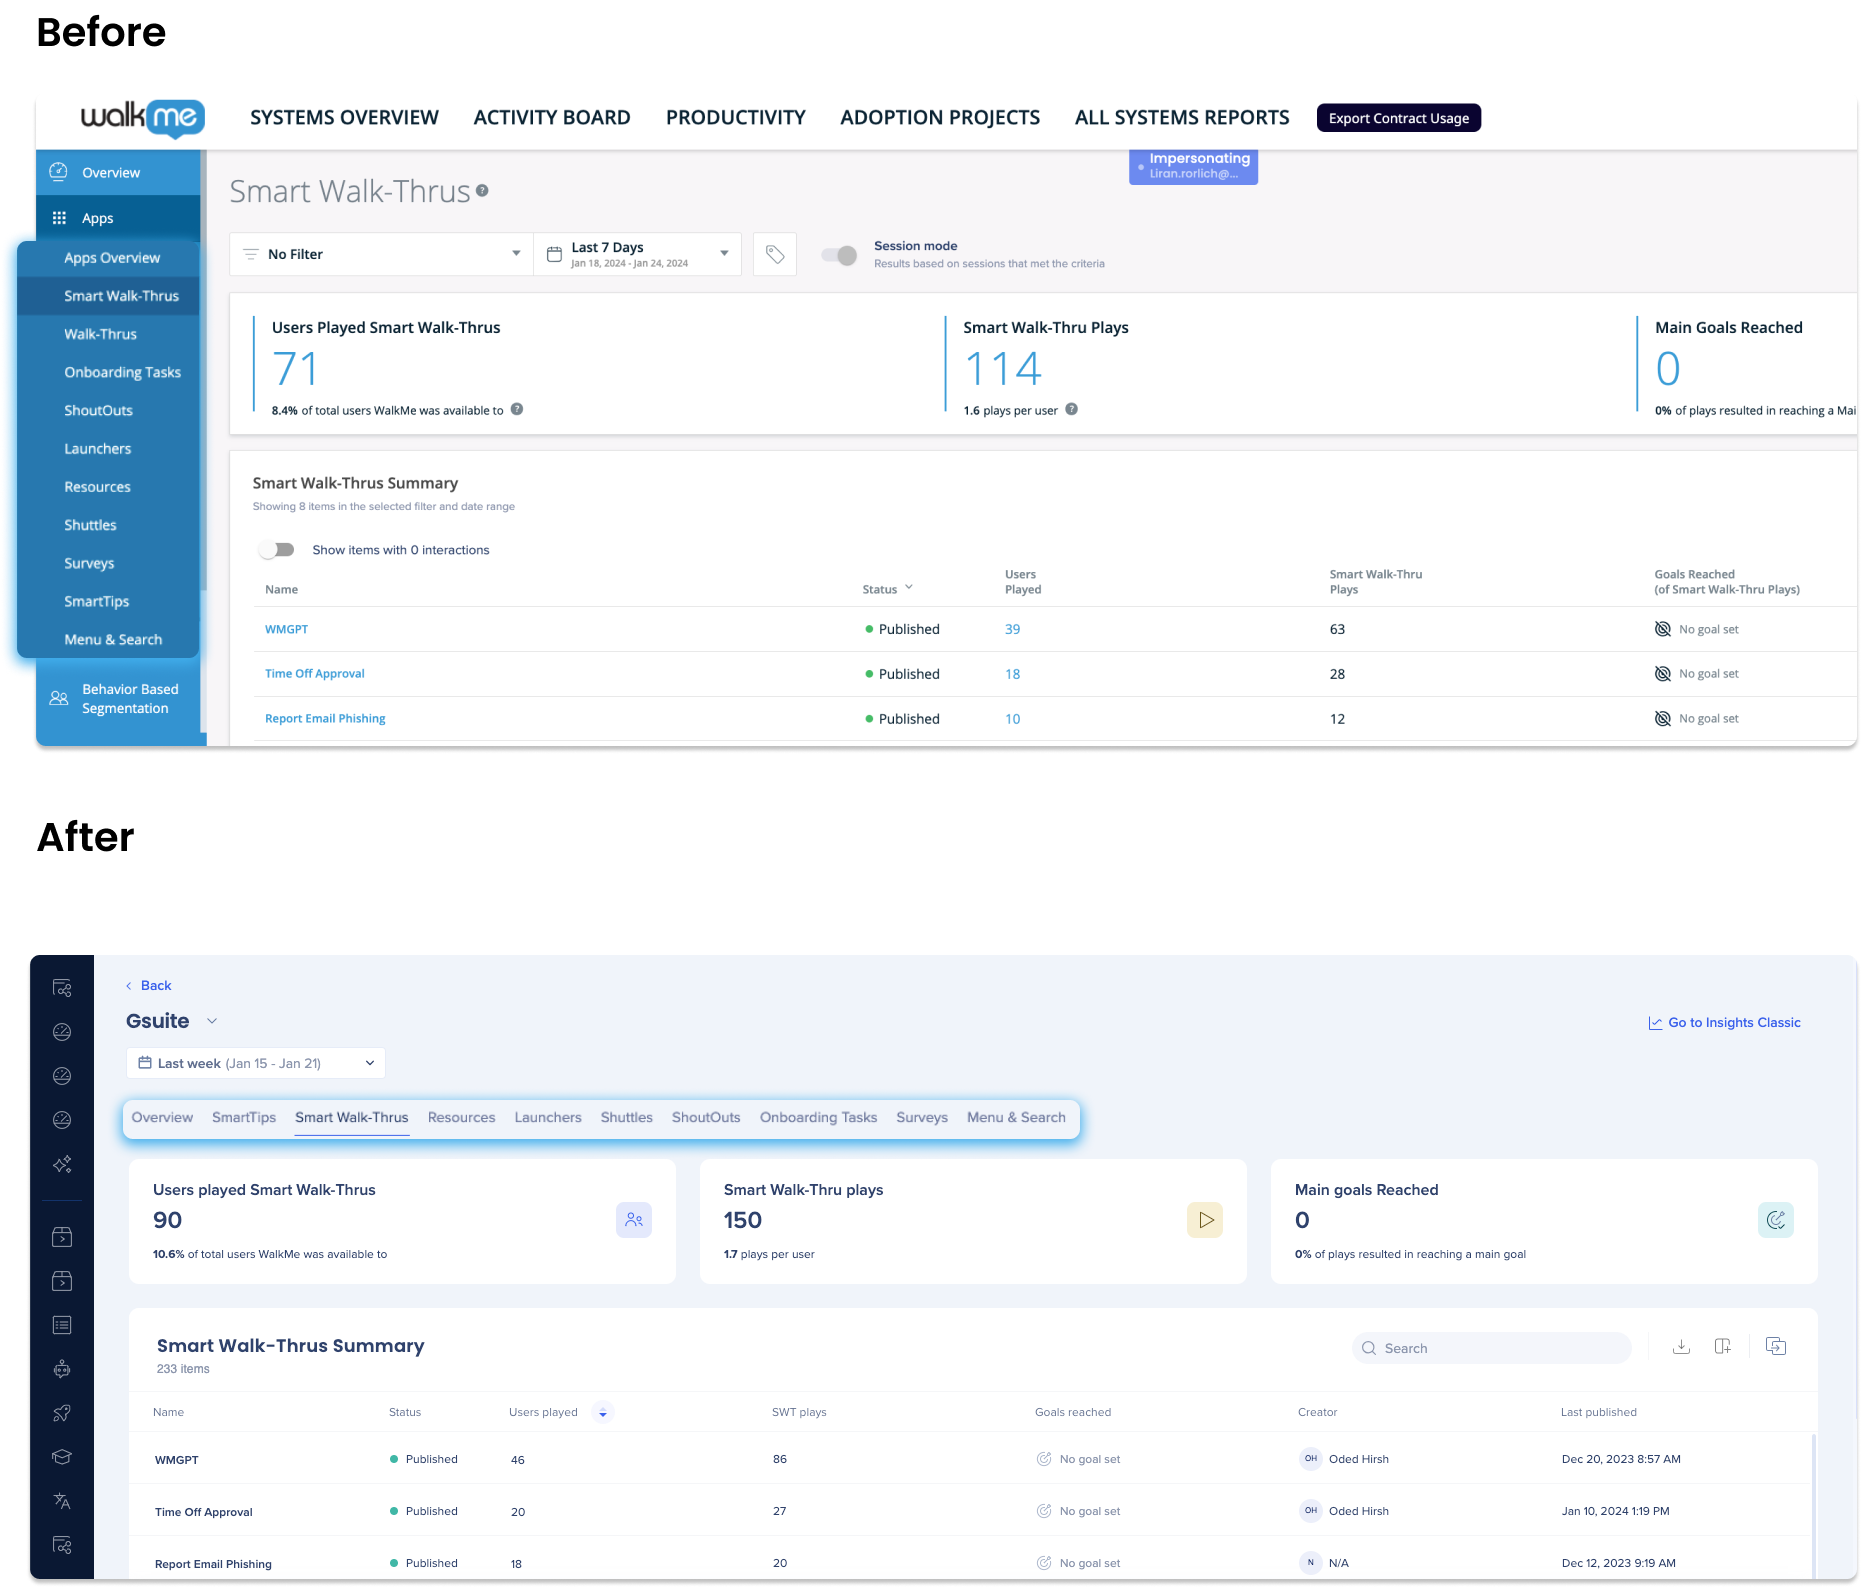
Apps Dashboards
The new design enables users to access the system overview and apps directly from the page through the use of tabs. This updated approach improves the user experience compared to the previous design where apps were accessed through a sidebar.
Reports
The Insights Reports page is a central hub, now located in the console, where you can conveniently review, export, and subscribe to Insights reports. By subscribing to a report, you can have a scheduled email sent to a recipient list of your choice.
- The new Reports Console allows Multi-system report building
Reports is composed of two sub-tabs:
-
Reports Gallery: Discover pre-built reports or create your own to export, edit, or subscribe to
-
Exports & Subscriptions: View and download generated reports and manage subscriptions

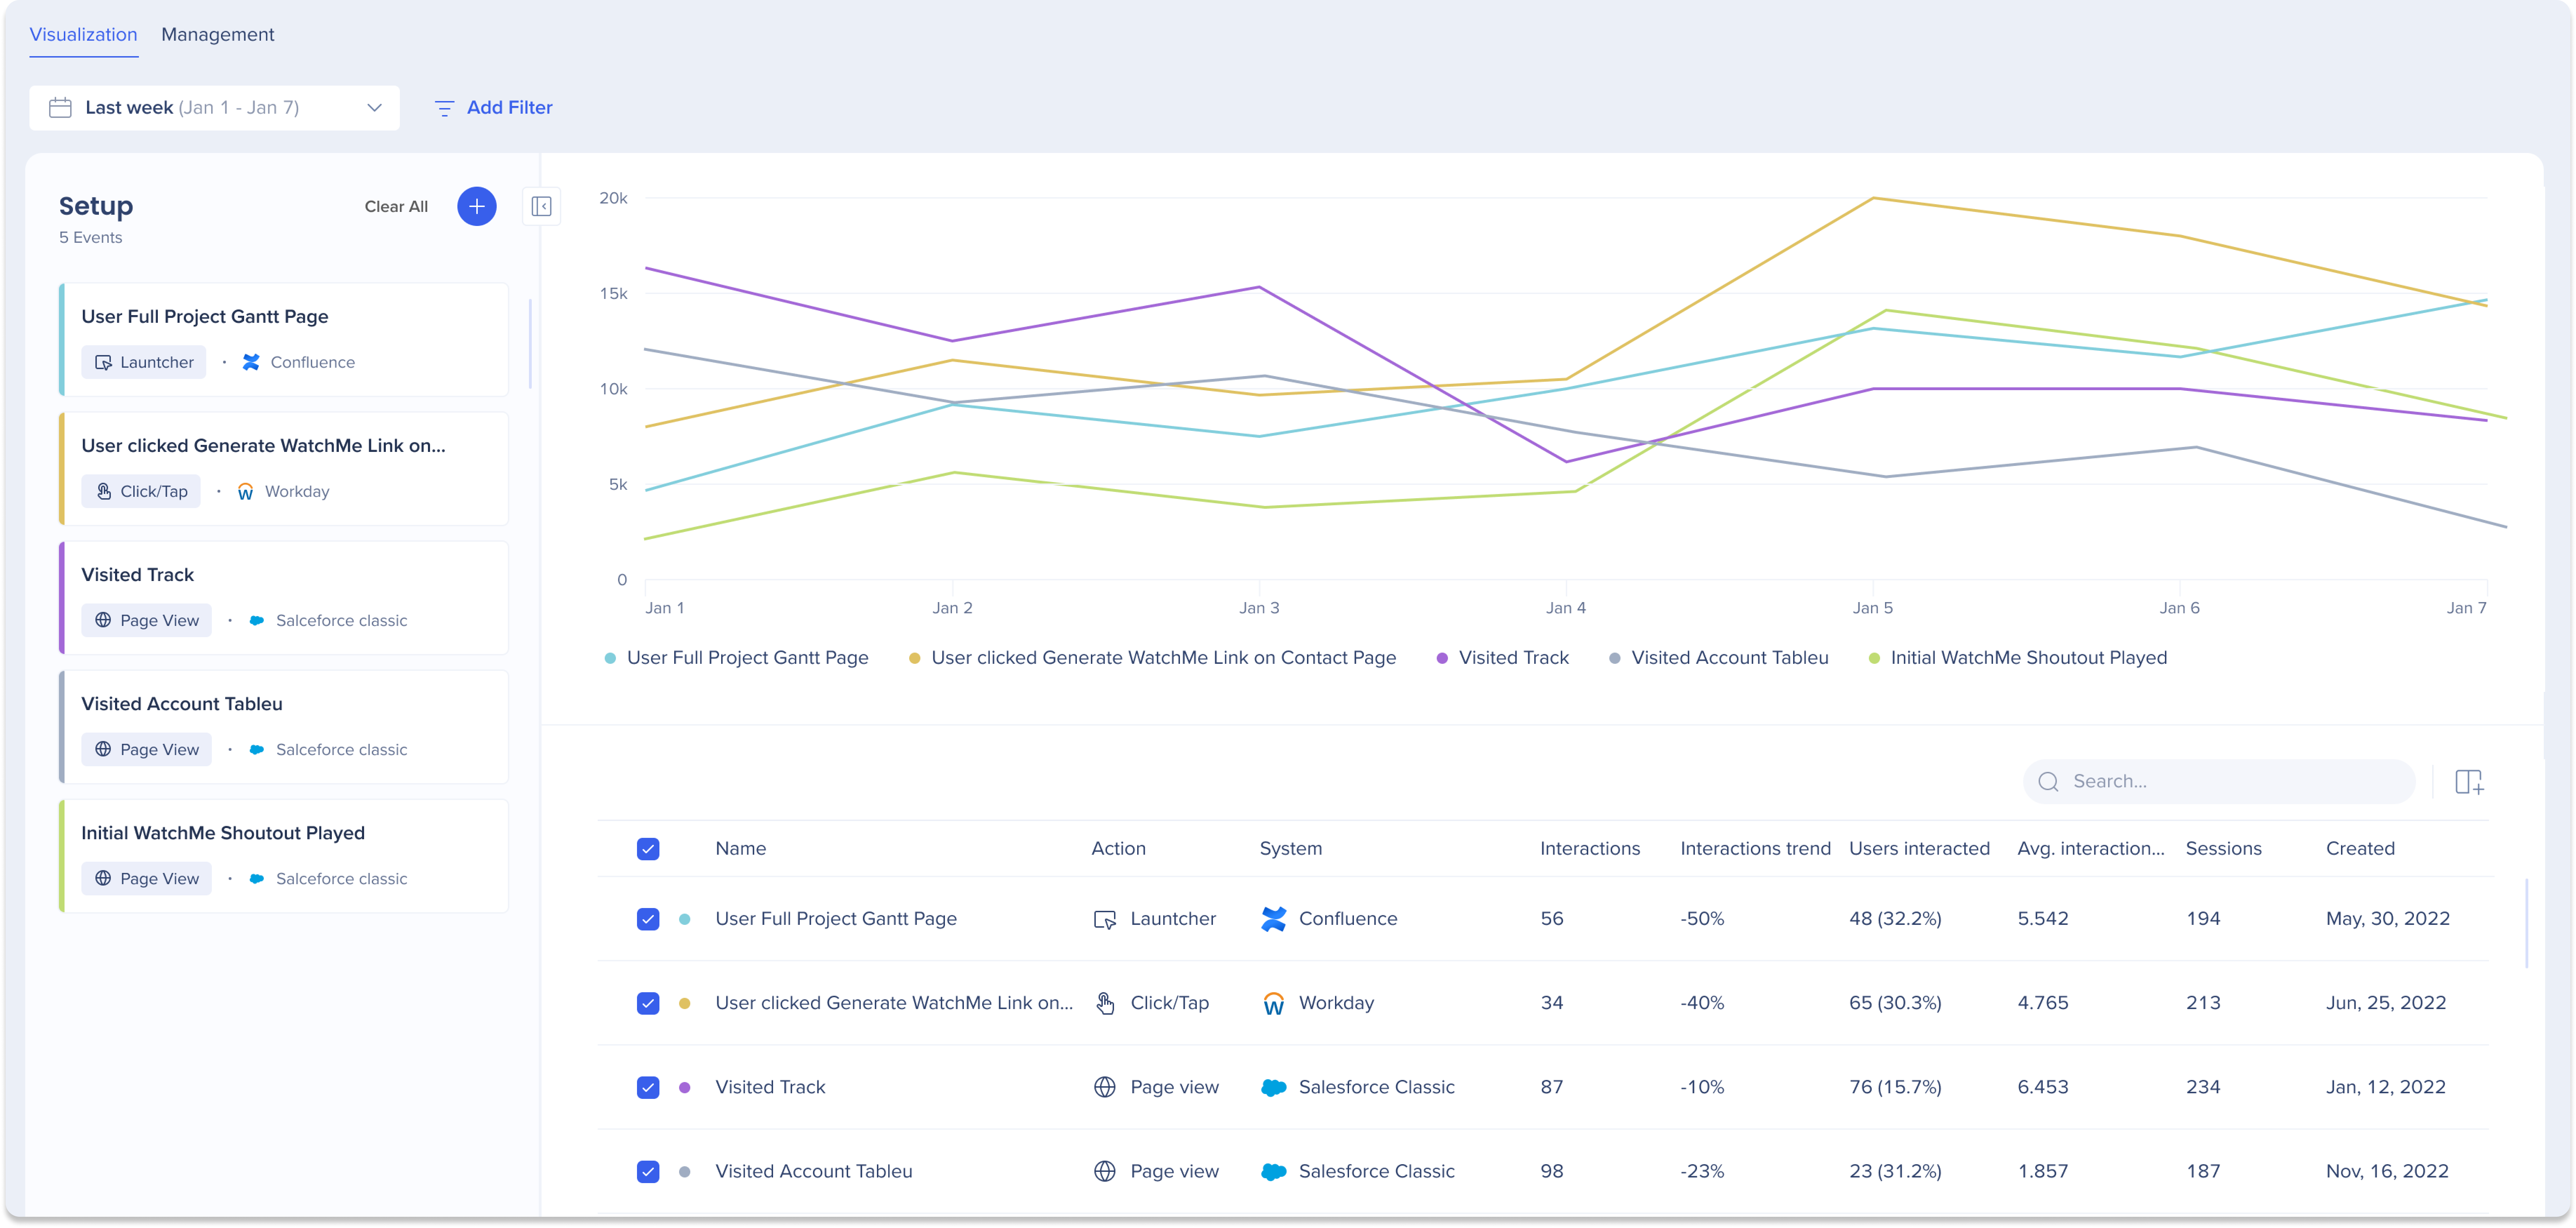
Events
The new Events page in the WalkMe Console, helps users manage and track their Tracked Events and Engaged Elements all from one page. Users can view a global list of their events, as well as create new events via custom setup or capturing, making it easy to track user behavior and engagement on your website or application.
The Events page includes visualization tools that allow users to view up to 20 events in a table and line graph view with filters.
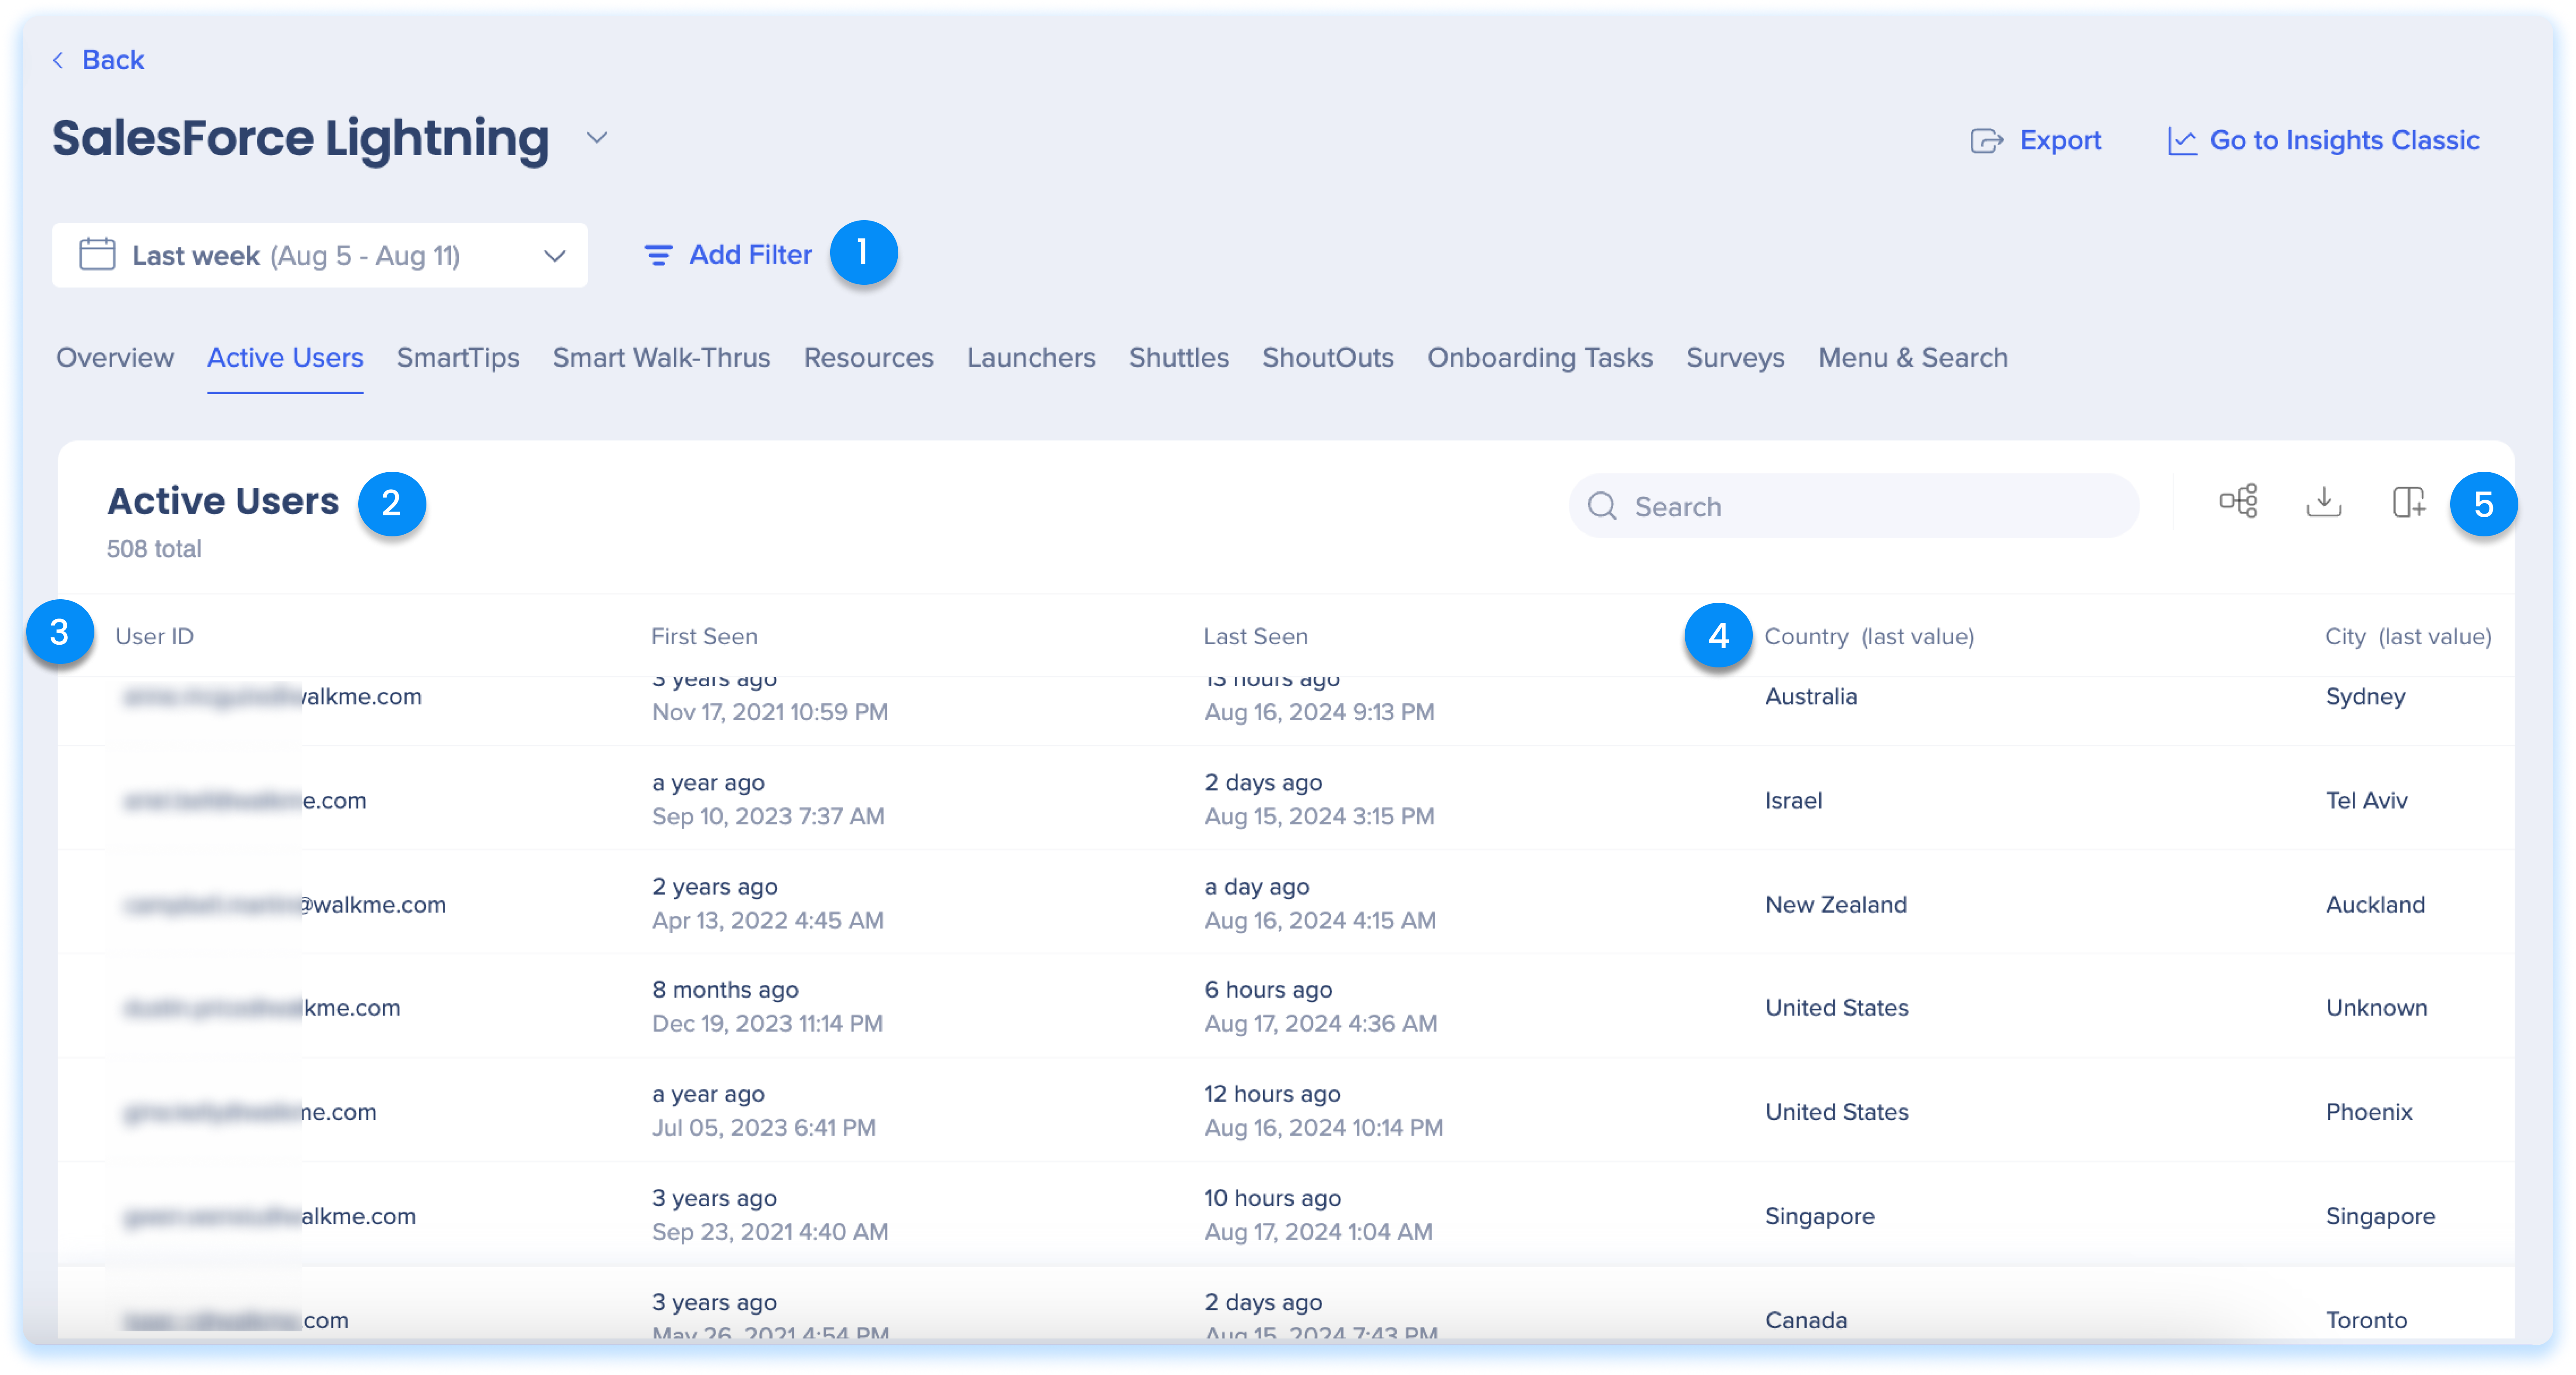
Active Users Tab
The Active users tab is no longer a page but a tab within a system overview. It gives you valuable insights into the user activity on your website. It provides a comprehensive list of users who visited your site while WalkMe was active, regardless of whether they interacted with a WalkMe item. It allows you to understand the number of users to whom WalkMe was available to and their demographics.
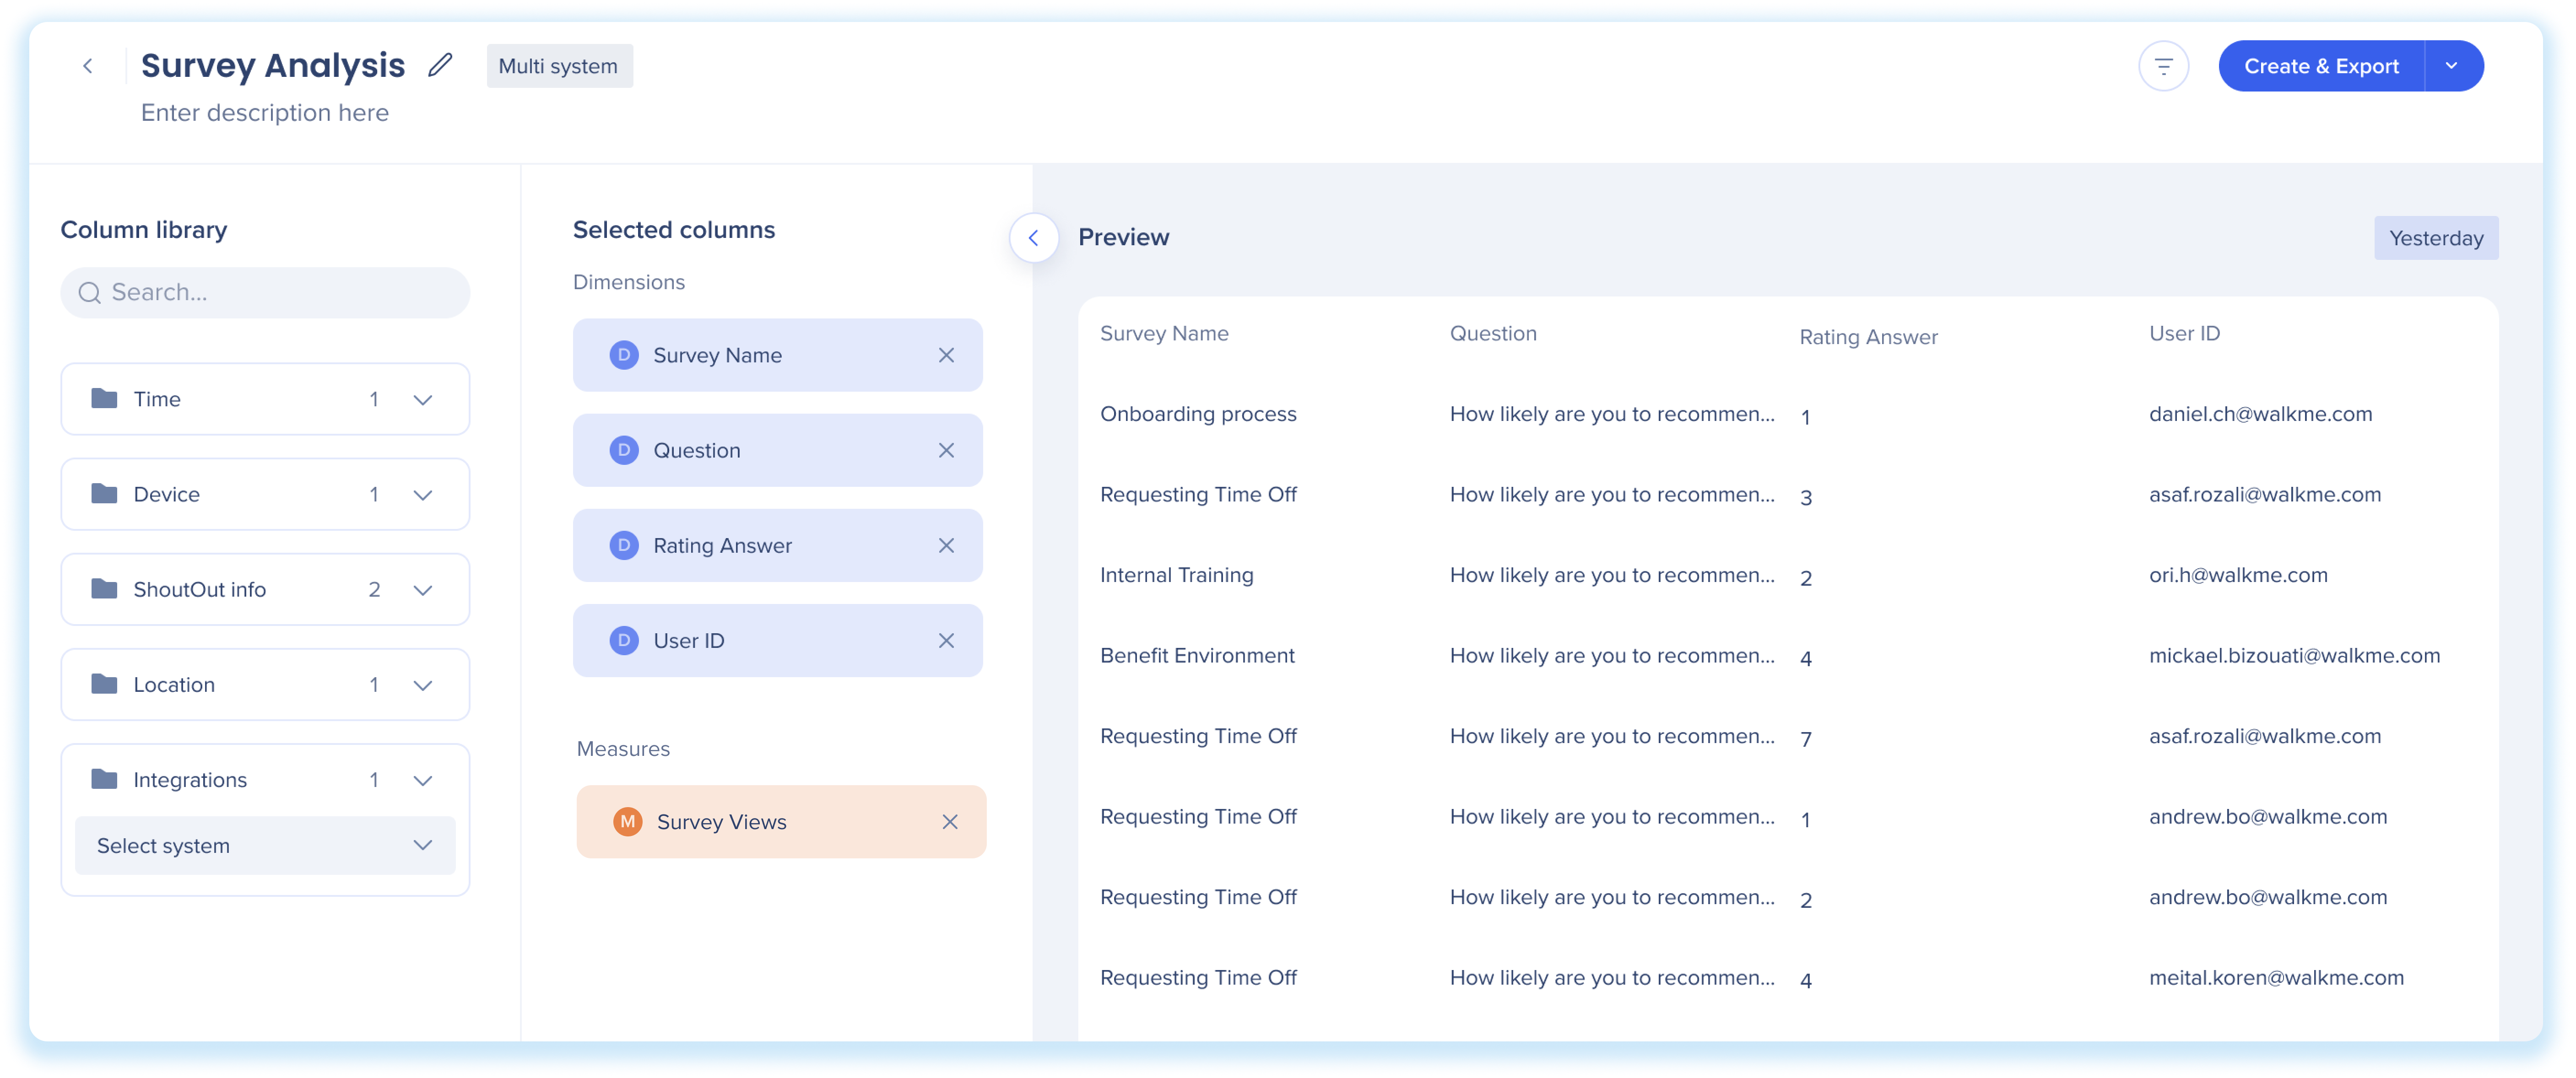
Report Builder
The Report Builder guides you through the process to create your own customized reports, beginning with choosing a template that best suits your needs, and then offering additional columns and filters for data enhancement.
The Insights Console report builder also allows you to create multi-system reports and view reports according to a specified environment.
New Features
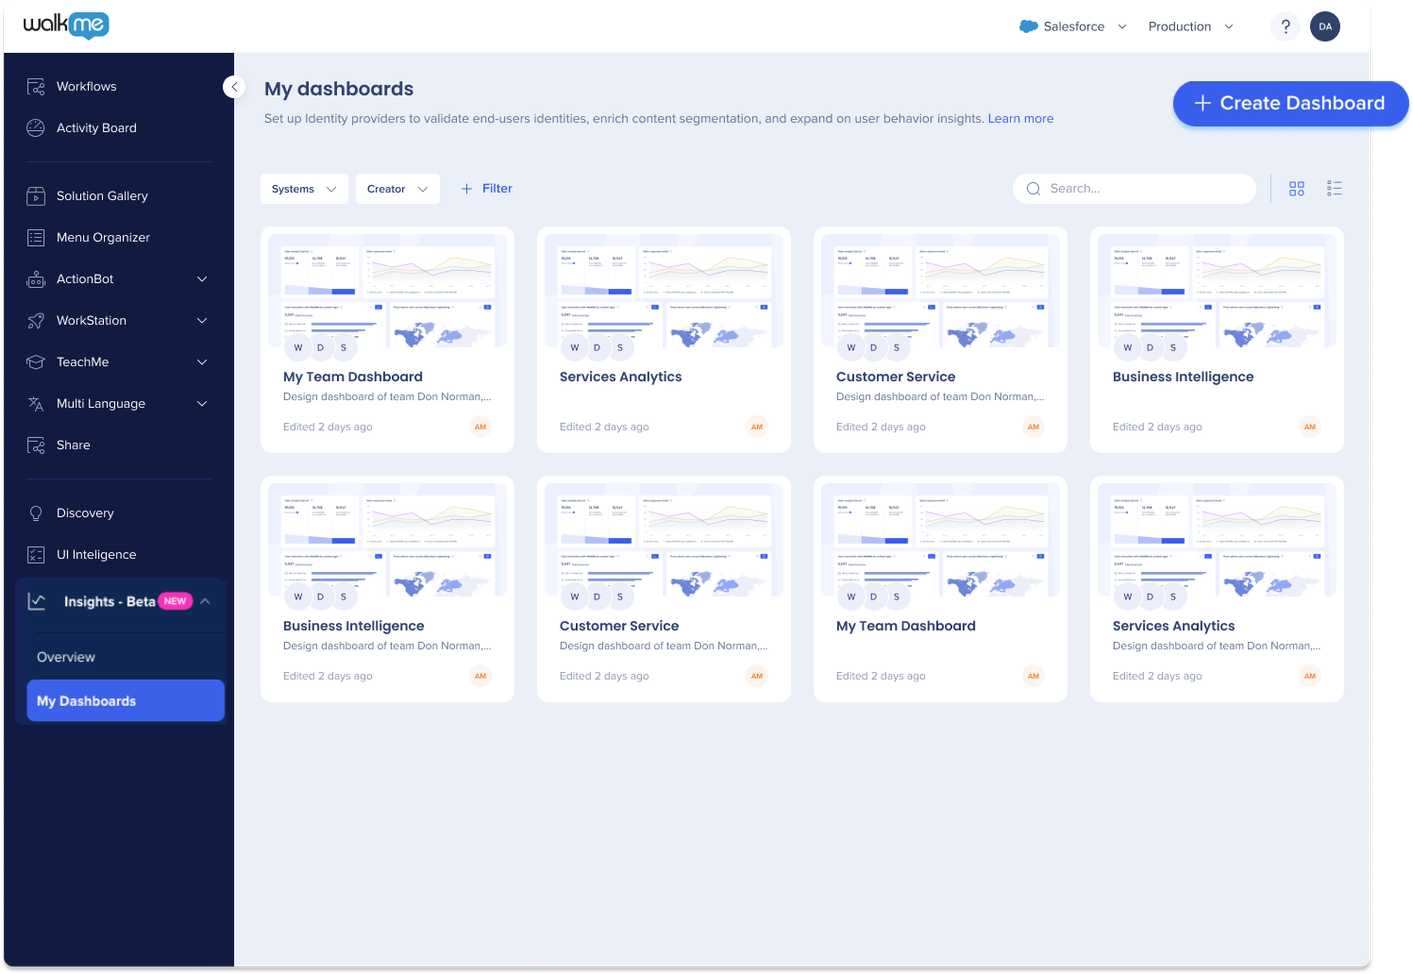
Custom Dashboards & Widgets
Custom Dashboards page allows users to create their own custom dashboard. With this feature, users can add metric widgets from different systems to create unique insights dashboards. This allows users to tailor their dashboard to their specific needs and preferences. The Custom Dashboards page is a valuable tool for those who want a more personalized and efficient way to monitor their metrics and gain insights.
NEW! Users can now create custom widgets for their dashboards. Users can decide exactly what should be shown in the custom widget allowing them to filter out unnecessary information and highlight only what's matter to them.
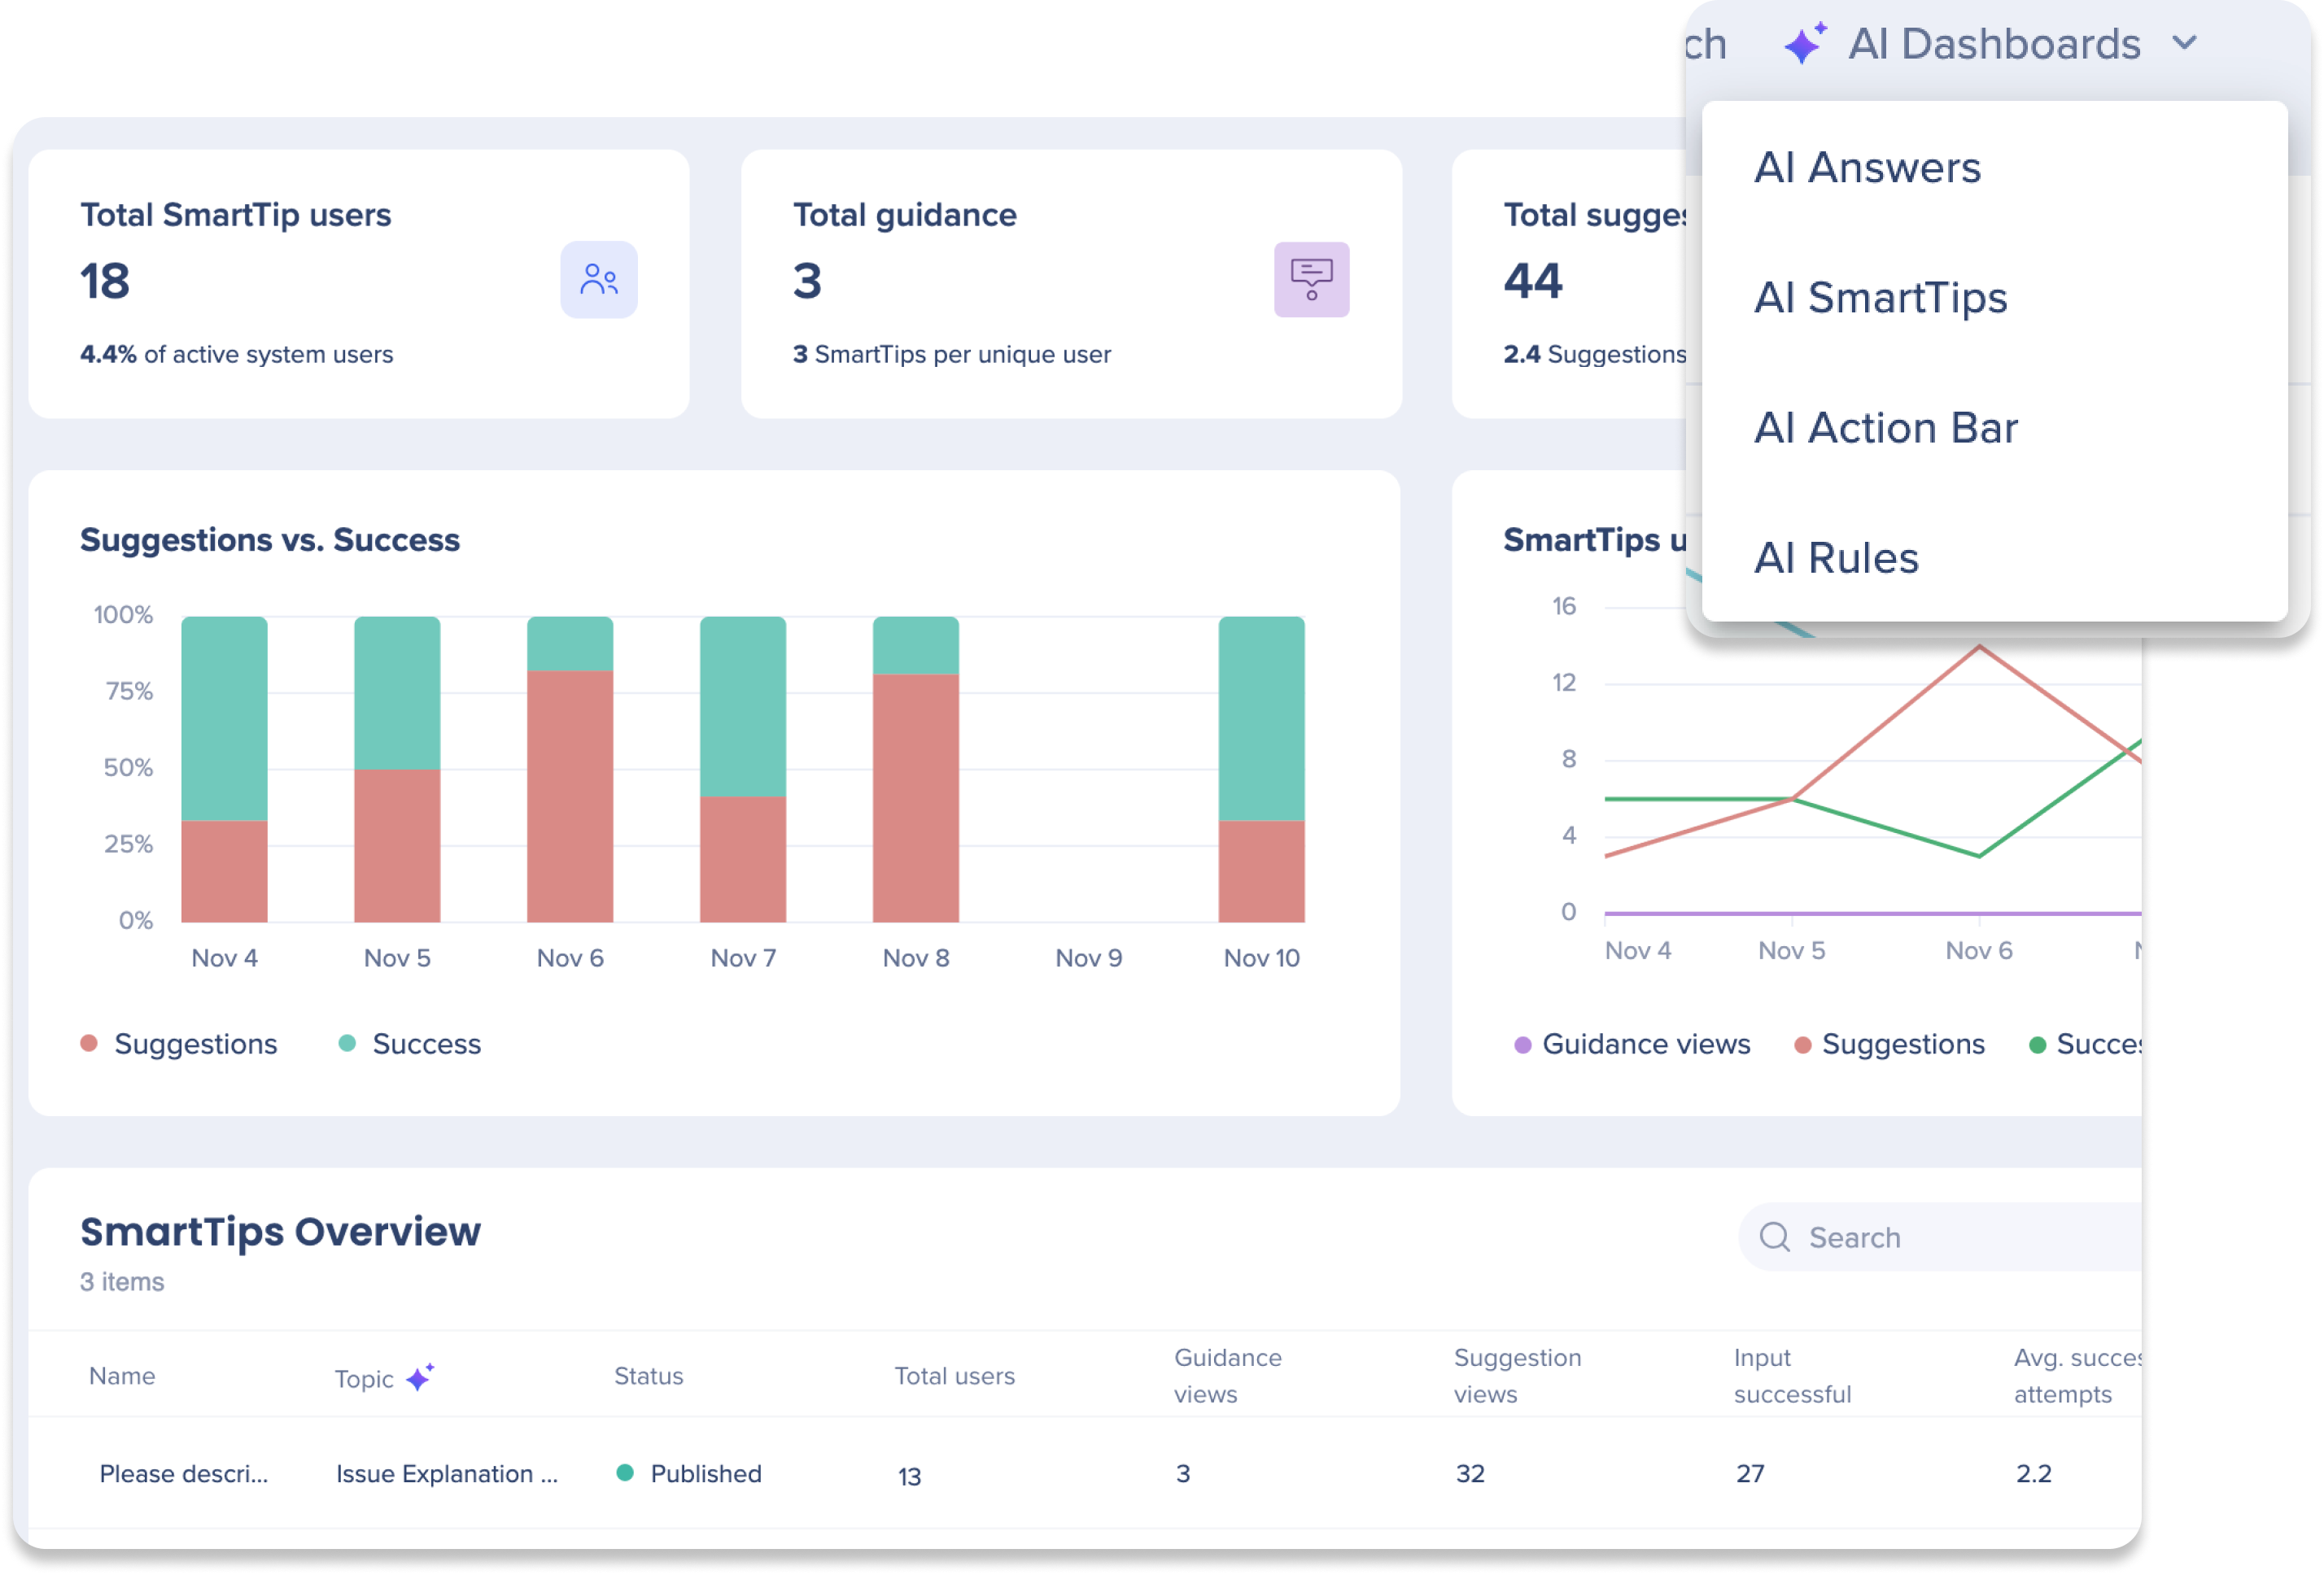
AI Dashboards
The AI Dashboards in the Insights Console provide comprehensive visibility into the usage and adoption of AI products within your workflow. These dashboards feature up to four tabs, each dedicated to a specific WalkMe AI product: AI Answers, AI Action Bar, AI SmartTips, and AI Rules. The tabs you receive depend on your AI package.
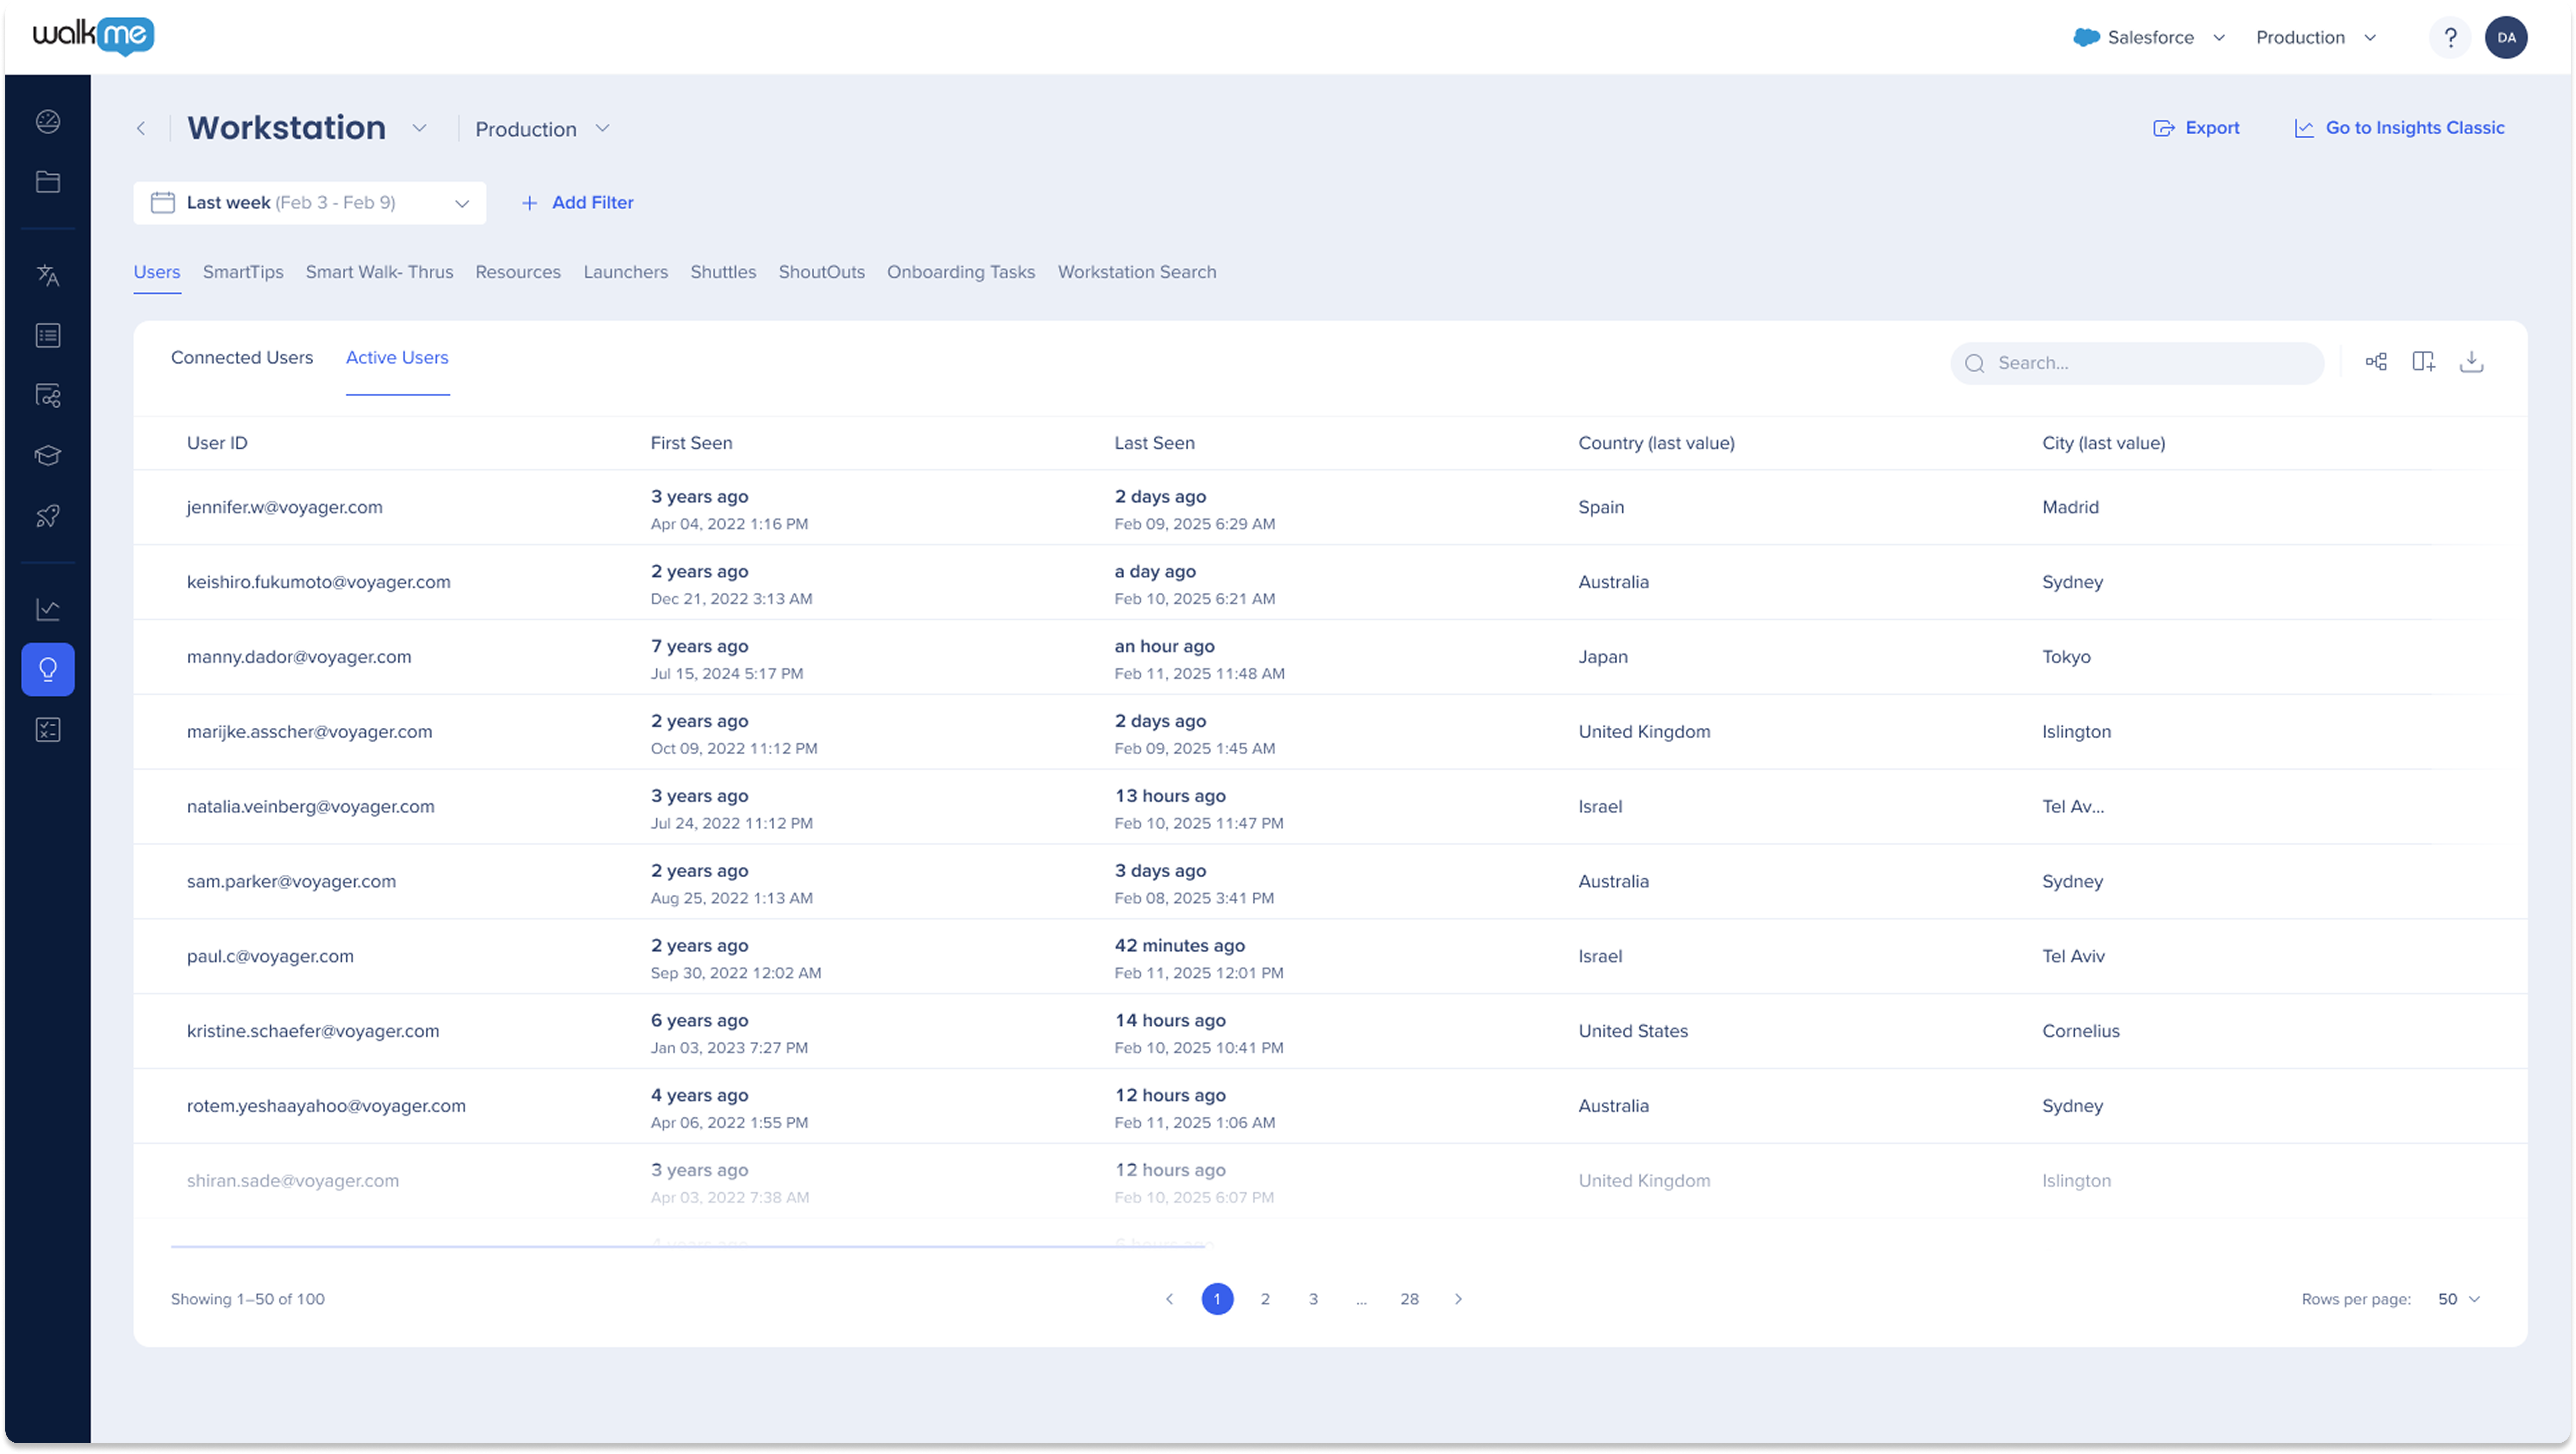
Workstation Analytics
Workstation analytics in the apps tabs provides enhanced control and deeper insights into Workstation usage data for Workstation builders and DAP professionals. Check out the Insights Apps Tabs article to learn about differences for the Workstation system analytics in Insights.
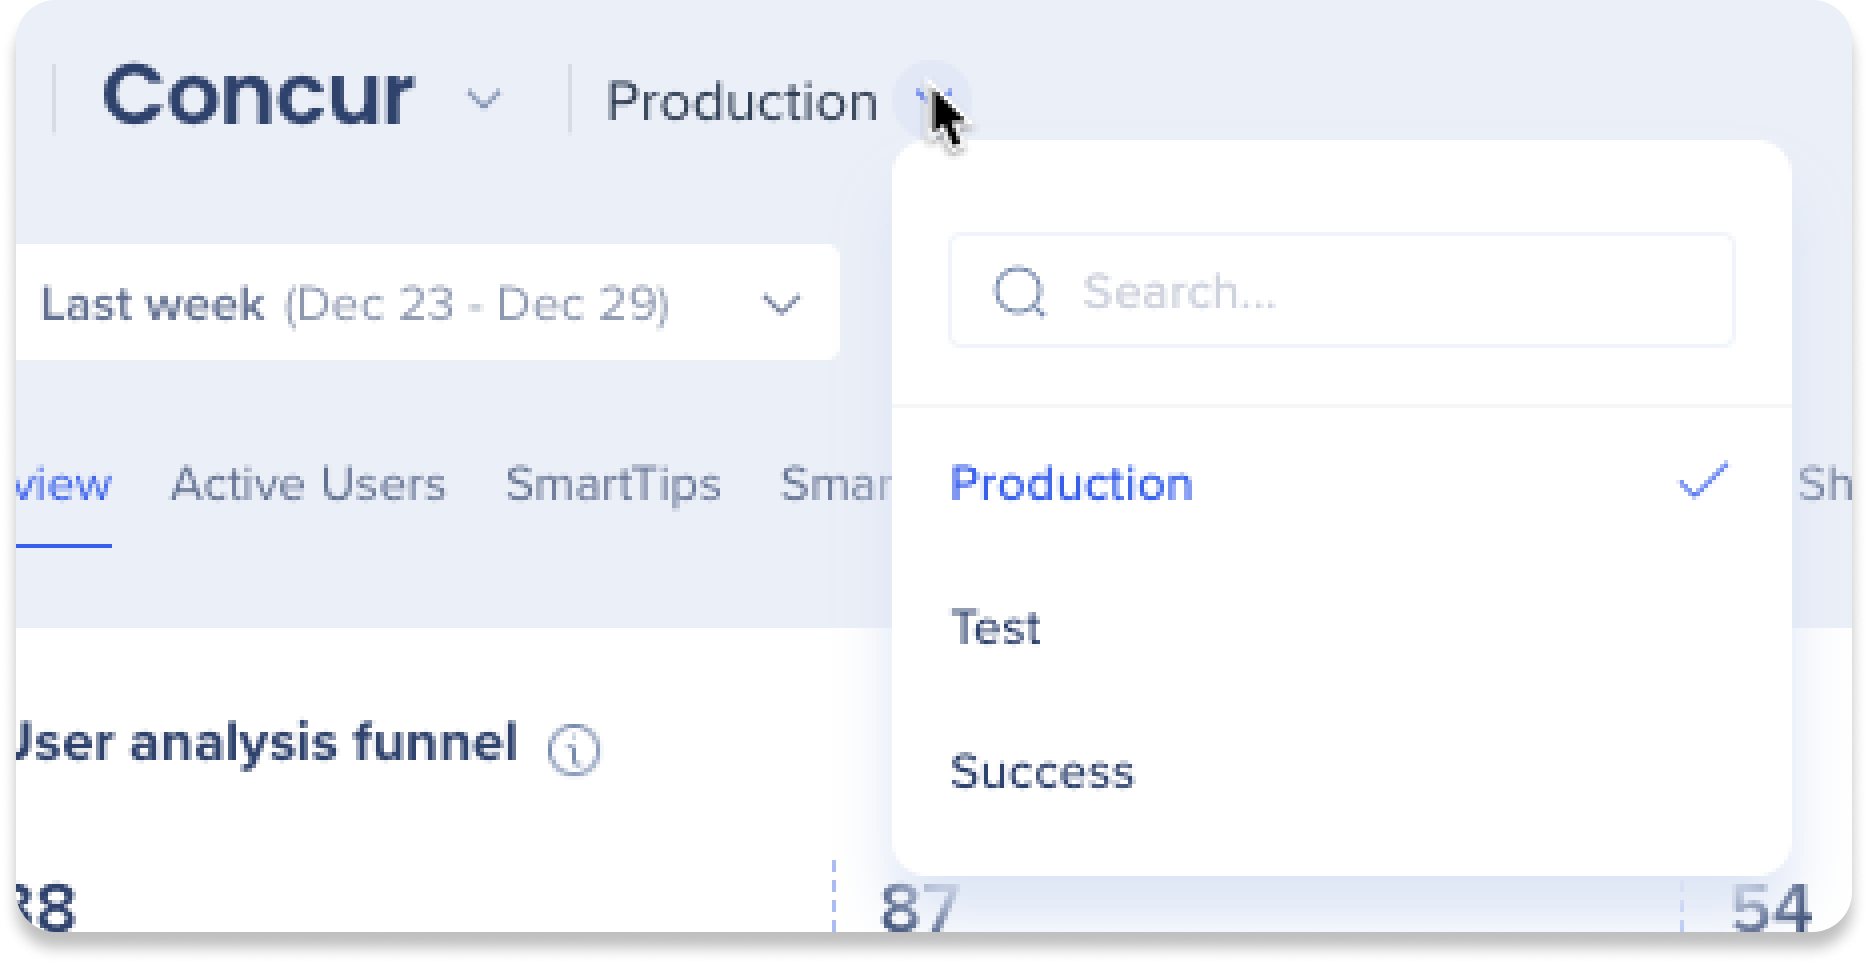
Environment Dropdown
The environment dropdown allows users to filter and view data for a specific environment on the system dashboards, helping them analyze and manage each environment separately.
Tip Tuesday Video
Technical Notes
-
No Mobile Web support
-
The data displayed relates only to the Desktop (main) platform
-
- Insights only officially supports Chrome
- It may work on other browsers but is not officially supported
- Data for deleted sub-items is not supported and won't be shown anywhere in Insights Console
- For example: SmartTip in a SmartTip set, SWT step in a SWT, question in a Survey... etc
- English, Japanese, German, and French are supported
-
When a user is added or removed from the system, it may take up to five minutes to reflect in the Insights Console
-
Unlike Insights Classic, Timezone selection is not supported in the Insights Console
-
All data is based on the UTC +00 timeframe
-