Brief Overview
Custom reports allow you to follow your users' behavior from within the app. Giving you the ability to export to an excel format document with all the necessary analytics properties regarding your app and its users' behavior, including tracked events reached, time spent on the app screens, common campaign actions and more.
Reports are enabled through the mobile back office in the app level. Please contact your WalkMe Mobile representative to enable reports.
For a detailed glossary of all the parameters inside the reports:
Mobile: Reports Glossary
Use Cases
- Analyze your app's activities in a more raw data format or using external tools
- Collaborate Mobile reports with more people, including those who are not WalkMe Mobile users
- Analyze your users' behavior and create new campaigns based on that data
Report Types
Walk-Thru Steps Funnel
Provides data on how many users were exposed to each step and out of them how many interacted with that step in a specific Walk-Thru.
Average Time on Screen
Provides data on what is the average time users spend on each captured screen inside an app.
Tracked Events Funnel
Provides data on how many users reach event number two out of the user who reached event number one within a day or a session.
Tracked Events Reached after Campaign
Provides data on how many users reach the chosen event after they interacted with the chosen Campaign, it will show you the breakdown of the users according to the Campaign's actions.
Campaign Action Breakdown
Provides impression and click data on how many users interacted with a Campaign's Action.
Survey Raw Data Response
Shows all the responses for a specific survey.
Survey Response
Displays a summary view of the average responses of a specific survey, in an overview format.
App Users who Reach a Tracked Event
Provides data on how many users reach a specific event during a chosen time period.
All Tracked Events Reached Count
Provides data on how many Events were reached in total during a chosen time period.
Time Elapsed When Campaign Was Seen
Provides time a campaign was seen in a given session. Useful for determining length of an onboarding process for comparison against traditional methods.
Users per App Version
Provides a breakdown of number of users per app version.
Users Permissions Status
Provides a breakdown of number of users with each permission enabled. Permissions include push notifications, contacts, location and camera.
A/B Testing Campaign Engagement
Provides a breakdown of campaign engagement and compares the impressions/clicks between the campaigns of each A/B test.
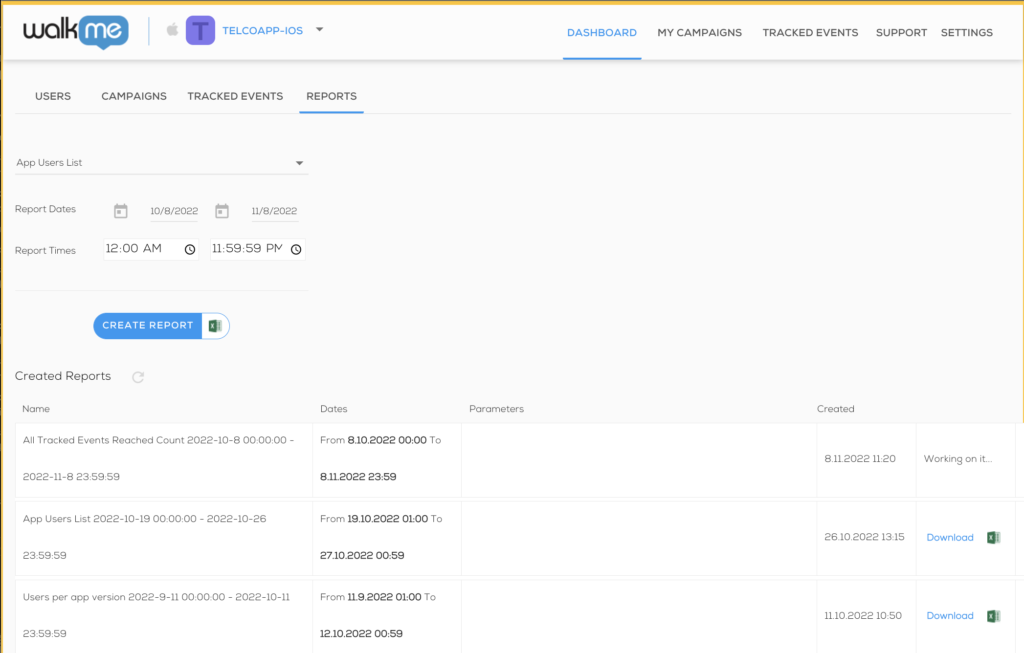
Generating a Report
Mobile Reports must be created for each app.
There are several different report types available and to generate a specific report type different information must be provided.
For instance, the Walk-Thru Steps Funnel report requires that you select a date range, a Walk-Thru name, and an App Version, whereas the Average Time on Screen report only requires that you select a date range.
Note
The report date range is limited to 30 days.
Once you have chosen which type of Report you wish to create and have provided the required information, click the CREATE REPORT button, and wait for the email confirmation that your report is available. Once it is available, the report will appear in the REPORTS Tab.
Larger report files (>500k rows) will be separated into separate files in a zip folder.
Technical Notes
Adjusting Impressions Count
-
The total impressions count in the mobile reports can differ from the one in the mobile console because, by default, the impressions count method includes non-visible steps. This means that even steps that are not visible to the user are counted in the total impressions. On the other hand, the frequency count method considers only the steps that are visible to the user
-
If you prefer to count only the visible steps in the impressions, this method can be changed on a per-app basis. This adjustment ensures that the impressions count reflects only the steps that users can actually see, providing a more accurate measure of user engagement


