Tracked Events Dashboard Insights Classic
Brief Overview
The Tracked Events dashboard enables you to discover how users interact with a platform over time and monitor the engagement with data like the top, recently added or specific Tracked Events. On the dashboard you are able to:
- Track users for further analysis and targeting (marketing, product)
- Track feature adoption and engagement over time
- Export a user list based on the defined Tracked Event to integrate with other tools for targeting
Use cases
- Track feature adoption and engagement over time
- Analyze usage and target users (marketing, product, Account management)
Tracked Events Dashboard Breakdown
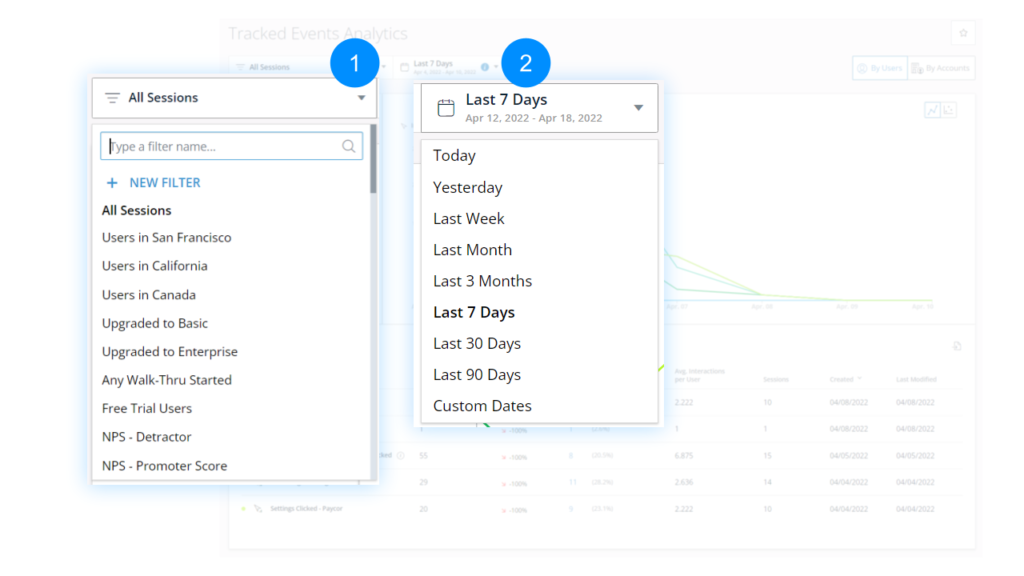
Tracked Events Filters and Date Range
- Session Filters
- You can select a filter to only display Tracked Events that match the sessions.
- Date Range
- Select the date range to display Tracked Events that happened during that time period.
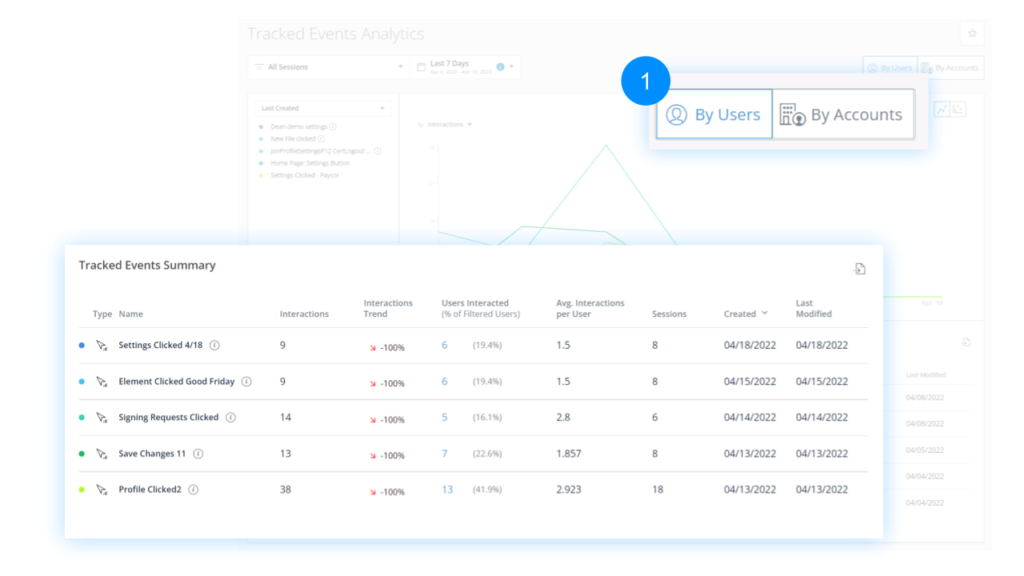
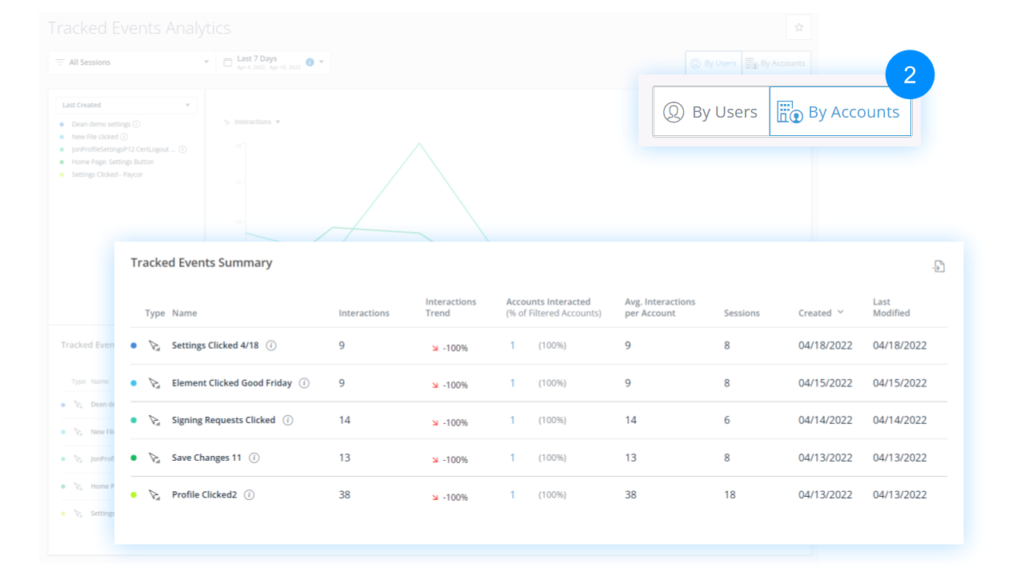
Users and Accounts Toggle
This toggle defines the granularity level of the data displayed on the page.
- By Users View
- When Users is selected, the metrics (Users Interacted, Interactions per User) are displayed on the user level.
- To learn more about how a User is being identified, please refer to the Unique Users Settings article.
- To learn more about how a User is being identified, please refer to the Unique Users Settings article.
- When Users is selected, the metrics (Users Interacted, Interactions per User) are displayed on the user level.
- By Accounts View
- When Accounts is selected, the metrics (Accounts Interacted, Interactions per Account) are displayed on the account level.
- To learn more about configuring Account-based analytics, please refer to the Account Based Analytics article.
- To learn more about configuring Account-based analytics, please refer to the Account Based Analytics article.
- When Accounts is selected, the metrics (Accounts Interacted, Interactions per Account) are displayed on the account level.
Tracked Events Selector
The selector allows you to control which Tracked Events are displayed on the page, both in the chart and the table.
- In the dropdown, you can select between predefined sets of Tracked Events or a custom selection.
- Last Created is the default view and will display the 5 Tracked Events with the most recent creation time.
- The creation time is absolute and does not take filters into account.
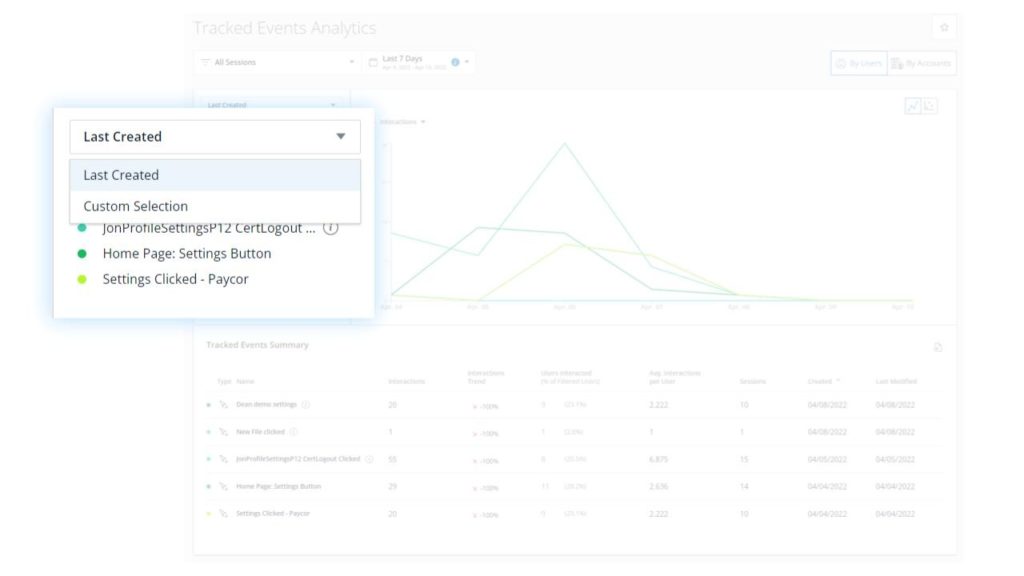
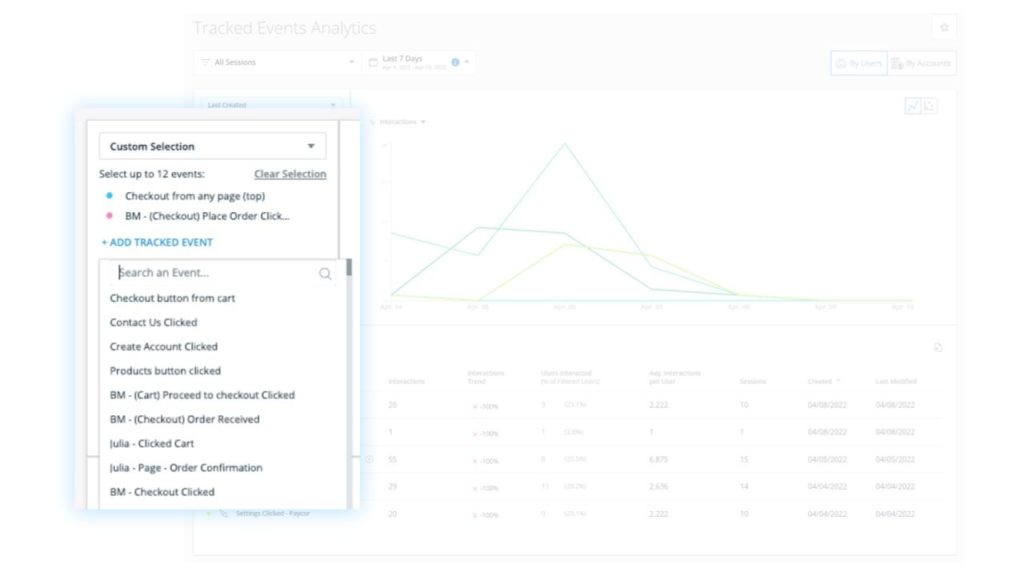
- Custom Selection offers a custom view that can be set manually
- You can select up to 12 Tracked Events
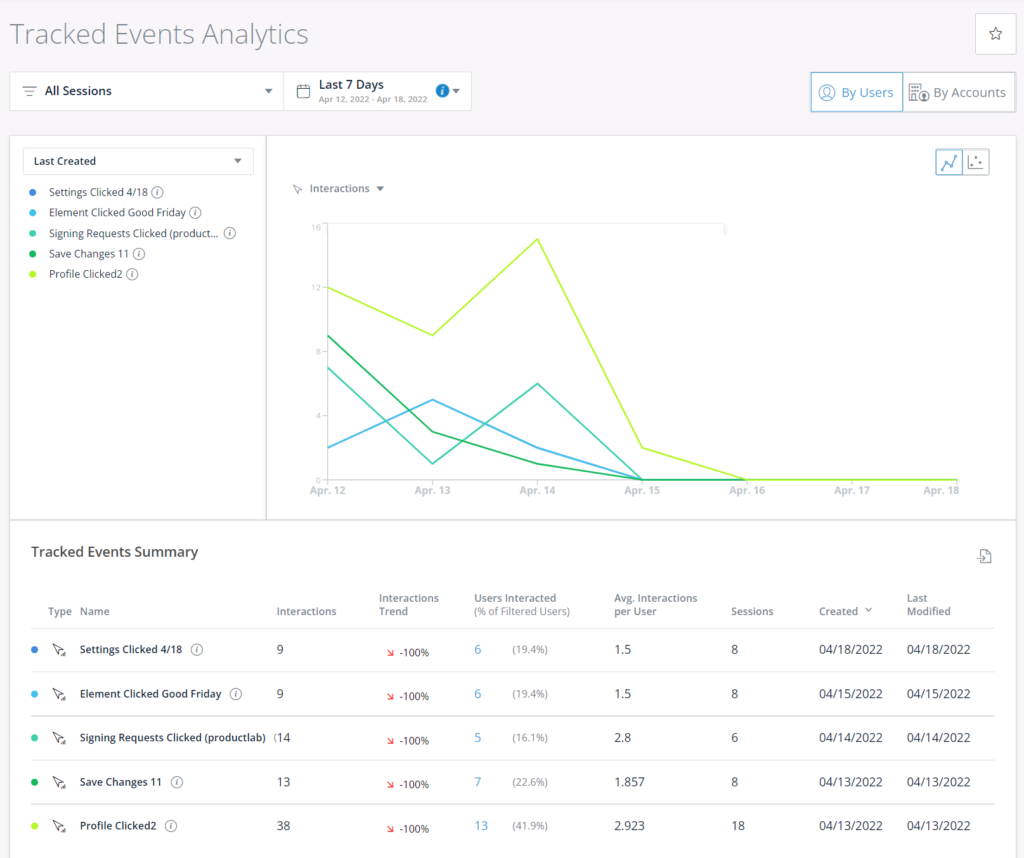
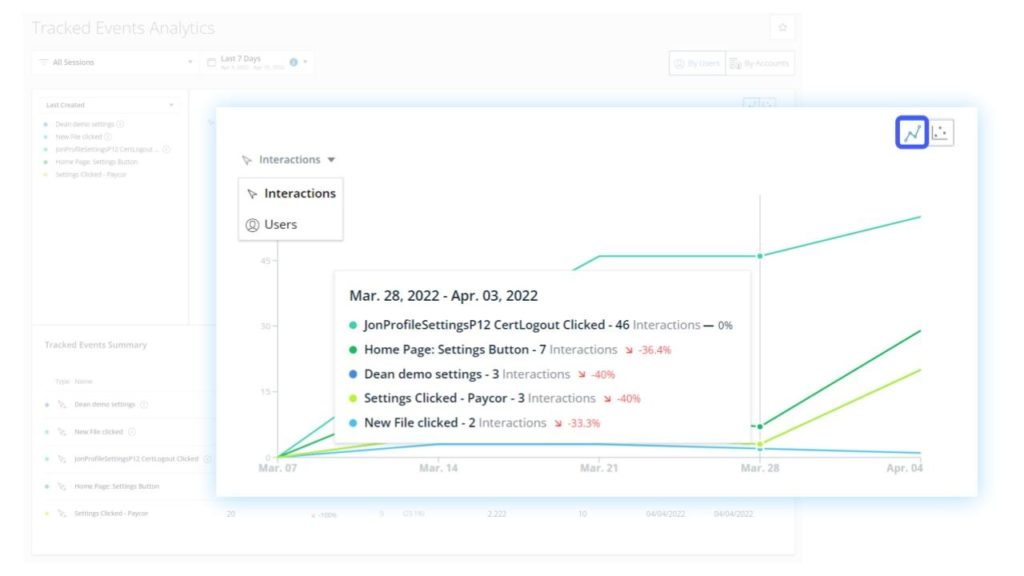
Trend Graph
Many times a tracked event represents a feature. By using this matrix it is possible to tracks user adoption - the number of users who have used the tracked event / feature at least one time, and engagement - the intensity and frequency of a users' usage of a tracked event/feature.
The default view is the Trend Graph.
- X-axis: Date
- Y-axis: Choice of two options:
- Interactions (default): The number of Tracked Events interactions for the selected date range
- Users / Accounts: The number of unique users/accounts (depends on the state of Users/Accounts toggle) who interacted with the TE through the selected date range
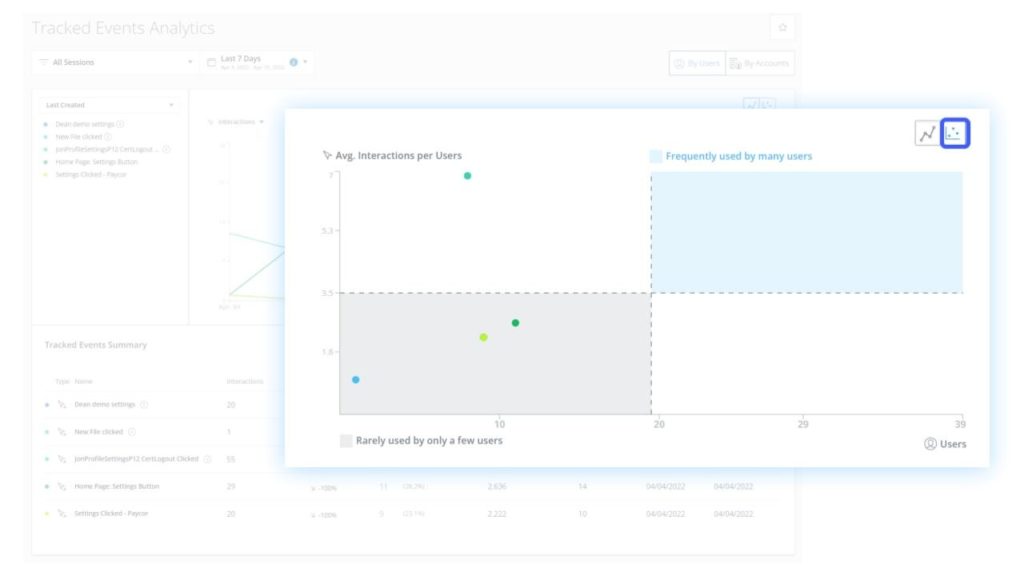
Scatter Plot
You can also toggle to view the data presented in a scatter plot.
- X-axis: Number of users who interacted with the Tracked Event
- Y-axis: Avg. interactions per user
Lower left quadrant
- Tracked events with few users who use the tracked event infrequently
- If a tracked event you want your users to use frequently sits here, consider how you can improve your promotion of this feature/tracked event.
- New features often sit in this quadrant for awhile before they are more widely adopted.
Upper left quadrant:
- Tracked events/ Features with few users, but who use the Tracked events/ Feature frequently.
- Features targeted to a specific segment of users should appear here.
Upper right quadrant
- Features with many users who use the Feature frequently.
- The key Features of your product should appear in this quadrant.
Lower right quadrant
- Features with many users, but who use the Feature infrequently.
- This quadrant will commonly house one-time Features, like creating an account, setting a password, etc.
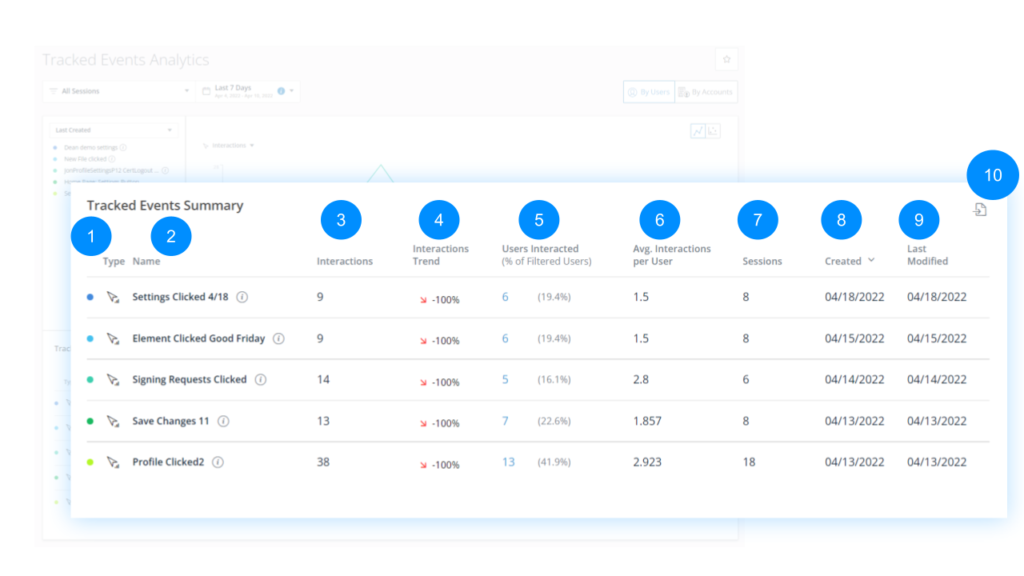
Tracked Events Summary
The table contains a summary of the Tracked Events that are selected in the Tracked Events Selector, with a row for each Tracked Event, and the following columns:
- Type
- Type of Tracked Event
- Name
- Tracked Event name
- Interactions
- Total number of interactions with the Tracked Event during the selected date range in the sessions that match the applied filter.
- Interactions Trend
- Indicates whether the # of interactions at the end of the date range is higher or lower than at the start, and how much.
- Users Interacted (% of Filtered Users)
- The number of users who interacted with this TE in the selected date range and the applied filter.
- In parenthesis: % of Users Interacted out of all users who fall under the applied filter in the selected date range.
- Avg. Interactions per User
- Interactions divided by Users Interacted.
- Sessions
- The number of sessions (All sessions, regardless of session playback with any interaction with this Tracked Event).
- Created
- The creation date of the Tracked Event.
- Last Modified
- The date the Tracked Eve Insert nt was last modified.
- CSV Download
- You can download the table directly to a CSV file by clicking the Export button above the table.
Limitations
General
- Custom selection is limited to a maximum of 12 Tracked Events.
- The selections made in the dashboard (filter, date range, Users/Accounts toggle, Tracked Events selection, y-axis metric) are reset to their default when the session is over.
- The Tracked Events selection is also reset to default (i.e. “Last Created” view) if a Tracked Event is edited, added or deleted in the Setup page.
- Tracked Events appear in the dashboard in their updated form, meaning:
- If a Tracked Event was deleted it will no longer appear on the dashboard.
- If a Tracked Event was renamed, the new name will be displayed.
- If Targeted Data Collection DXA is enabled and a Tracked Event's definition was edited, its data will reset and the collection will restart from zero at this point.
- Meaning, the Tracked Event will be displayed in the dashboard with zero interactions until this point and with the stats matching the new definition of the event starting from this point.
Metrics Calculation
- “Interactions Trend”:
(number of interactions in T2 / number of interactions in T1 - 1) * 100 [%]
Where in the chart (in the tooltip): T2 = the hovered data point, T1 = the previous data point,
And in the table: T2 = the end of the date range, T1 = the start of the date range
- If the number of interactions in T1 is zero, the Trend value is empty
The number of unique users who interacted with this TE in the selected date range and the applied filter
In brackets: <Users Interacted> / <number of all users who fall under the applied filter in the selected date range>
<Interactions> / <Users Interacted>
DXA Targeted Data Collection Level
- If you have DXA Targeted Data Collection level activated, then your screens will differ slightly.
- Due to full data not being collected until Tracked Events are defined, previewing data before a Tracked Event was defined is not possible.
-
- No collected sample data will be available to preview
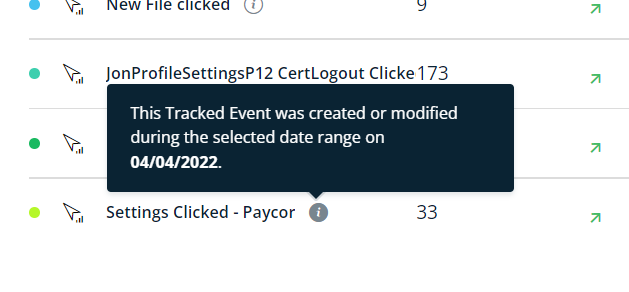
- If Targeted DXA is enabled, an "i" icon next to a Tacked Event name indicates that the Tracked Event was created or modified during the selected date range.
- Learn more about Insights Digital Experience Analytics (DXA) Level
- Learn more about Tracked Events