Phase 5: How to diagnose process bottlenecks using Flow Analytics
Flow Analytics helps you visualize sequential user behavior — showing how users move through multi-step processes, where they drop off, and the alternate paths they take when navigating a workflow. Unlike traditional analytics that track isolated events, Flow Analytics connects the dots, revealing the actual sequence of steps users take across pages, systems, and WalkMe content.
Flow Analytics works best for structured business processes with a clear start, middle, and end, where the order of steps matters. It's ideal for processes like onboarding, sales qualification, form submission, financial approvals, and other multi-page workflows. Flow Analytics is not designed for unstructured exploration or single-click analysis. Use it when you already know the sequential process you want to analyze and optimize.
Flow Analytics answers the critical question: Are users successfully completing the workflows that matter to our business? It's a powerful tool for understanding where processes break down and your proof point for demonstrating the measurable impact of your improvements.
Key capabilities:
- Connects events into flows: reveals the actual sequence of steps users take across pages, systems, or WalkMe content.
- Tracks process effectiveness: measures completion rates, drop-offs, and time between steps.
- Shows alternate paths: identifies the most common or most successful routes to process completion.
- Surfaces behavior differences: compare how user segments behave—by country, browser, device, role, or any property—to uncover patterns that influence completion and friction.
- Proves WalkMe impact: compares performance before vs. after deploying guidance or between users exposed vs. not exposed to WalkMe.
Key actions to set up a Flow:
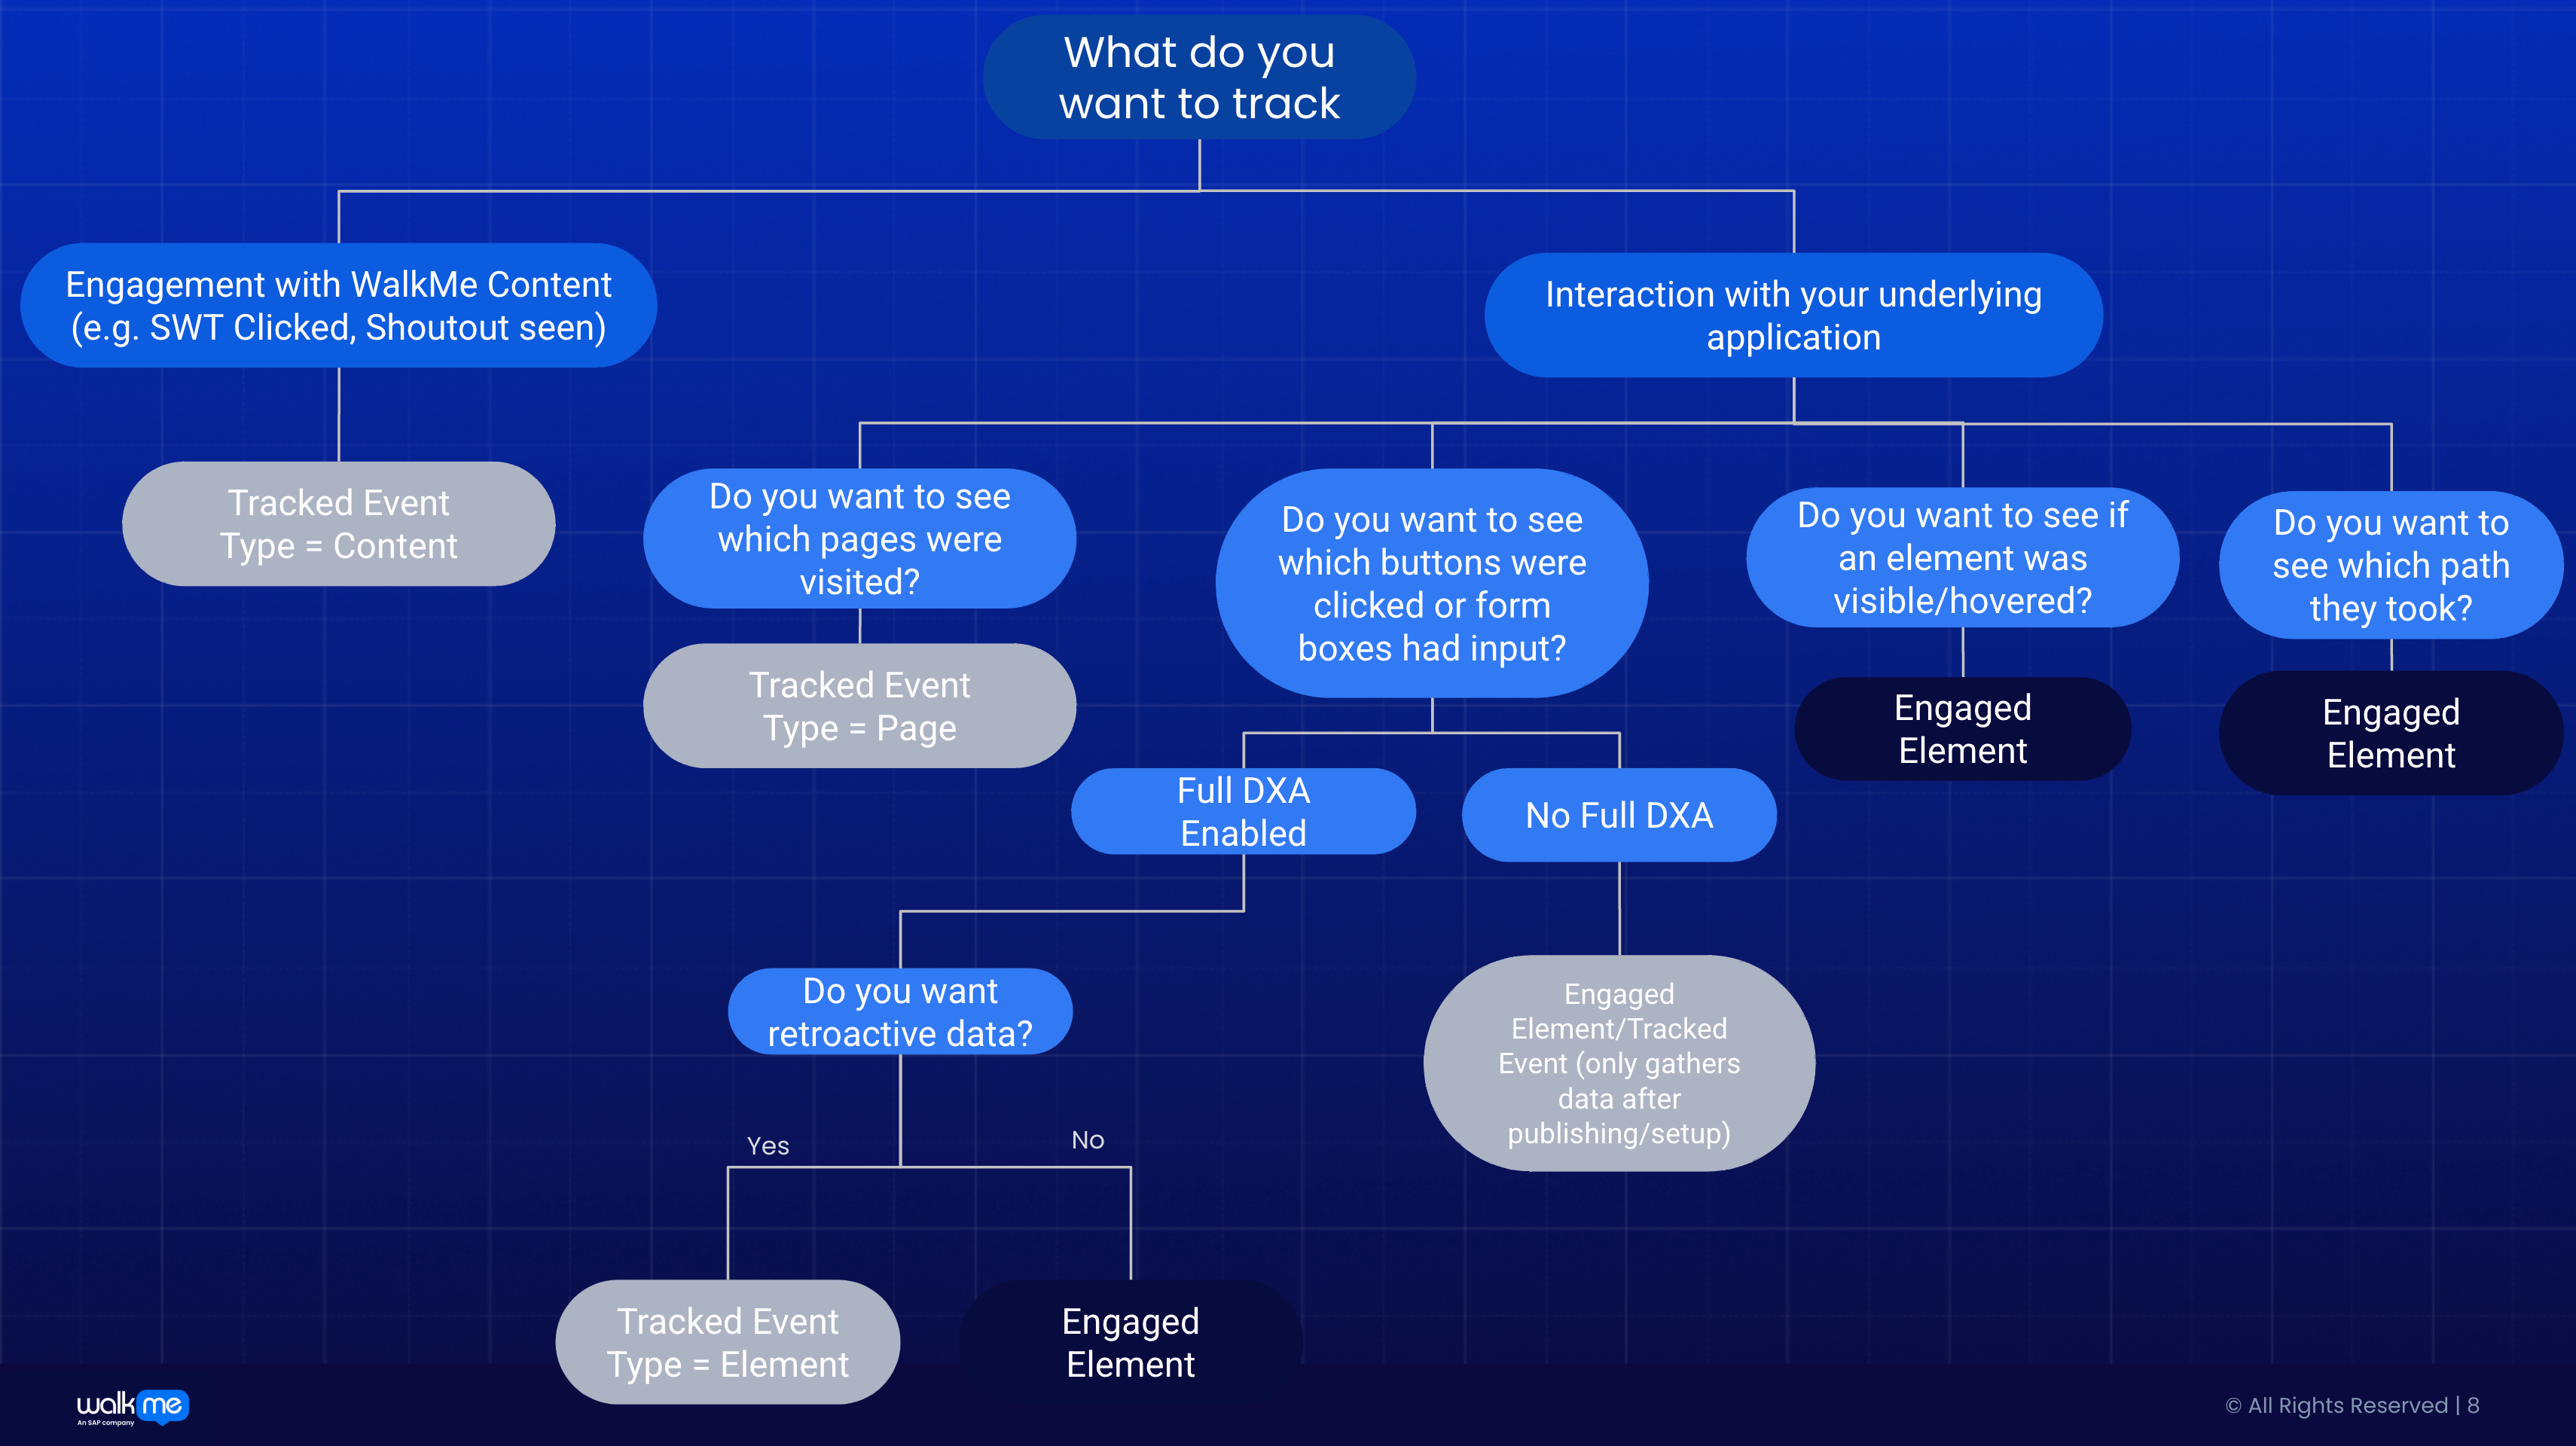
- Define a flow around a question for a defined process. Begin with a real process or decision point. For example: Where do users drop off in the workflow? Which steps do my users take in a process? Which button do users choose at a certain step? Do users who saw my ShoutOut go on to complete the process?
- Set up baseline data. Ensure the key actions in your process have Tracked Events or Engaged Elements defined and published before you deploy WalkMe guidance. These Events become your “before” and “after” anchors in Compare Mode, which helps you demonstrate the impact of your WalkMe solutions. If you don't define your baseline Events before publishing WalkMe content, you lose the ability to measure the performance before vs. after deploying WalkMe in Flow Analytics, making it much harder to prove the impact of your WalkMe solutions.
- Create a flow for a defined process. Using your pre-defined Events, add each step in the order users must complete for the multi-step process you want to analyze. Your Events can be a combination of WalkMe content, URLs they visited and buttons users clicked as long as it represents the sequence of user behavior in the process. Once set up, your flow should now represent the intended workflow from start to finish.
- Analyze your flow. Identify the steps where users struggle or slow down, and focus WalkMe guidance and optimization efforts there. Look for friction signals like large drop-off between steps, long average duration between steps, or users skipping fields or pages.
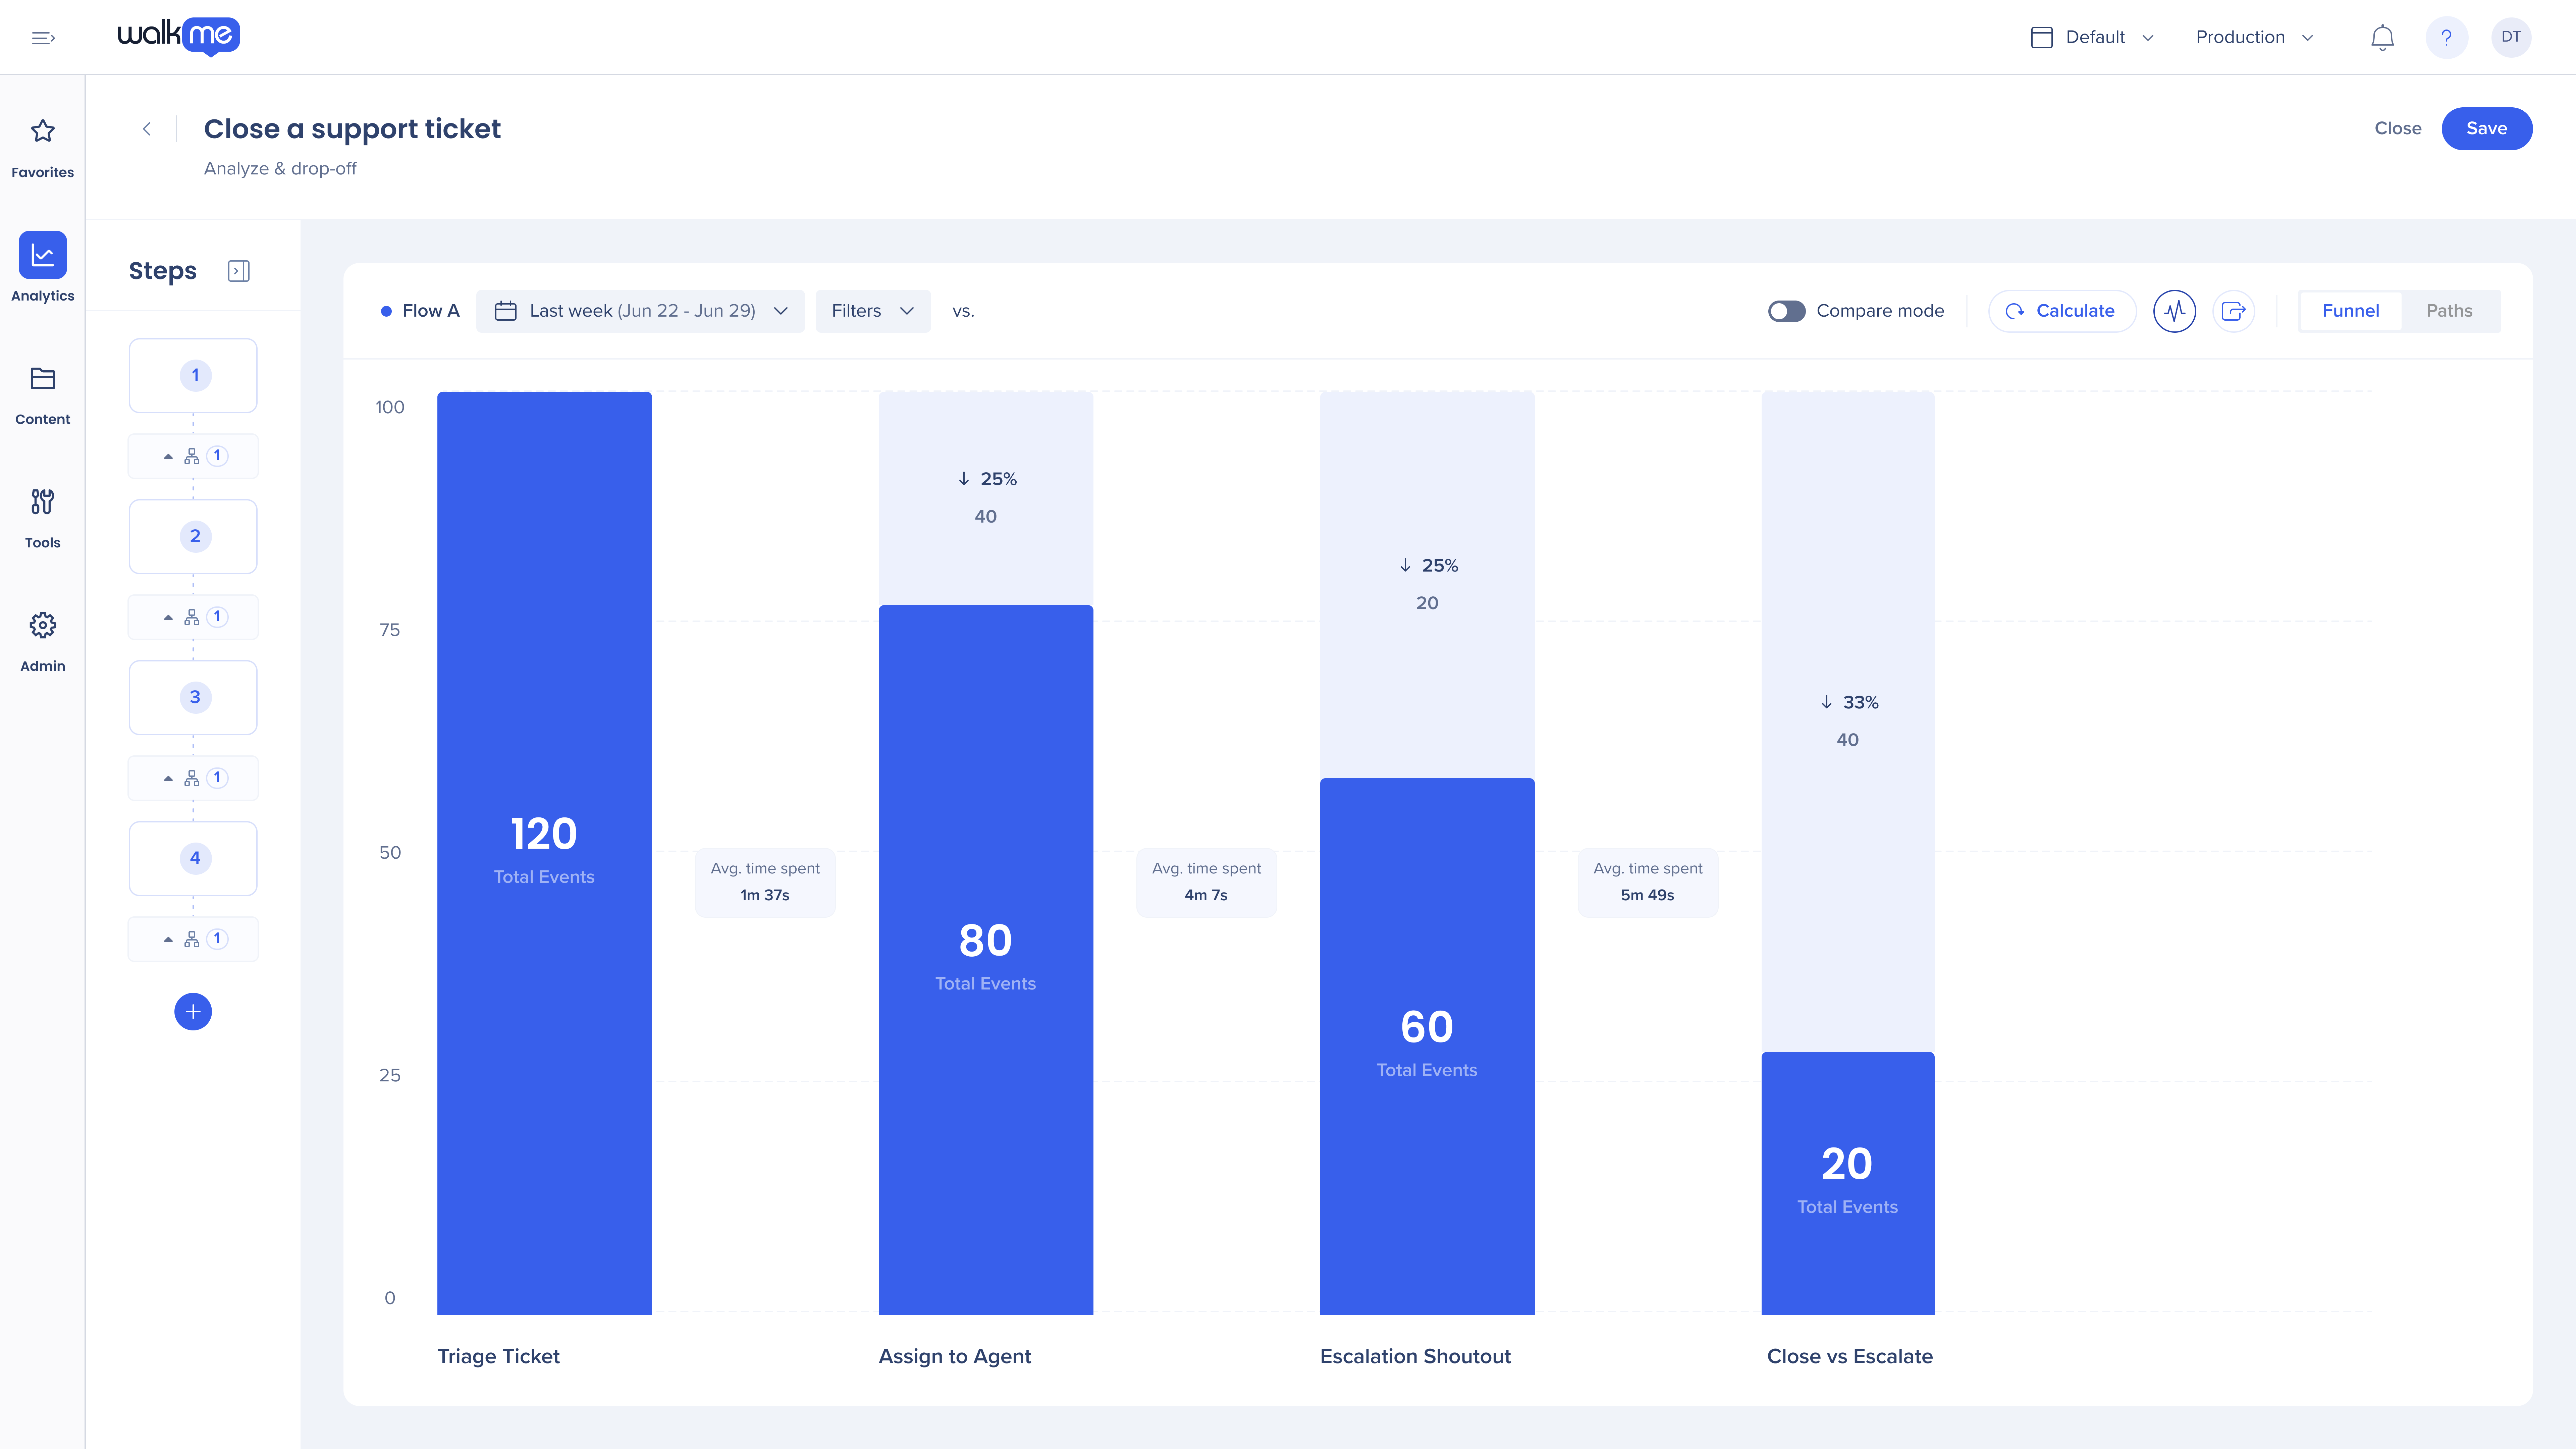
Funnels tell you how many users progress from Step 1 → Step 2 → Step 3, etc. in the exact order you defined. You can see where users drop off and how long each step takes. They're ideal for tracking completion rates, diagnosing drop-off, understanding time-to-completion, and measuring before/after changes when improving a process or adding WalkMe guidance.
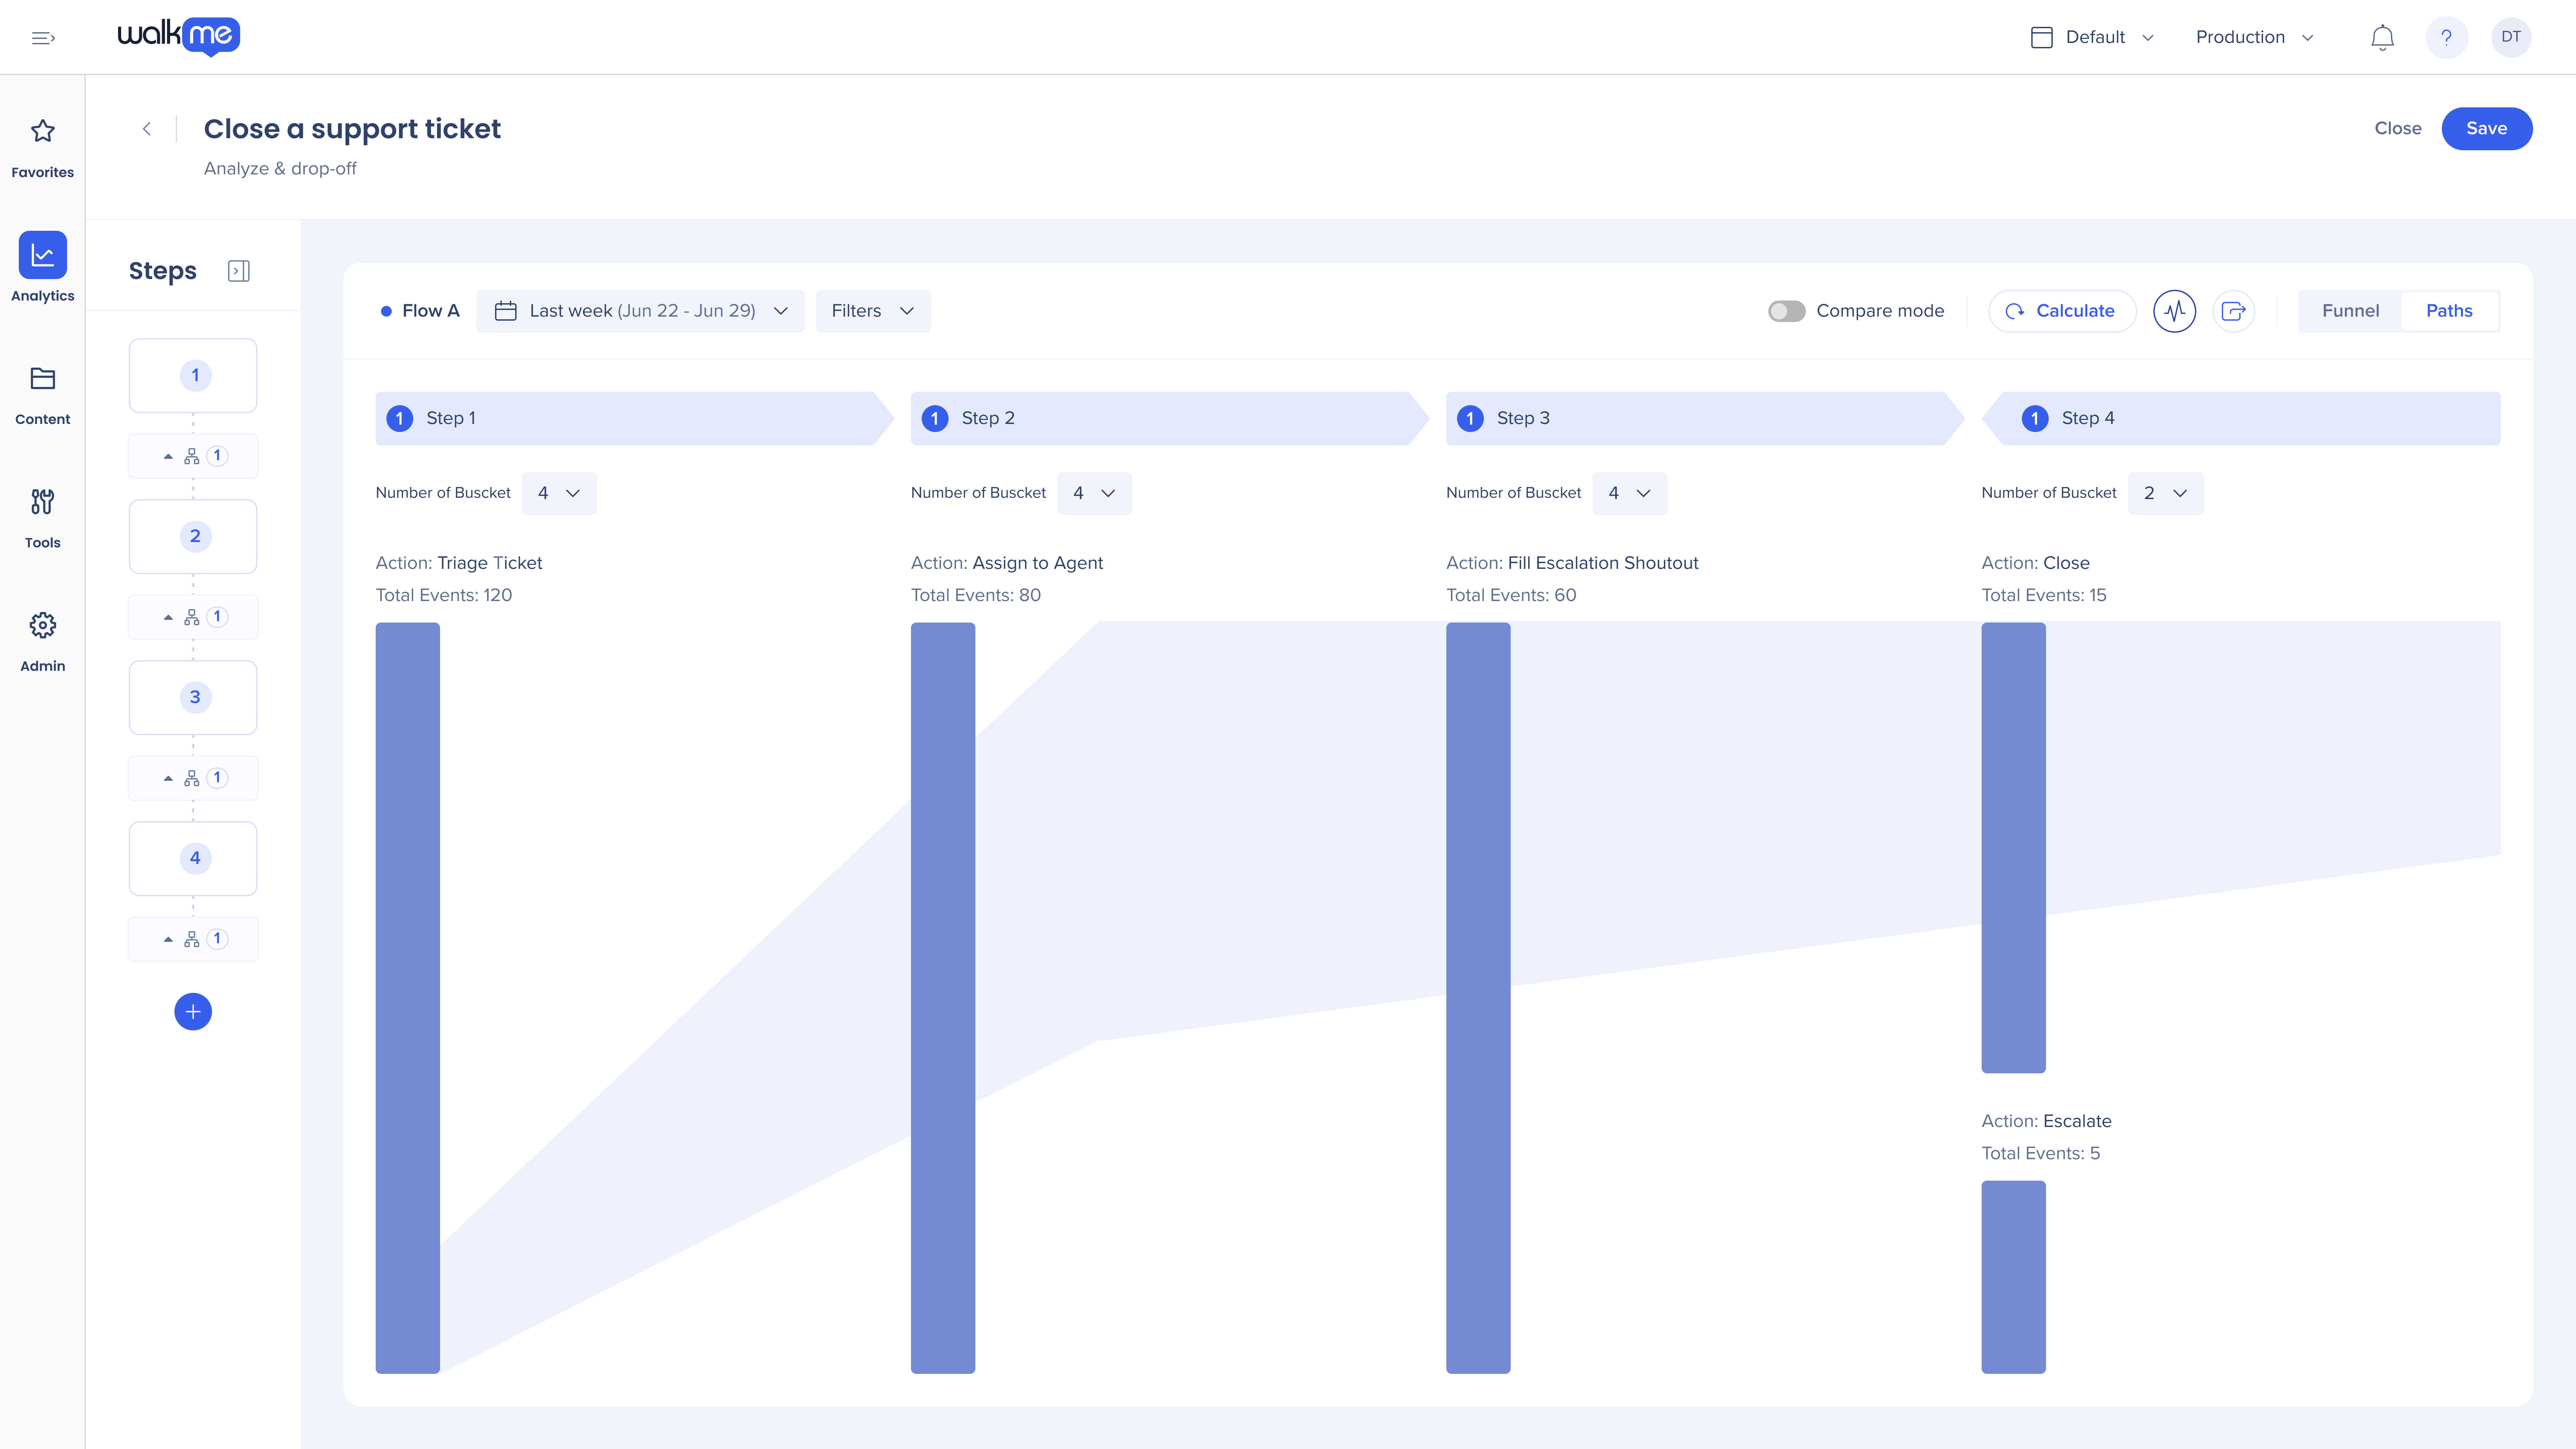
Paths reveal how users actually navigate the workflow. They surface unexpected behaviors, alternate routes, loops, and confusion points, often highlighting steps you didn't know needed guidance. Paths reveal how user behavior differs from your intended sequence.
Show Data As / Split By break results down by user attributes (e.g., location, browser, segment) for more detailed user analysis. Show Data As enables you to select a particular property and analyze your data based on that property. This means you can analyze your data not just by events, but also by other factors such as “Number of Users,” "Country" or "Browser". This can be particularly helpful when trying to identify specific issues within an event, rather than analyzing the event as a whole. Split By enables you to segment data based on a property in the Paths view. This allows you to analyze data for each step based on additional factors such as "Country" or "Browser", and view the results under that step.
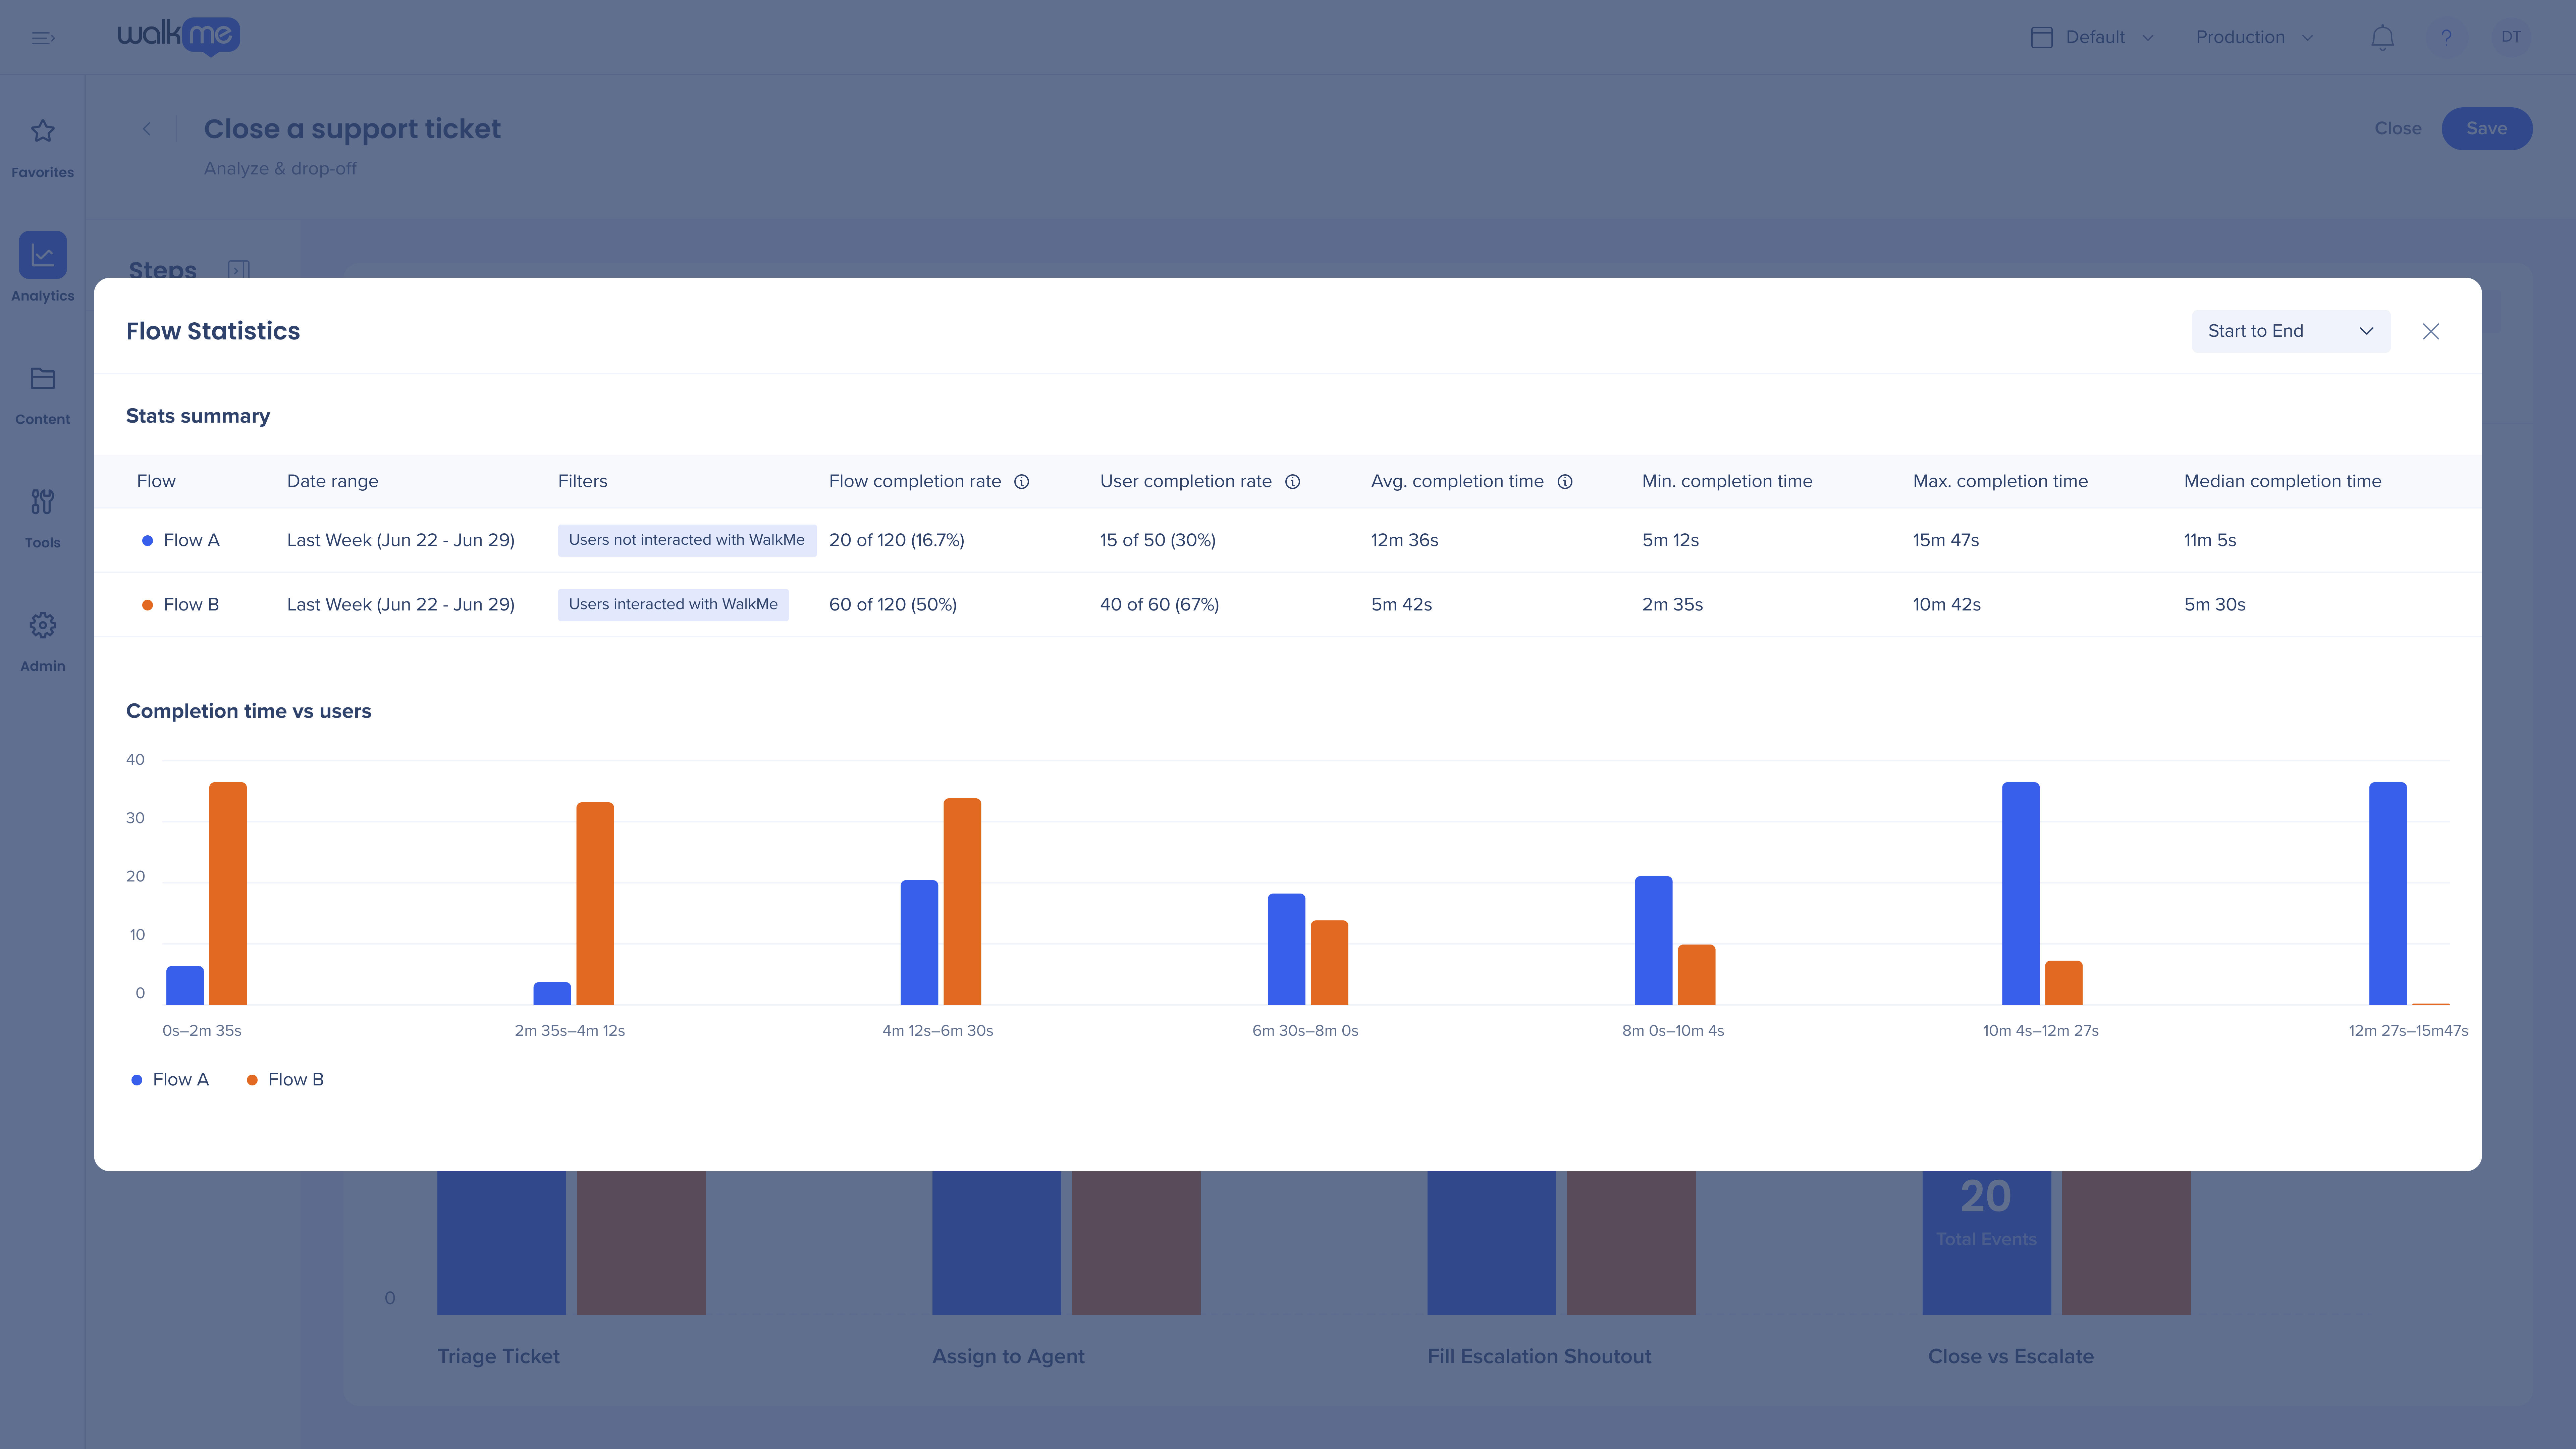
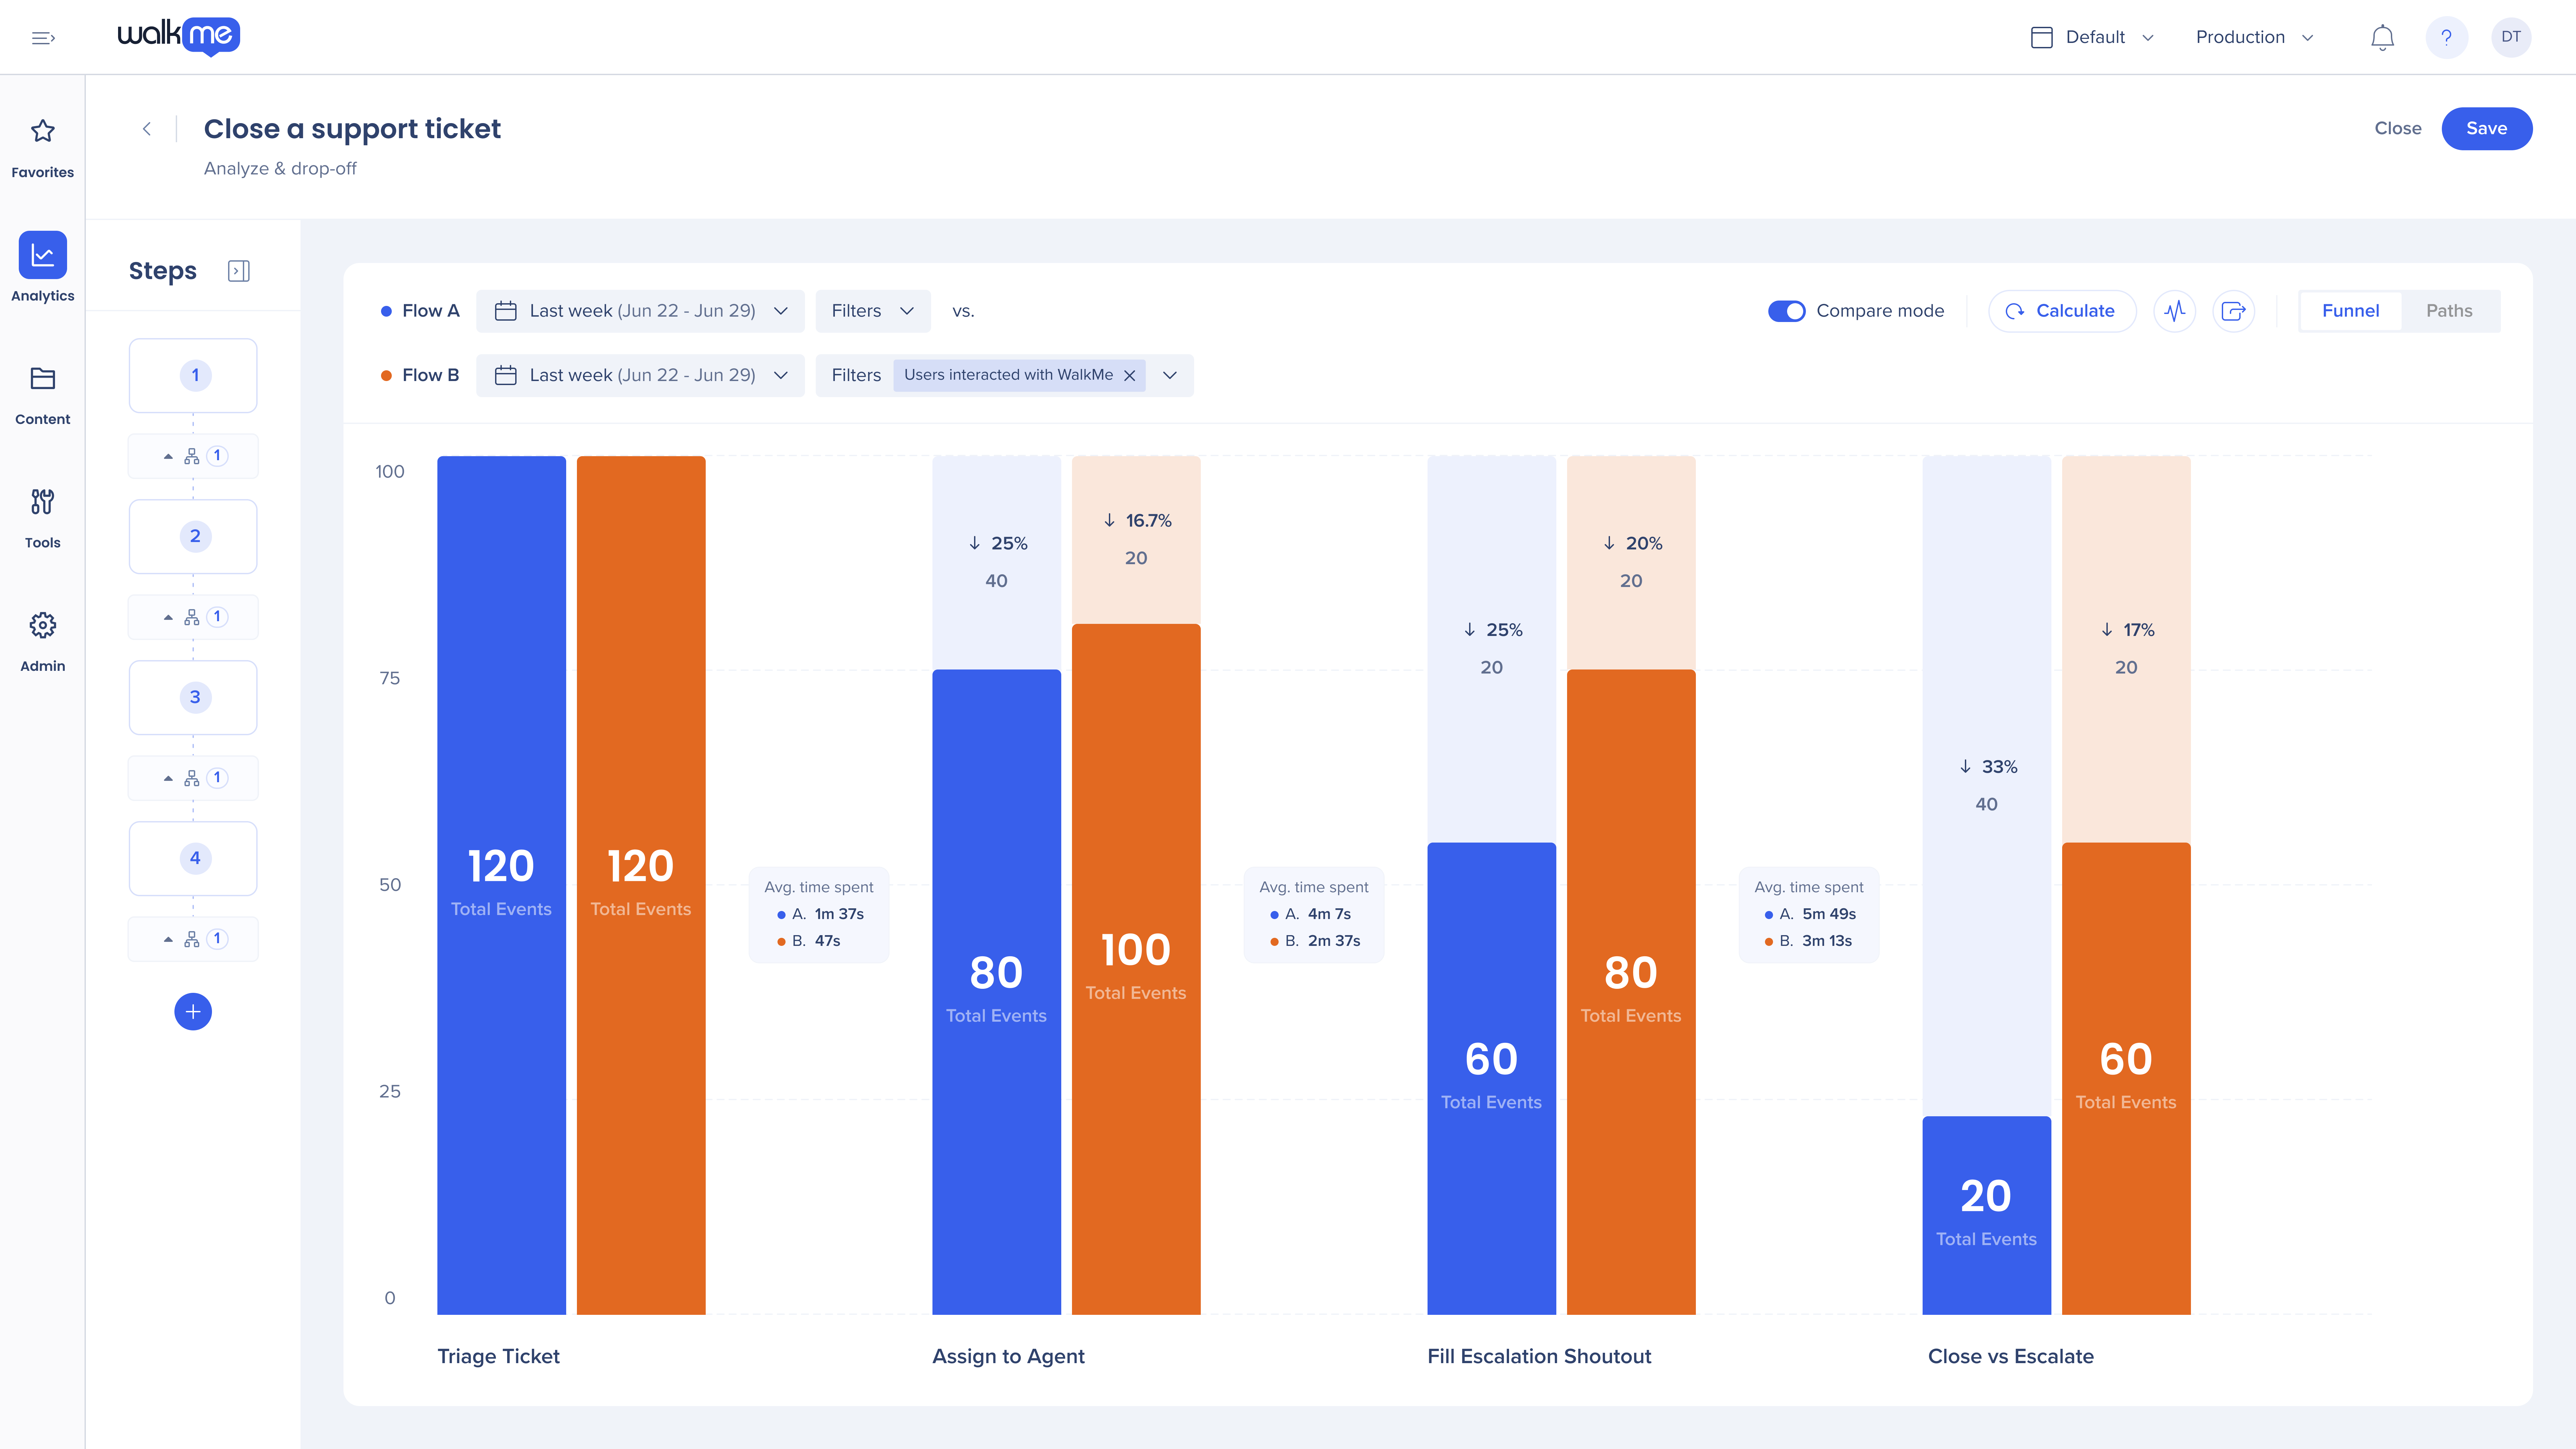
Comparison Mode in Flow Analytics allows you to compare the same flow side-by-side so you can measure how behavior changes across time, segments, environments, or audiences. This is one of the most powerful features in Flow Analytics because it turns your funnels into a before-and-after story, helping you clearly demonstrate where improvements worked—and where friction still remains. It transforms Flow Analytics from a diagnostic tool into an impact measurement tool, making it easier to justify decisions, communicate value to stakeholders, and guide your next round of optimizations.
NOTE: Use Funnels to track user conversion between steps and the time users take to complete each step. Use Paths when you want to understand which routes users take in the intended workflow. Flows focus on the sequence of user actions rather than isolated events. Each step in a flow must be completed in order for the user to progress to the next step. If a user does not complete a step, they will not be recorded for subsequent steps, and no data will be shown for that user beyond the incomplete step.
Additional resources to help you set up Flow Analytics: Flow Analytics, Tip Tuesday: Utilizing Flow Analytics.