Brief Overview
Insights Reports already give you access to all your WalkMe data, allowing you to examine your data in many different ways and variations. The Insights Report Builder takes this a step further and allows you to create custom reports tailored specifically for your needs with a self-service tool.
The Report Builder guides you through the process to create your own customized reports, beginning with choosing a template that best suits your needs, and then offering additional columns and filters for data enhancement. You can create custom reports for web, Desktop Menu, and Native Mobile systems. The templates available depend on the system type.
Once the report is created it can be used in WalkMe just as any other report: it can be exported and subscribed to.
How It Works
Create a Report
Step 1: Choose Report Template
To begin using the Report Builder, follow the steps below:
- Go to the Reports Gallery page in the WalkMe Console
-
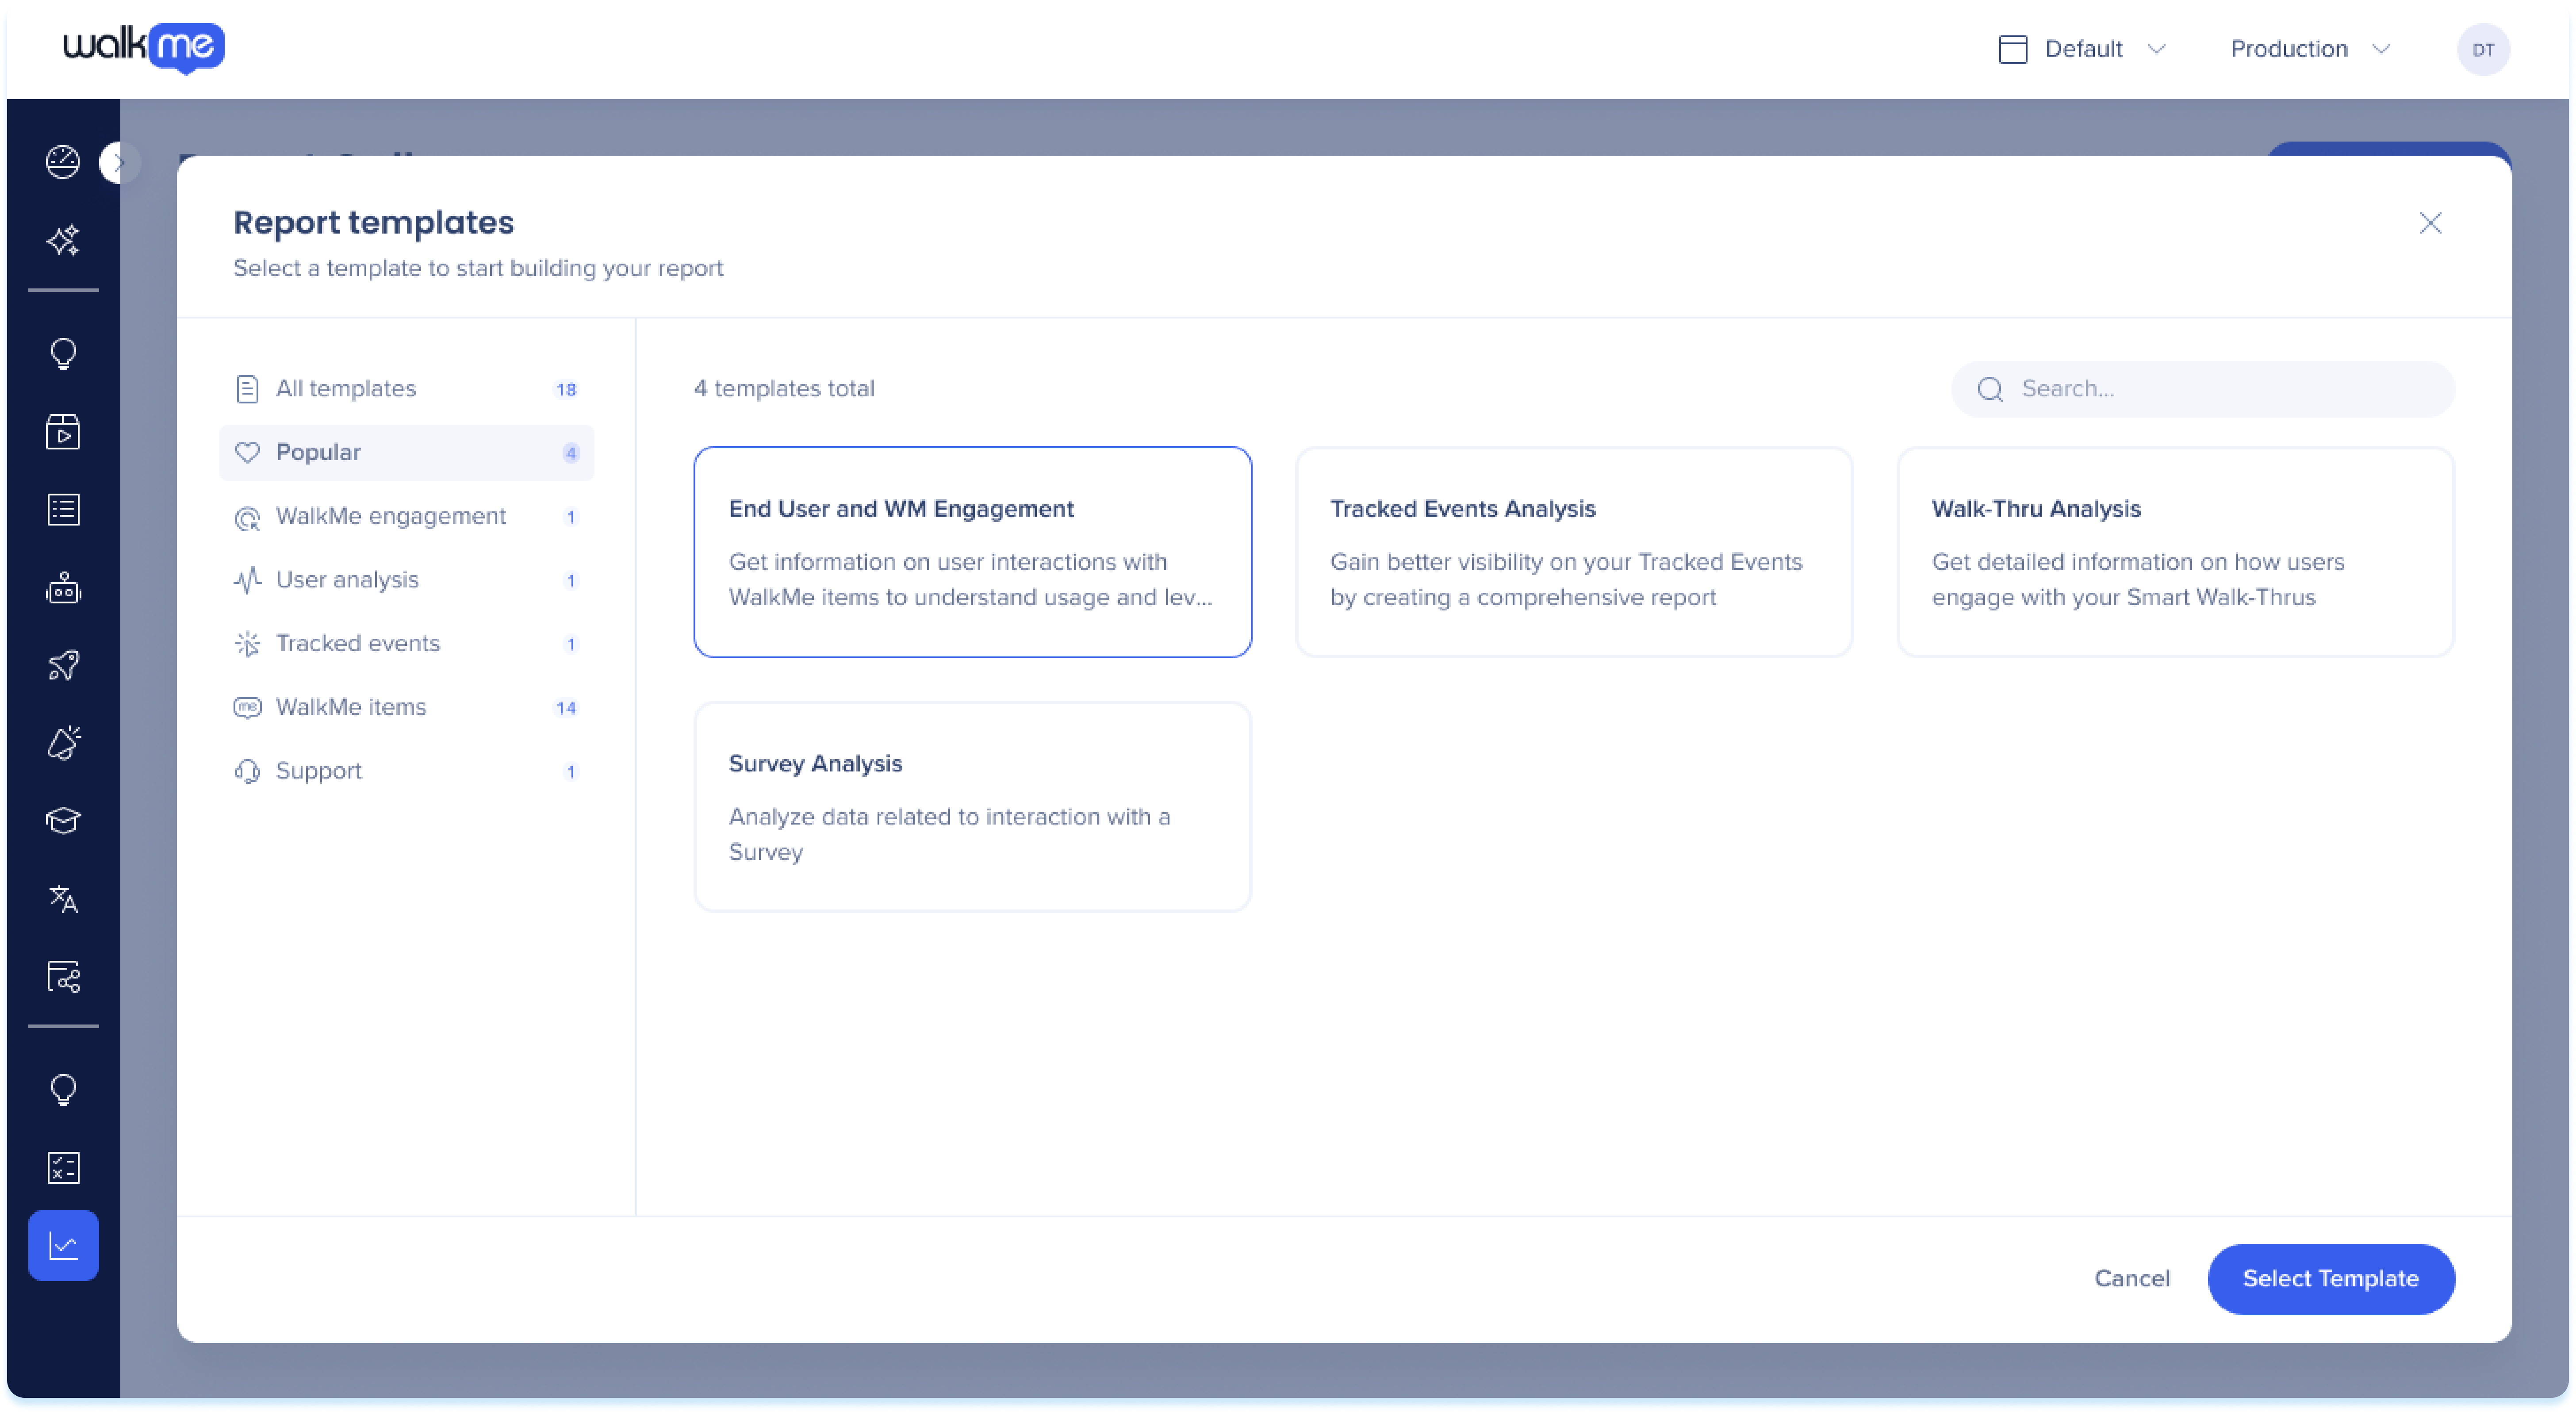
Click the + Create Report button
-
Choose from the available pre-defined templates to begin building your report
-
Click Select template
Anmerkung
Not all templates are available for every system type. See Supported templates by system type below
When you build a report based on a web-only template — Learning, ActionBot, AI Features, Help Desk, Learning Apps, Resources, SmartTips, Shuttles, or TeachMe — Native Mobile systems aren't available in the system selector.
Step 2: Add Report Columns
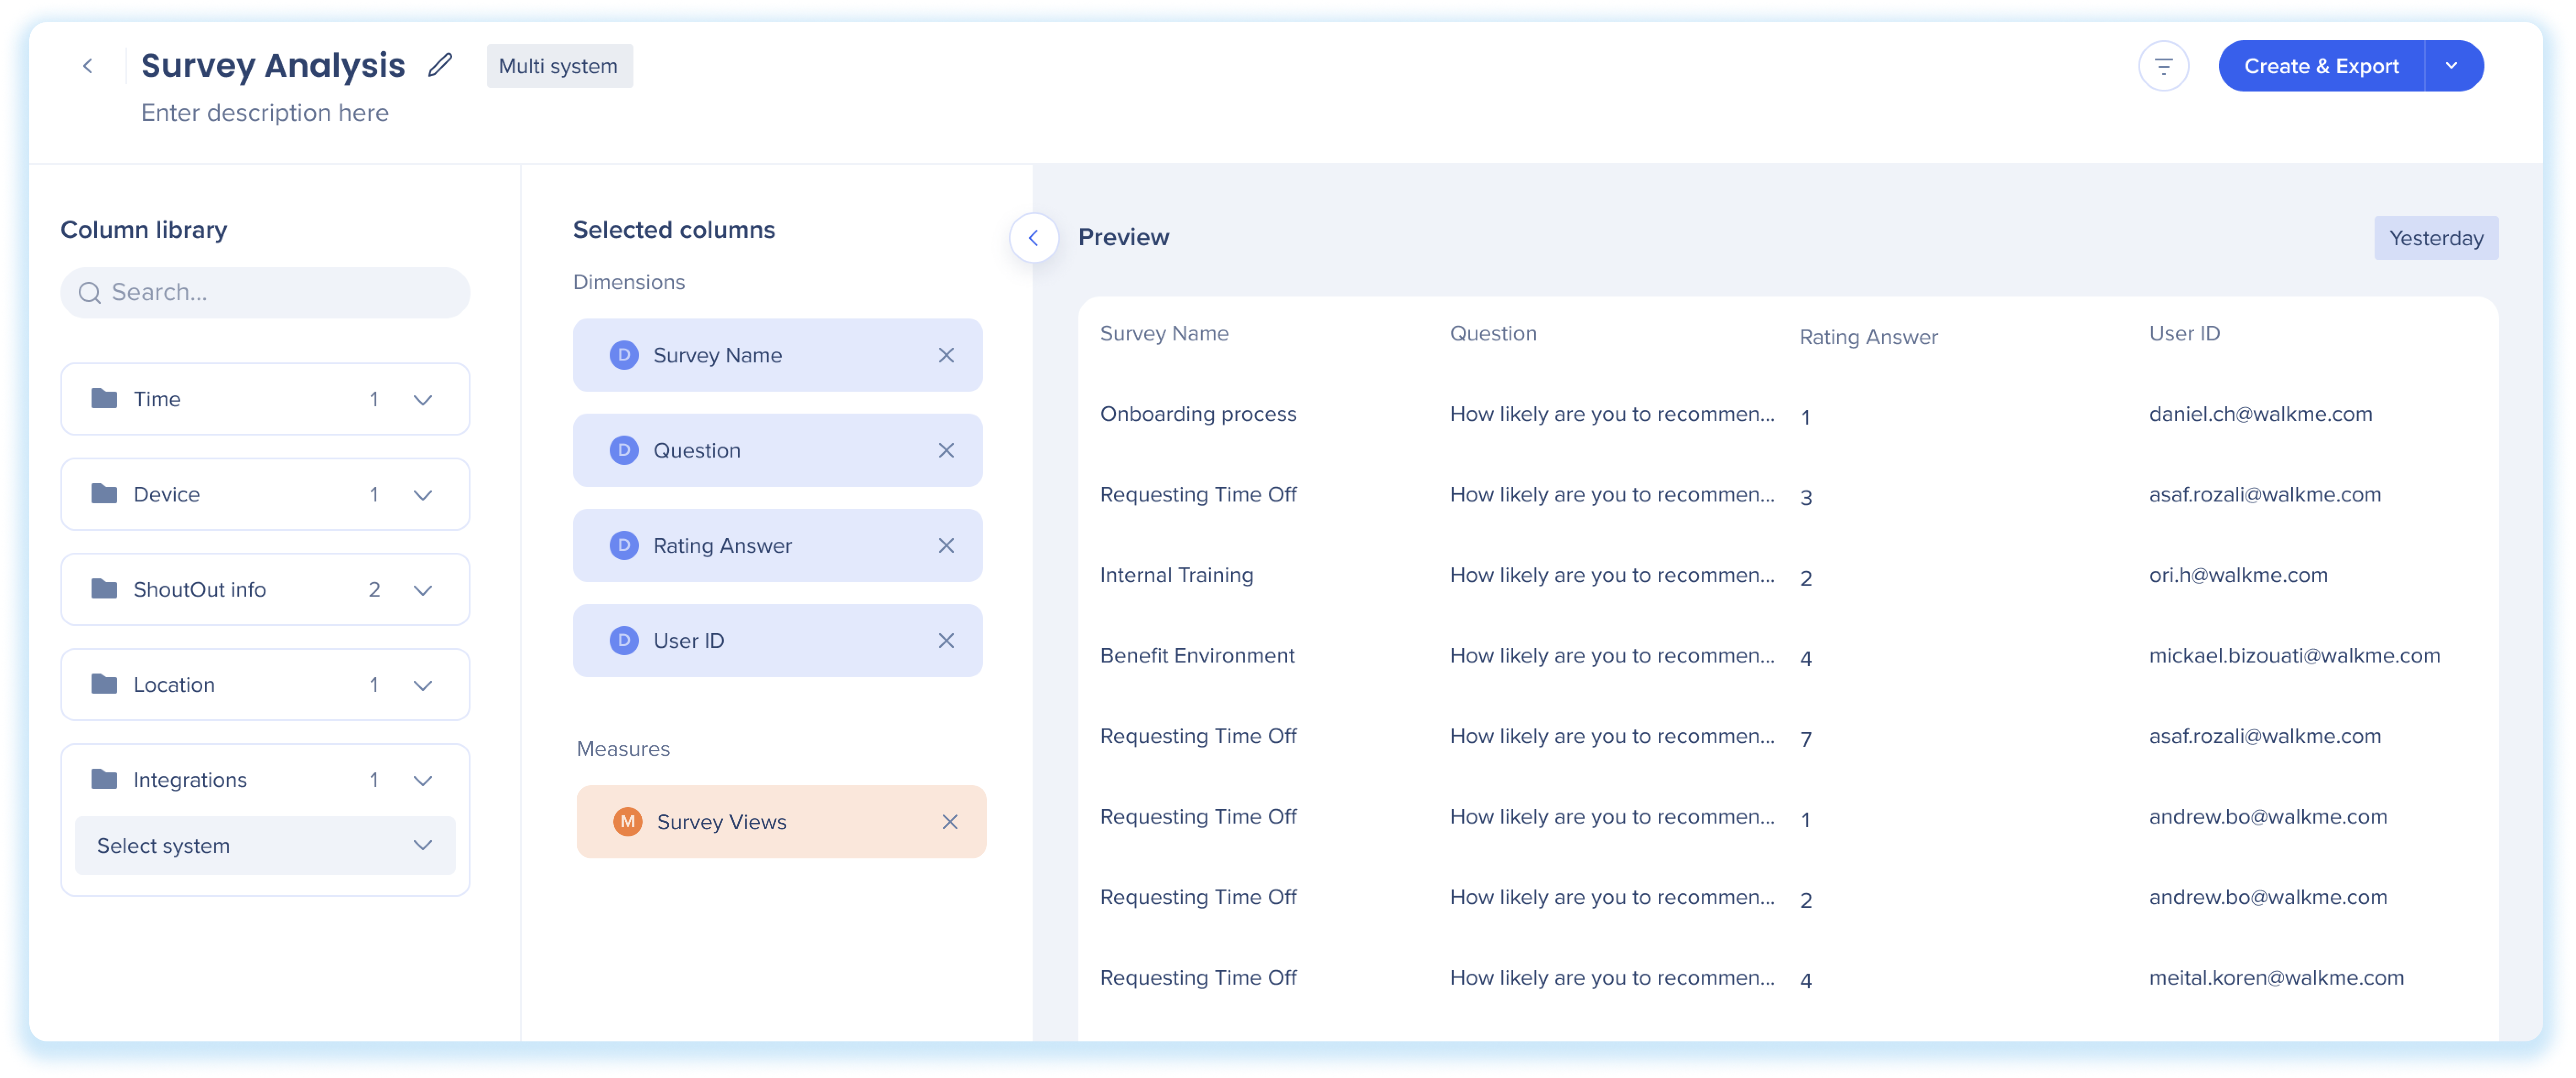
After selecting a template, the Report Builder will show the available columns in the Column library that can be added to the report.
-
Select columns to add to the report
-
Drag and drop (or double click) the dimensions and measures from the library into the Selected columns section to add them to the report
-
You can rearrange your columns in the order you would like them to appear in your report and use the X button to remove any undesired fields
-
Optional: Hover over a column name and click the pencil icon to rename a measure or dimension
Über Dimensionen und Kennzahlen
Bei Dimensionen und Kennzahlen können Ihre Datenspalten in der Tabelle auf unterschiedliche Weise angezeigt werden.
-
Dimensionen: Zeigt schriftliche Werte an, mit denen Sie Ihre Daten kategorisieren und filtern können, was sich auf den Detaillierungsgrad im Bericht auswirkt
-
Beispiele: Land, Endbenutzer-ID, ShoutOut-Name, Sprache, Browserversion
-
Maßnahmen: Zeigen Sie numerische Werte an, die Sie zum Messen, Aggregieren, Zusammenfassen und Zählen Ihrer Daten verwenden können
-
Beispiele: Aufgabenansicht, ShoutOut-Wiedergaben, Ereignisse, abgeschlossene Ziele, Anzahl der Benutzer, die auf ShoutOut geklickt haben
Felder für Integration/verhaltensbasierte Segmentierung in der Spaltenbibliothek
Diese Felder basieren auf einzelnen Systemen. Wählen Sie ein System aus und der Berichtsstatus wird entsprechend aktualisiert. Wählen Sie dann das Integrationsfeld für dieses System aus, um es den ausgewählten Spalten hinzuzufügen.
Tipp
Suchen Sie nach einem bestimmten WalkMe-Element in Ihrem Bericht? Stellen Sie sicher, dass Sie ein identifizierbares Feld wie „Survey-Name“ im Bericht aufnehmen.
Schritt 3: Vorschau anzeigen und Berichtsfilter und System ändern
Vorschau
Die Vorschau zeigt ein Beispiel für die Daten an, sodass Sie einen Snapshot des Inhalts des Berichts sehen und überprüfen können, ob die ausgewählten Spalten/Filter wie beabsichtigt funktionieren. Beachten Sie, dass die Vorschau dem Verständnis des Berichts dient und nicht für Tests gemacht ist.
Beispieldaten stammen vom Vortag. Falls diese nicht verfügbar sind, werden Daten aus der letzten Woche angezeigt. Das Datums-Tag in der oberen rechten Ecke zeigt den Zeitrahmen als „Yesterday“ (Gestern) oder „Last Week“ an und kann nicht geändert werden.
Ändern Sie den Bericht
-
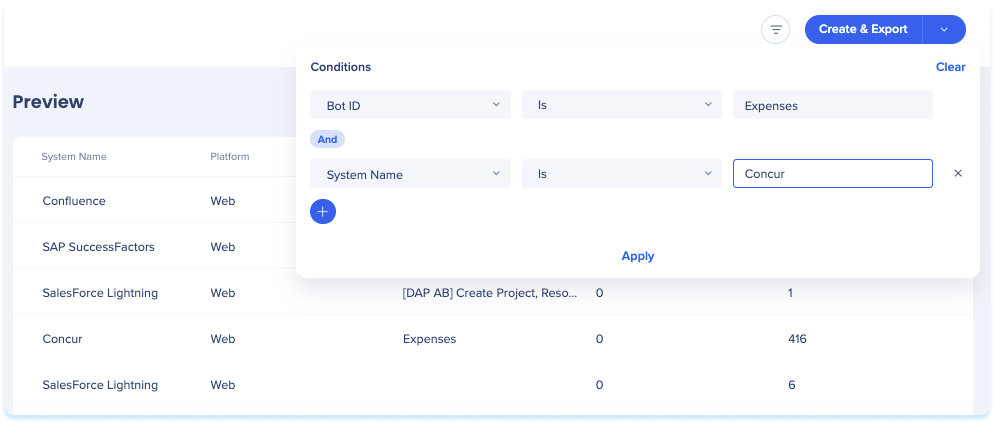
Filter
-
 Klicken Sie auf das Symbol Filter, um den Bericht auf der Grundlage bestimmter Bedingungen zu filtern
-
Fügen Sie eine Regel mit dem gewünschten Feld, der Bedingung und dem Wert hinzu, um den Bericht zu filtern
-
Klicken Sie auf Anwenden
Anmerkung
-
More than 1 filter can be used together in an AND statement
-
Filters are only available for Dimension Columns
-
Default preview is set to the Production environment but can be changed with filters
- For Native Mobile systems, Site, URL Domain, Browser, and Platform filters, and segments defined in the Content Manager, aren't available
2. System-Dropdown-Menü
-
-
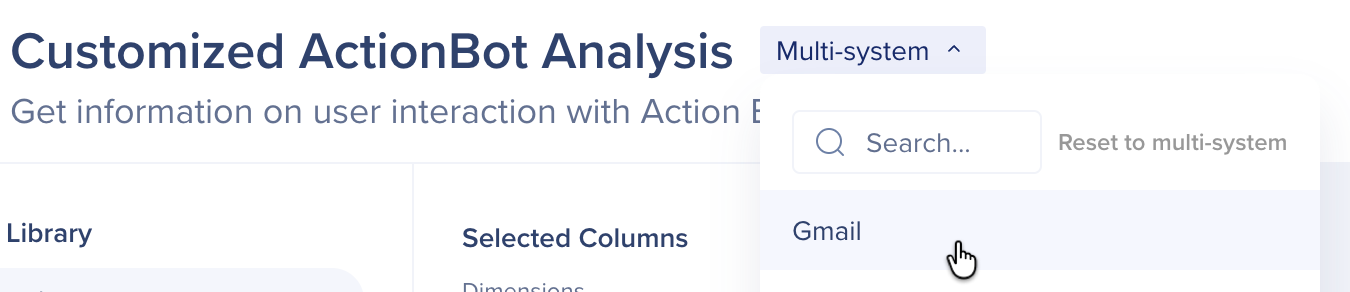
Multi-System: Wählen Sie Multi-System aus, um Daten von allen Systemen einzubeziehen
-
Einzelsystem: Wenn Sie ein einzelnes System auswählen, werden im Dropdown-Menü nur Systeme mit aktiven Integrationen oder Verhaltenssegmenten angezeigt (weshalb möglicherweise nicht alle Ihre Systeme angezeigt werden)
Auf Multi-System zurücksetzen: Nachdem Sie ein einzelnes System ausgewählt haben, können Sie zum Multi-System-Modus zurückkehren, indem Sie im Dropdown-Menü auf die Schaltfläche Auf Multi-System zurücksetzen klicken.
Anmerkung
- Beachten Sie, dass IDP-Integrationen sich im Vergleich zu anderen Integrationen anders verhalten
- Das Aufheben der Zuweisung eines Systems von einem IDP löscht das IDP-Schema oder die Attribute nicht
Schritt 4: Legen Sie Namen und Beschreibung fest
Sobald Sie mit dem Format des Berichts zufrieden sind:

Schritt 5: Speichern und Exportieren
-
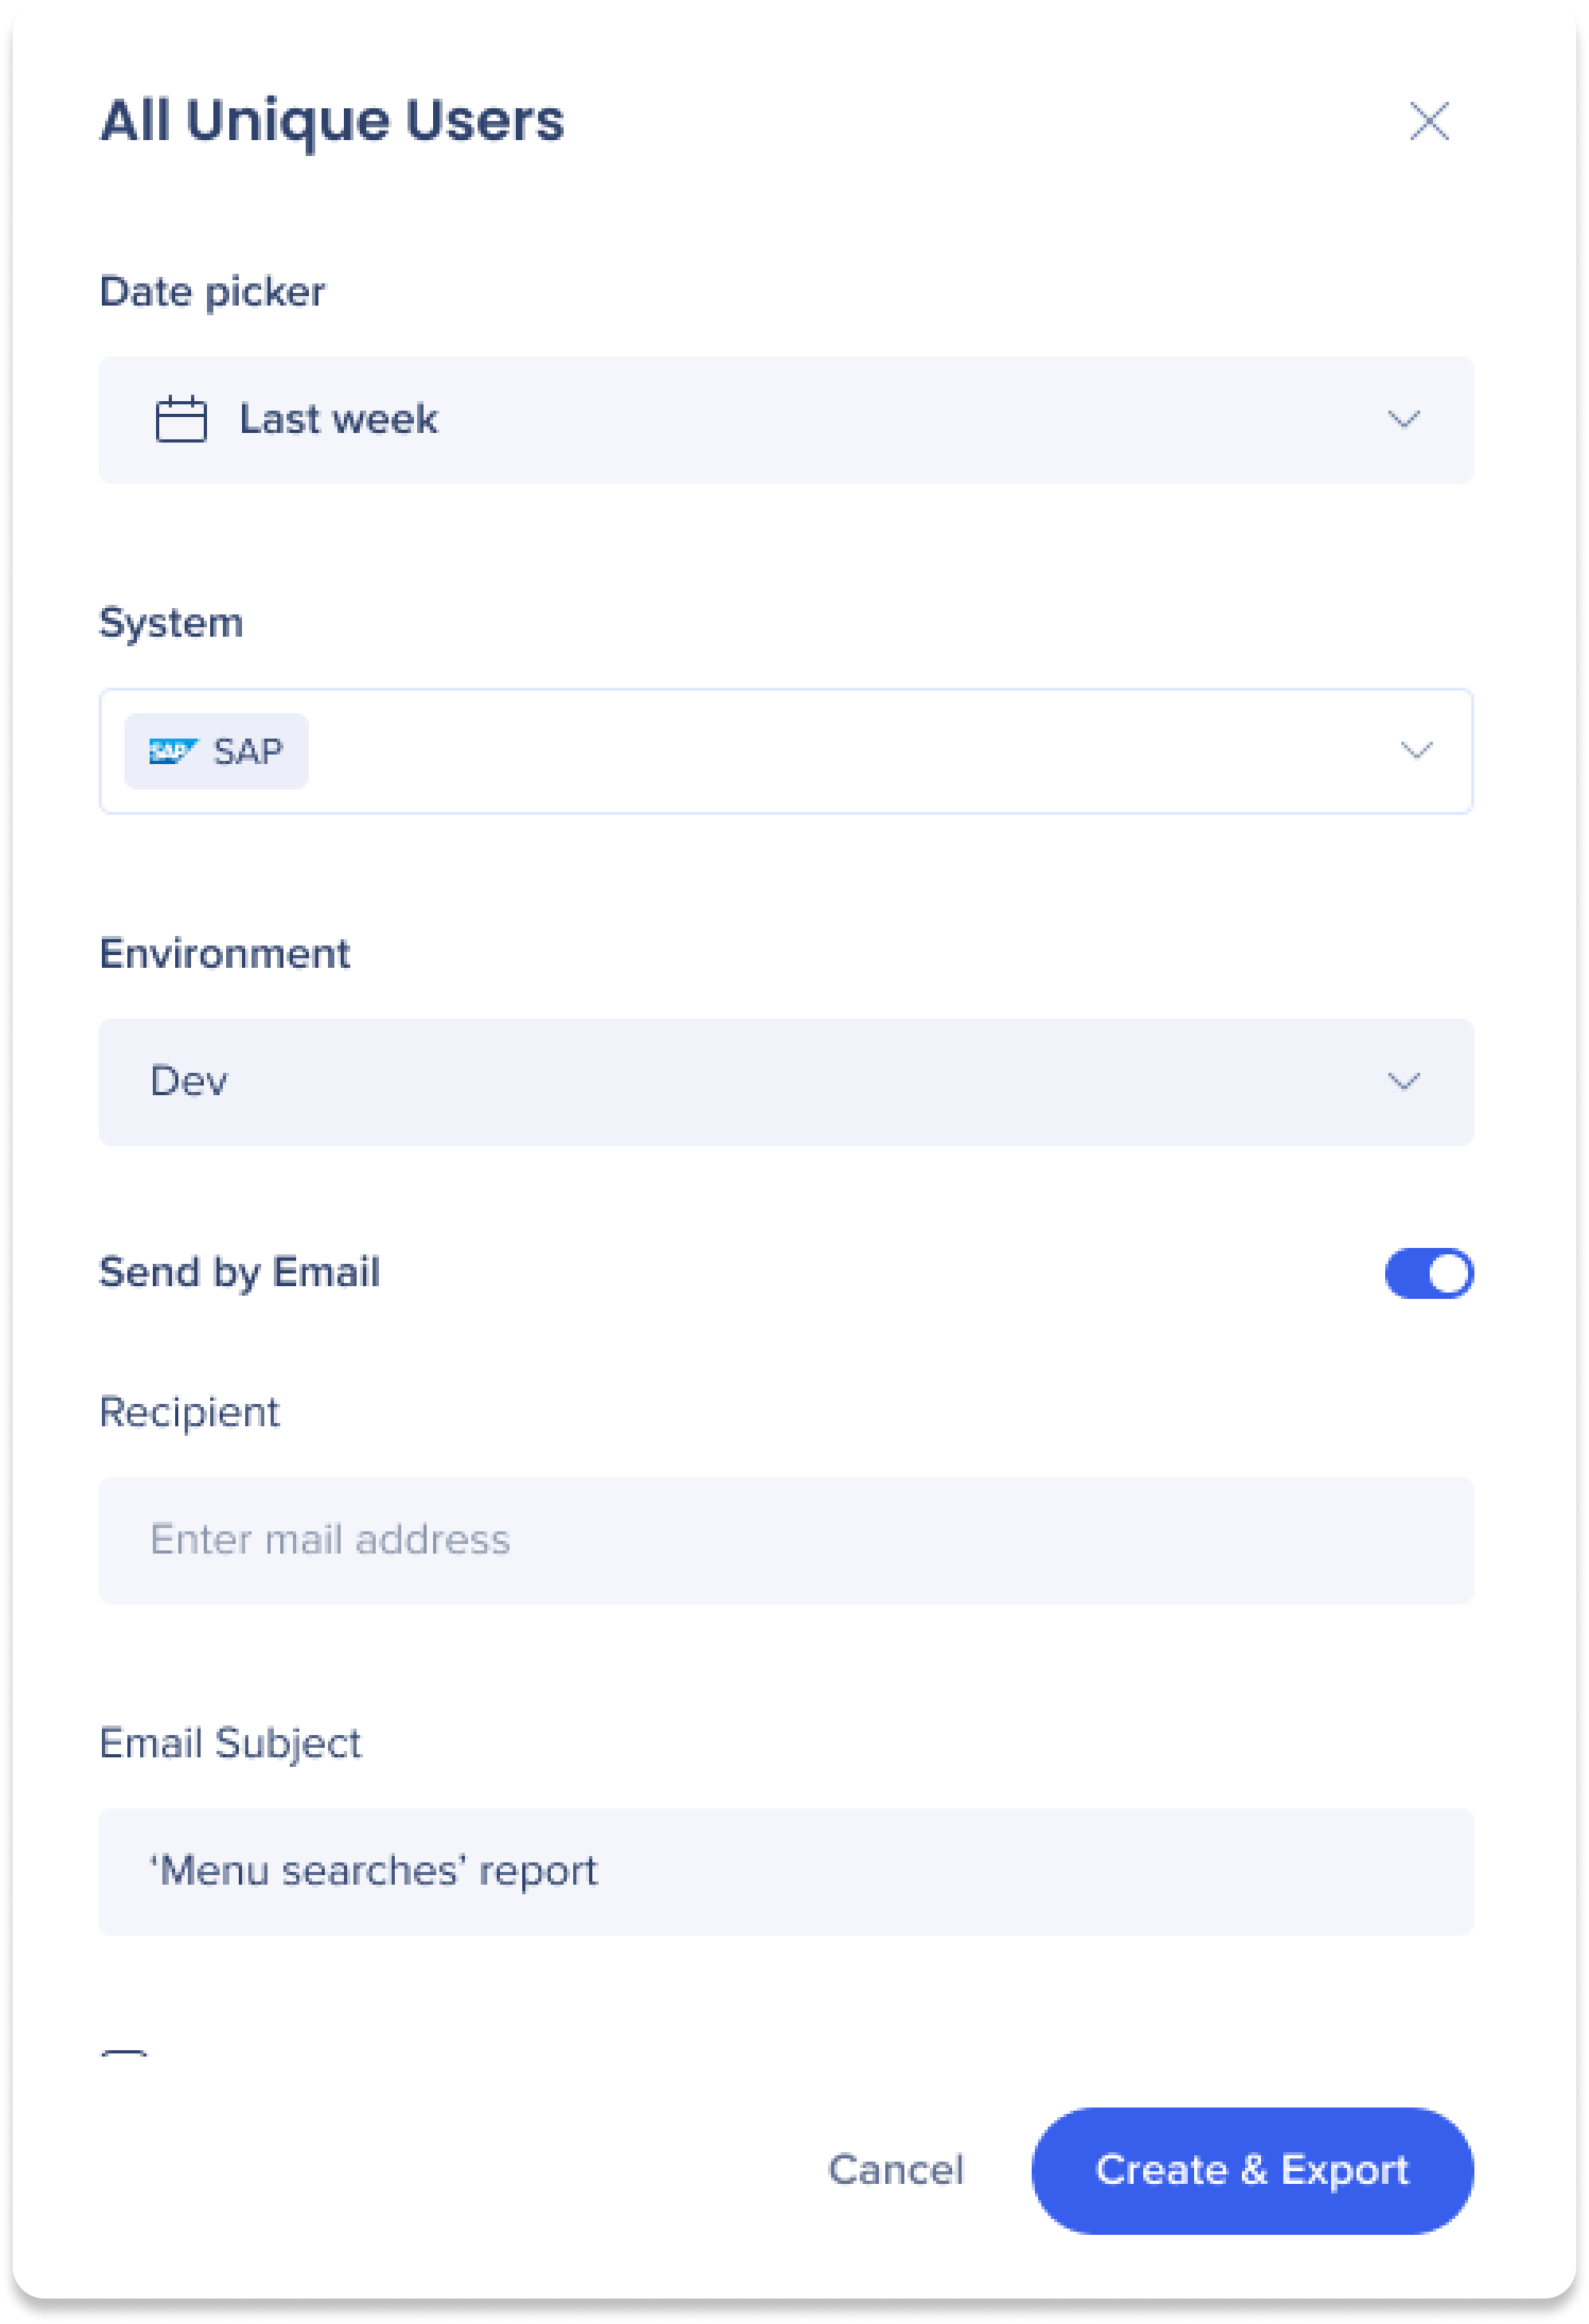
Klicken Sie auf die Schaltfläche Erstellen und Exportieren
-
Klicken Sie auf das Dropdown-Menü und wählen Sie Erstellen aus, um ohne zu exportieren zu erstellen
-
Dadurch wird der Bericht auf der Registerkarte Meine Berichte in der Berichtsgalerie gespeichert, wo er später exportiert werden kann
-
Wählen Sie den Datumsbereich der Berichtsdaten aus dem Dropdown-Menü Datumsauswahl aus
-
Wählen Sie die Systeme aus, aus denen die Daten gezogen werden
-
Wählen Sie die Umgebung aus, aus der die Daten gezogen werden
-
Optional: Klicken Sie auf den Umschalter Per E-Mail senden, um den Bericht an eine Liste von Empfängern zu senden
-
Geben Sie die E-Mails der Empfänger unter das Feld Empfänger ein
-
Geben Sie einen benutzerdefinierten E-Mail-Betreff in das Feld E-Mail-Betreff ein
-
Kreuzen Sie Abonnieren an, wenn Sie ein Berichtsabonnement sowohl exportieren als auch erstellen möchten
-
Klicken Sie auf Erstellen und Exportieren
Anmerkung
-
Der Bericht wird generiert und zur Registerkarte Generierte Berichte unter Berichte und Abonnements hinzugefügt. Von dort aus kann der Bericht heruntergeladen werden
-
Der Bericht wird auch auf der Registerkarte Meine Berichte in der Berichtsgalerie aufgeführt
Supported templates by system type
Native Mobile
-
-
General Event Template
-
Goal Completions
-
Launcher Analysis
-
Menu Searches
-
Resource Analysis
-
ShoutOut Analysis
-
Shuttle Analysis
-
Survey Analysis
-
Task Analysis
-
Tracked Events Analysis
-
Users Analysis
-
Walk-Thru Analysis
-
WalkMe Item List
If a template isn't supported for a system type, systems of that type don't appear in the system selector.
Choose a General Event template
If your account has at least one Desktop Menu system, you'll see two General Event templates:
- General Event Template: Web data only. Use it for reports on web systems
- General Event Template with Desktop Menu: Every General Event Template field, plus the Desktop Menu Info & Metrics fields. Use it for reports that include Desktop Menu systems, on their own or together with web systems
If your account doesn't have a Desktop Menu system, you'll see only the General Event Template.
Common Report Builder Fields
See a list of commonly used measures and dimensions that are available as fields in the Report Builder.
Common Report Builder Fields
Technical Notes
- Keyword fields may not show all keywords
- Keyword fields in Report Builder (such as Item Keywords, Survey Keywords and Shuttle Keywords) may not show every keyword assigned to an item in the Editor:
- Keywords you enter manually are reported as soon as you save the item
- Keywords generated automatically after you save the item may be missing until you save it again
- Keywords added or refined automatically over time, based on search activity, may also be missing until you save the item again
- This affects reports built from Report Builder templates that include a keyword field, including filters on keyword fields. Insights Pre-Built Reports don't include keyword fields and aren't affected.
- Workaround: Save the item, wait about 1 minute, and then save it again. The second save sends the full keyword list to Insights.
-
Account level reports cannot be created with the Report Builder
-
Using OR condition between different columns is not supported; we found a very small number of use-cases so we decided to invest in other areas and wait for more customer feedback
-
Requests for additional fields are welcome - They should be treated as new feature requests
-
An option to have one template to include all fields has been investigated and rejected due to feasibility issues
- Workstation templates are now available in the Report Builder
- The relevant template is called General Event Template with Desktop Menu. It has every General Event Template field plus the Desktop Menu Info & Metrics folder (19 fields)
- It only shows for accounts with at least one Desktop Menu system. Accounts without one see only the General Event Template, which is unchanged
- Desktop Menu custom reports include only data collected with Enhanced Analytics, from Q2 2026 onward. Earlier Desktop Menu data isn't included. For historical data, use the legacy Desktop Menu reports in the Reports Gallery
- Desktop Menu custom reports only include devices running WalkMe Menu version 4.20 or later
- Native Mobile systems don't appear in the system selector for templates that aren't supported for mobile. See Supported templates by system type
-
See a blank for Item Name?
-
If you see a blank for Item Name in your preview or exported report, it means that the event is an internal process and not related to any WalkMe item types (for example: "WalkMe" or "Player")
-
To view only interactions with specific WalkMe items, it's best to filter out these irrelevant events. We recommend using the filter "Item Name is not null" to remove them from your report
-
Any user with Insights Access permissions can view, create, and modify reports
Roles and Permissions