This article covers analytics and reporting for all WalkMe AI capabilities: AI Answers, AI Action Bar, AI SmartTips, and AI Condition & Rule Engine. All AI analytics are accessed through the AI Dashboards tab in the WalkMe Console.
AI deployables do not appear in Tracked Events, Funnels, Custom Widgets, or Flows. Use the AI Dashboards for AI-specific metrics. For standard DAP content analytics, visit Getting Started with WalkMe Insights.
Brief Overview
WalkMe Insights is an advanced analytics tool integrated into the WalkMe Console. It monitors how users interact with both WalkMe content and the underlying platform - enabling data-driven decisions to improve digital adoption and AI performance.
The AI Dashboards in the Insights Console provide up to four dedicated tabs, each covering a specific WalkMe AI product. The tabs available depend on your AI package:
Dashboard
AI Feature Covered
Example Use Case
AI Answers
Conversational AI chat: usage, topics, unanswered questions, feedback
An HR lead identifies the most-asked policy topics and prioritises knowledge source updates to reduce support requests
A product manager tracks whether AI rules are routing negative feedback through self-help flows to improve CSAT
Accessing the AI Dashboards
Step 1: Go to the Systems Overview page in the WalkMe Console
Step 2: Select a system from the Monitored Systems widget
Step 3: Click the AI Dashboards tab from the apps bar
Note
Each user can only view dashboards they have permission for, as controlled by their WalkMe admin. Contact your Customer Success Manager for access configuration.
WalkMe's Contextual AI Assistance Suite
WalkMe's Contextual AI Assistance provides three categories of AI service — Pinned, Proactive, and On-Demand — each with its own reporting capabilities:
Category
Features
Reported In
On-Demand AI
AI Answers (conversational search in the Pro Menu); AI Chat
AI Answers Dashboard
Proactive AI
AI Action Bar (launchers, writing tools, quick actions, suggestions); AI SmartTips; AI Condition & Rule Engine
AI Action Bar Dashboard; AI SmartTips Dashboard; AI Condition & Rule Engine Dashboard
Pinned AI
AI Action Steps in Smart Walk-Thrus (AI Launchers embedded in guided flows)
AI Action Bar Dashboard (Launcher metrics) + standard Smart Walk-Thru analytics in Insights Content
AI Answers — Reporting & Analytics
AI Answers is a conversational search tool that integrates with company-specific knowledge sources to let users search for answers in natural language without switching apps. Enterprises have full control of the data and content sources authorized for AI Answers.
Key Metrics
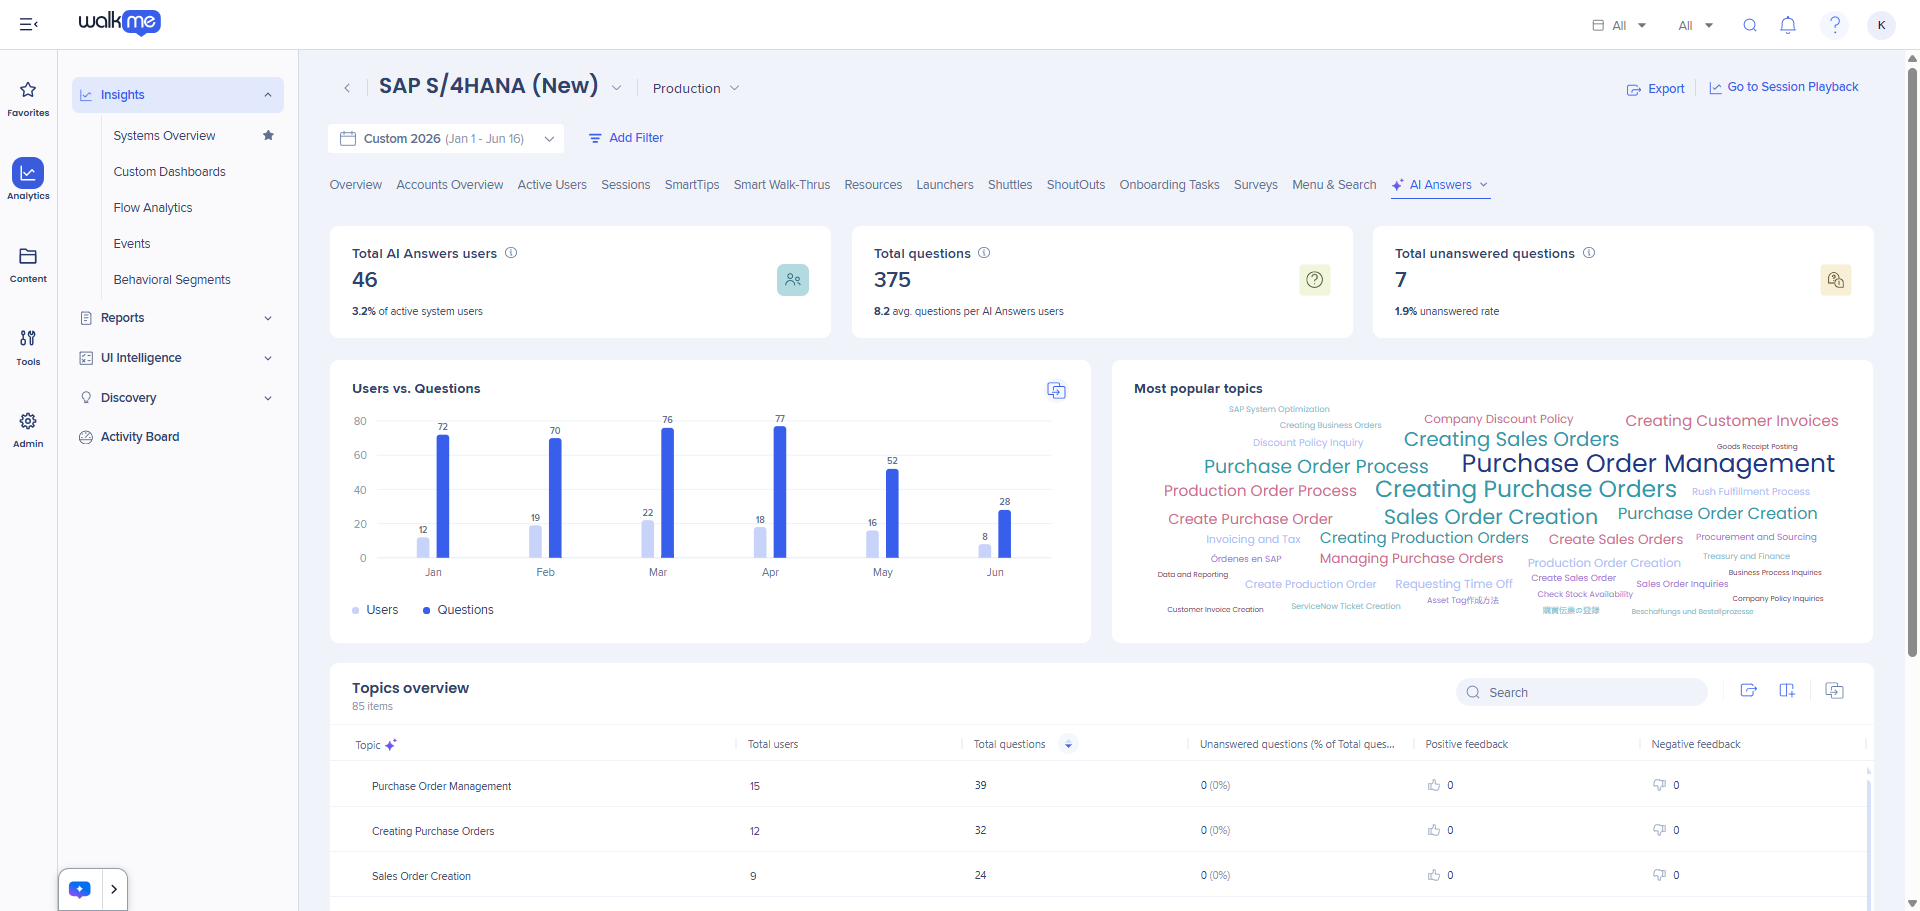
Total Users: Unique users who asked a question and received an answer
% of Active System Users: Users who asked a question ÷ active users for this system
Total Questions: Total answered questions, excluding those with no user response
Avg. Questions per User: Total questions ÷ unique users
Total Unanswered Questions: Questions AI Answers couldn't respond to — due to no matching knowledge source or an unclear query
% Unanswered Rate: Total unanswered questions ÷ total answers
Dashboard Widgets
Users vs. Questions (trend graph): Tracks total questions and unique users over time. Hover over a date for exact counts.
Most Popular Topics (word cloud): AI-generated topics from all user chats. Larger, darker topics have the most questions. Hover over a topic for question count and popularity ranking.
Topics Overview (table): Per-topic breakdown of users, questions, failed answers, and positive/negative feedback. Click a topic's user count for a deep-dive pie chart segmented by user attribute.
What to Act On
High unanswered rate → review and expand knowledge sources in the AI Center for the most common unanswered topics
Topics with high failed answers → add or update Custom Q&A entries for those topics
High negative feedback on a topic → review the knowledge source content and prompt accuracy for that area
Low total users relative to active system users → verify AI Answers is enabled and surfaced in the Pro Menu for this system
Important Note
AI-generated topics are produced by a third-party LLM and may occasionally be inaccurate. AI Answers requires 48 hours to process data before it appears in the dashboard.
AI Action Bar — Reporting & Analytics
The AI-enabled Action Bar is an intelligent proactive overlay available on all web applications. Users can run quick actions, use reading and writing tools, receive AI-generated suggestions, create custom actions, and access AI chat — all within the flow of work.
Key Metrics
(Coming Soon!)
Active Users: Users who visited the system while WalkMe was loaded, regardless of interacting with a WalkMe item
Users Exposed: Unique users who were shown the Action Bar widget on screen
Users Interacted: Unique users who clicked a launcher or performed an action in the Action Bar
% of Active System Users: Users who saw the Action Bar ÷ total active users
% of Users WalkMe Was Available To: Users who used an Action Bar action ÷ users who had the Action Bar available to them
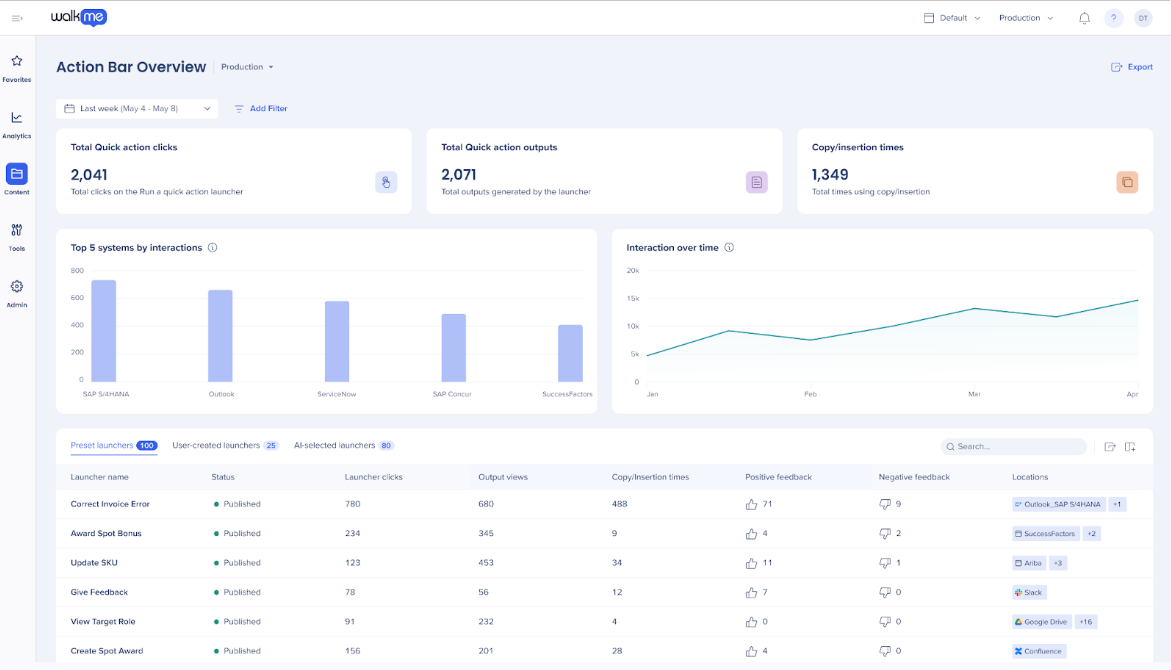
Output Views: Total outputs fully displayed from a launcher (output must be fully displayed to count)
Copy/Insertion Times: Number of times a generated output was copied or inserted by the user
Positive / Negative Feedback: User feedback clicks per launcher
Dashboard Widgets
(Coming Soon!)
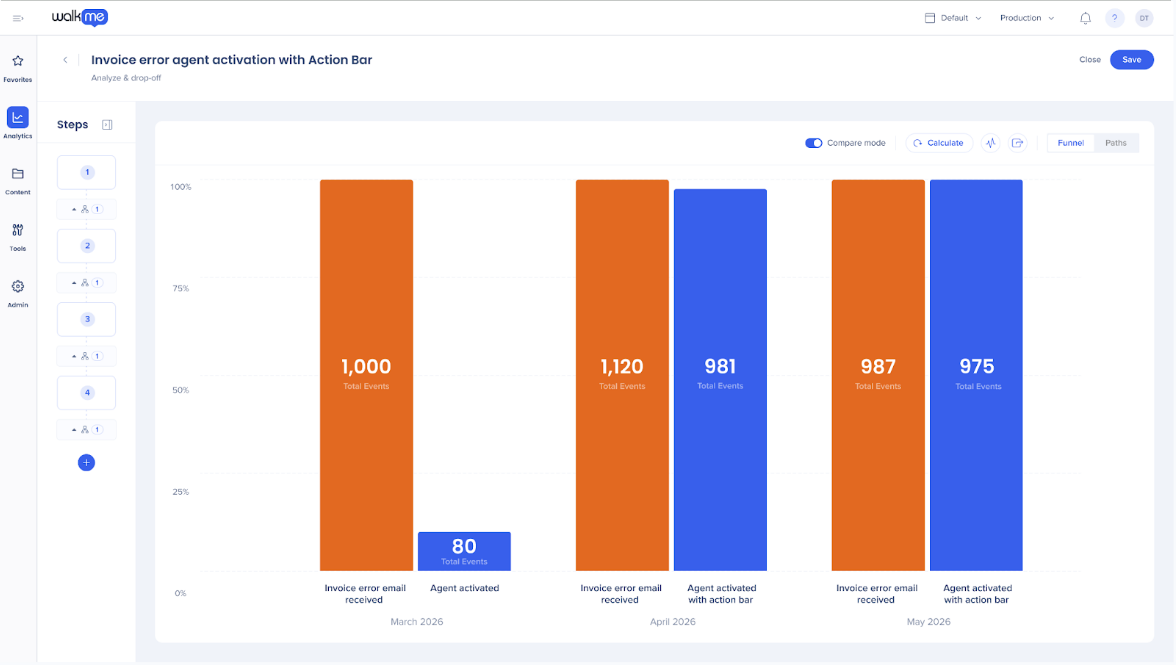
User Analysis Funnel: Active users → Users Exposed → Users Interacted. Shows the drop-off at each stage and calculates the percentage ratios.
User Adoption Trend: Time-series view of the funnel — useful for tracking impact of new launcher deployments or user communications.
Launchers Overview (table): All Action Bar launchers with status, total users, total clicks, output views, copy/insertion times, and feedback. Two views:
Builder Created — out-of-the-box and console-built launchers, including quick actions and writing/reading tools
End-User Created — launchers created by end-users via the custom actions feature in the Action Bar
Launcher Deep Dive: Click any launcher to see detailed performance over time including output views, copy/insertion, and feedback trends.
What to Act On
High exposure, low interaction → launcher labels may be too vague or apply Microcopy Principles to improve clarity and specificity
Low output copy/insertion rate → the generated content may not meet user needs or review and refine the launcher prompt
High volume of end-user-created launchers → users are identifying gaps in builder-created actions or review popular custom actions and promote them
Consistent negative feedback on a launcher → review the prompt, knowledge source, or output format for that specific action
Important Note
AI Action Bar launchers appear under the AI Action Bar Dashboard — not the standard Launcher tab in Insights Content. AI Action Steps in Smart Walk-Thrus are also tracked here under Launcher metrics.
AI SmartTips — Reporting & Analytics
AI SmartTips improve data quality of open-text form fields by leveraging generative AI (LLM models such as Azure OpenAI) to evaluate responses in real-time and suggest text improvements. Builders set a natural language validation rule; the AI judges whether user input meets the criteria.
Key Metrics
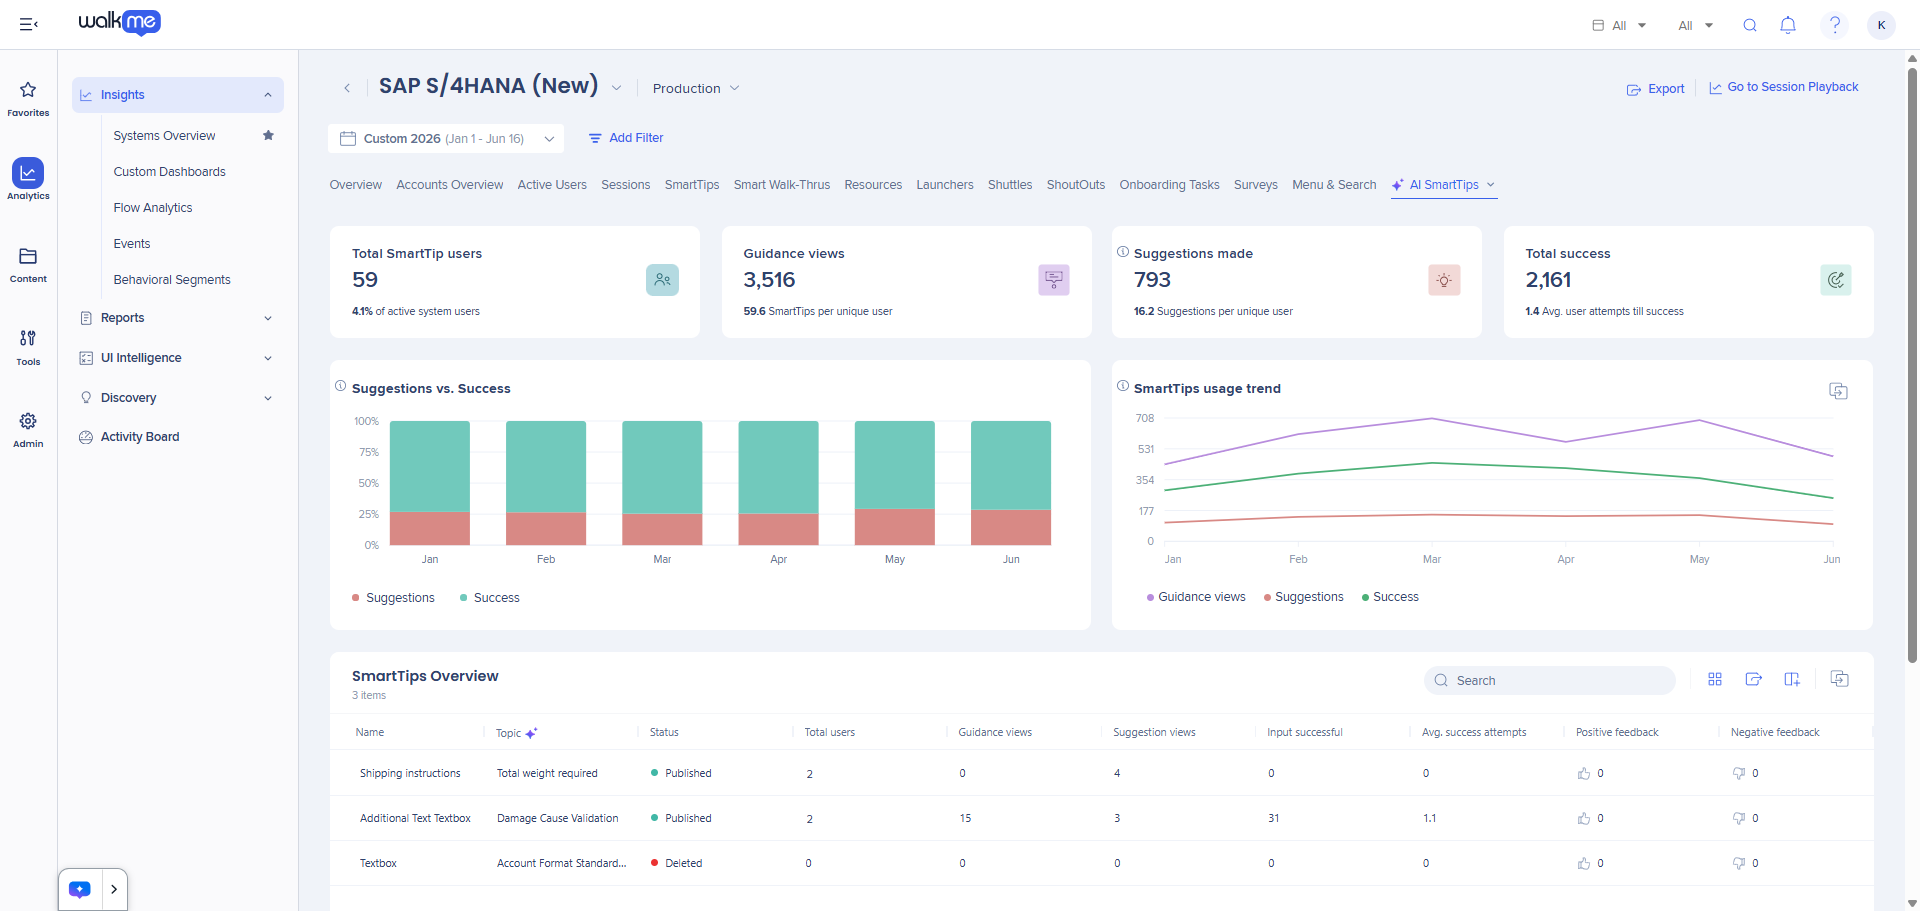
Total Users: Unique users shown an AI SmartTip suggestion (the user does not need to open the SmartTip bubble to be counted)
Total Suggestions: Total number of AI SmartTip suggestions shown to users
Total Successes: Number of times a user's input was accepted as valid by the AI
Success Rate: Total successes ÷ total suggestions — the core measure of SmartTip effectiveness
Topics: AI-generated groupings of SmartTips by theme, making it easier to analyse related field sets
Dashboard Widgets
Suggestions vs. Success (trend graph): Tracks suggestion volume and success rate over time. A rising success rate indicates users are improving inputs in response to AI guidance, or that a prompt has been effectively refined.
SmartTips Usage Trend: Time-series view of SmartTip exposure. Confirms SmartTips are reaching users after deployment and surfaces drop-off after system changes.
SmartTips Overview (table): Per-SmartTip breakdown grouped by topic showing suggestions, successes, and success rate. Click any item to open the deep-dive side panel with performance over time.
What to Act On
Low success rate on a specific SmartTip → the prompt may be too strict or poorly matched to how users write; refine the prompt language
No improvement in success rate over time → check that user-facing feedback messages are specific enough to guide behavior change
SmartTips with zero suggestions → check publishing status, segmentation rules, and whether the field is actively used
Topics with consistently low success → escalate to the AI SME or the validation criteria may need a policy or process review
AI Condition & Rule Engine — Reporting & Analytics
AI Condition & Rule Engine are natural-language operators added to the Condition Builder. They allow builders to trigger WalkMe content based on text meaning or tone — for example, detecting whether user input contains inappropriate language or meets a policy condition — rather than exact-match logic.
Note on Naming
WalkMe uses both 'AI Rules' and 'AI Conditions' across their documentation. The AI Dashboards article and release notes use 'AI Rules' as the dashboard tab name. The feature itself (operators in the Condition Builder) is labelled 'AI Conditions' in the Help Center. Both refer to the same underlying capability.
Key Metrics
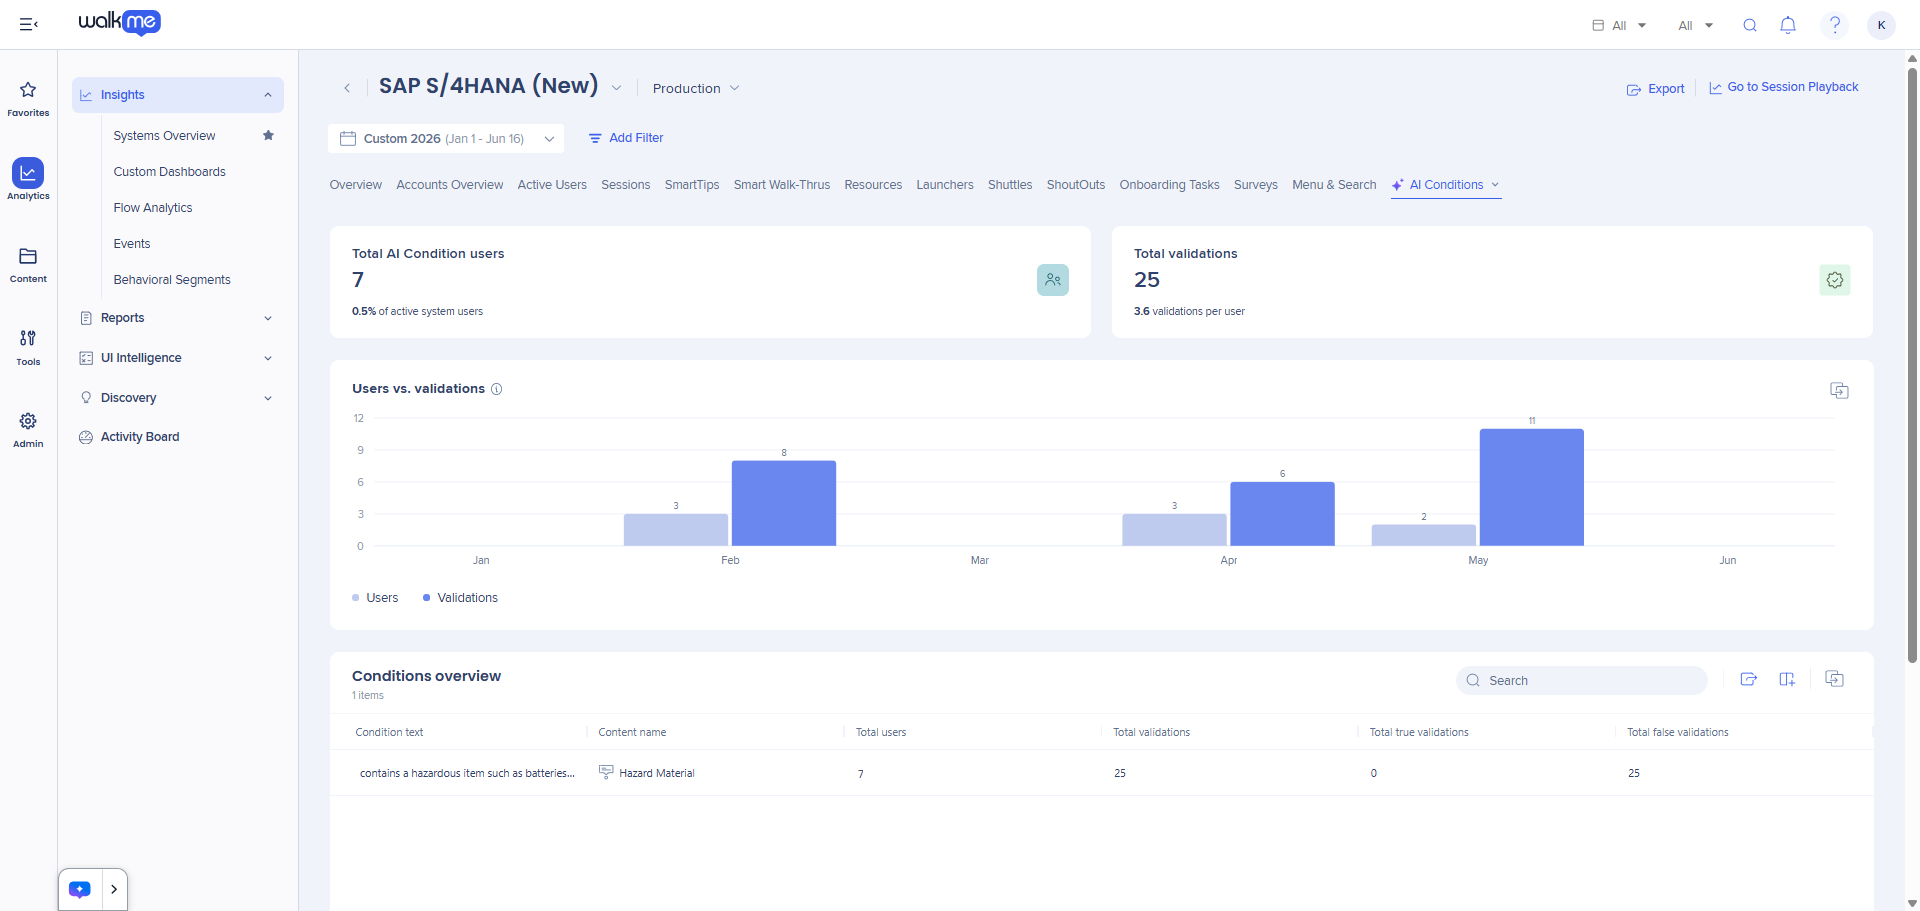
Total Users: Unique users whose input triggered an AI rule evaluation
Total Validations: Total number of times an AI rule evaluated a user input
Triggered Rate: Proportion of evaluations where the condition was met and an action was taken
True Validations: Total number of times the validation evaluated as true (condition met)
False Validations: Total number of times the validation evaluated as false (condition not met)
Dashboard Widgets
Users vs. Validations (trend graph): Tracks how often AI rules are evaluating inputs and how many users are affected over time.
Rules Overview (table): All active AI rules with total validations and triggered rates. Click any rule to open a deep-dive side panel.
AI Rule Deep Dive: A line graph comparing the percentage of unique users receiving true vs. false validations over time. Note: total validations may not equal plays for a piece of content, since the rule may be part of a larger display condition.
What to Act On
Very high triggered rate → the condition may be too broad; narrow the prompt criteria in the Condition Builder
Very low triggered rate → the condition may not be matching user inputs as expected or test with real examples and adjust the prompt
Inconsistent triggered rate over time → check whether an underlying process or policy change has affected user input patterns
AI in Smart Walk-Thrus
AI Action Steps in Smart Walk-Thrus allow builders to embed AI Launchers within a guided flow — using AI-generated output as part of an automated process. Builders can also optionally display the AI Launcher output in the Action Bar during the step.
These are classified as Proactive AI (Pinned AI) and are reported across two places:
What to Measure
Where to Find It
Walk-Thru play rate and completion rate
Smart Walk-Thrus tab in Insights Content (system-level)
Step-level drop-off within a Walk-Thru
Smart Walk-Thru deep dive in Insights Content
AI Launcher output generated within a Walk-Thru step
AI Action Bar Dashboard → Launchers Overview
User interaction with AI output during a Walk-Thru step
AI Action Bar Dashboard → Launcher Deep Dive
WalkMe Insights: Platform Overview
The AI Dashboards sit within WalkMe Insights, which is fully integrated into the WalkMe Console. Key Insights features relevant to AI reporting:
Overview
Systems Overview: The main Insights landing page. Select any monitored system to access its dashboards, including the AI Dashboards tab.
AI Dashboards tab: Available from the apps bar within any system overview. Displays up to four tabs based on your AI package: AI Answers, AI Action Bar, AI SmartTips, and AI Condition & Rule Engine.
Custom Dashboards: Create personalized dashboards by adding metric widgets from different systems. Use to combine AI metrics with standard DAP metrics for stakeholder reporting.
Reports & Report Builder: Build scheduled reports and subscribe stakeholders to automated delivery. Export widgets to CSV or XLSX for use in external reporting tools or executive presentations.
Flow Analytics: How users move through workflows. Note: AI deployables are not available in Flow Analytics — use the AI Dashboards for AI-specific funnel data.
Get Started: Reporting Checklist
Setup
Confirm AI Dashboard access is configured for each role — admin, AI SME, Innovation Expert, Program Manager
Identify which AI products are live and confirm which dashboard tabs are available in your AI package
Bookmark the AI Dashboards tab for each system you are actively monitoring
Subscribe key stakeholders to scheduled AI dashboard reports in the Console
Regular Review Cadence
Monthly: AI Answers unanswered rate and Action Bar funnel — update knowledge sources and refine launcher labels
Monthly: Action Bar end-user-created launcher volume — identify gaps and promote popular custom actions
Quarterly: AI SmartTip success rates — refine prompts for items below target threshold
Quarterly: AI Condition & Rule Engine triggered rates — recalibrate conditions firing too broadly or too rarely
Quarterly: Export and share a custom dashboard report with the Program Manager and business stakeholders



 (Coming Soon!)
 (Coming Soon!)