Brief Overview
When analyzing your content data in the Insights content tabs, you can dive deeper into certain categories, including Smart Walk-Thrus, ShoutOuts, and Surveys. Not only can you get an insightful overview of these WalkMe Items, but you can also investigate each item individually.
To read more about analyzing these WalkMe items as a group:
Insights Content Tabs
Access
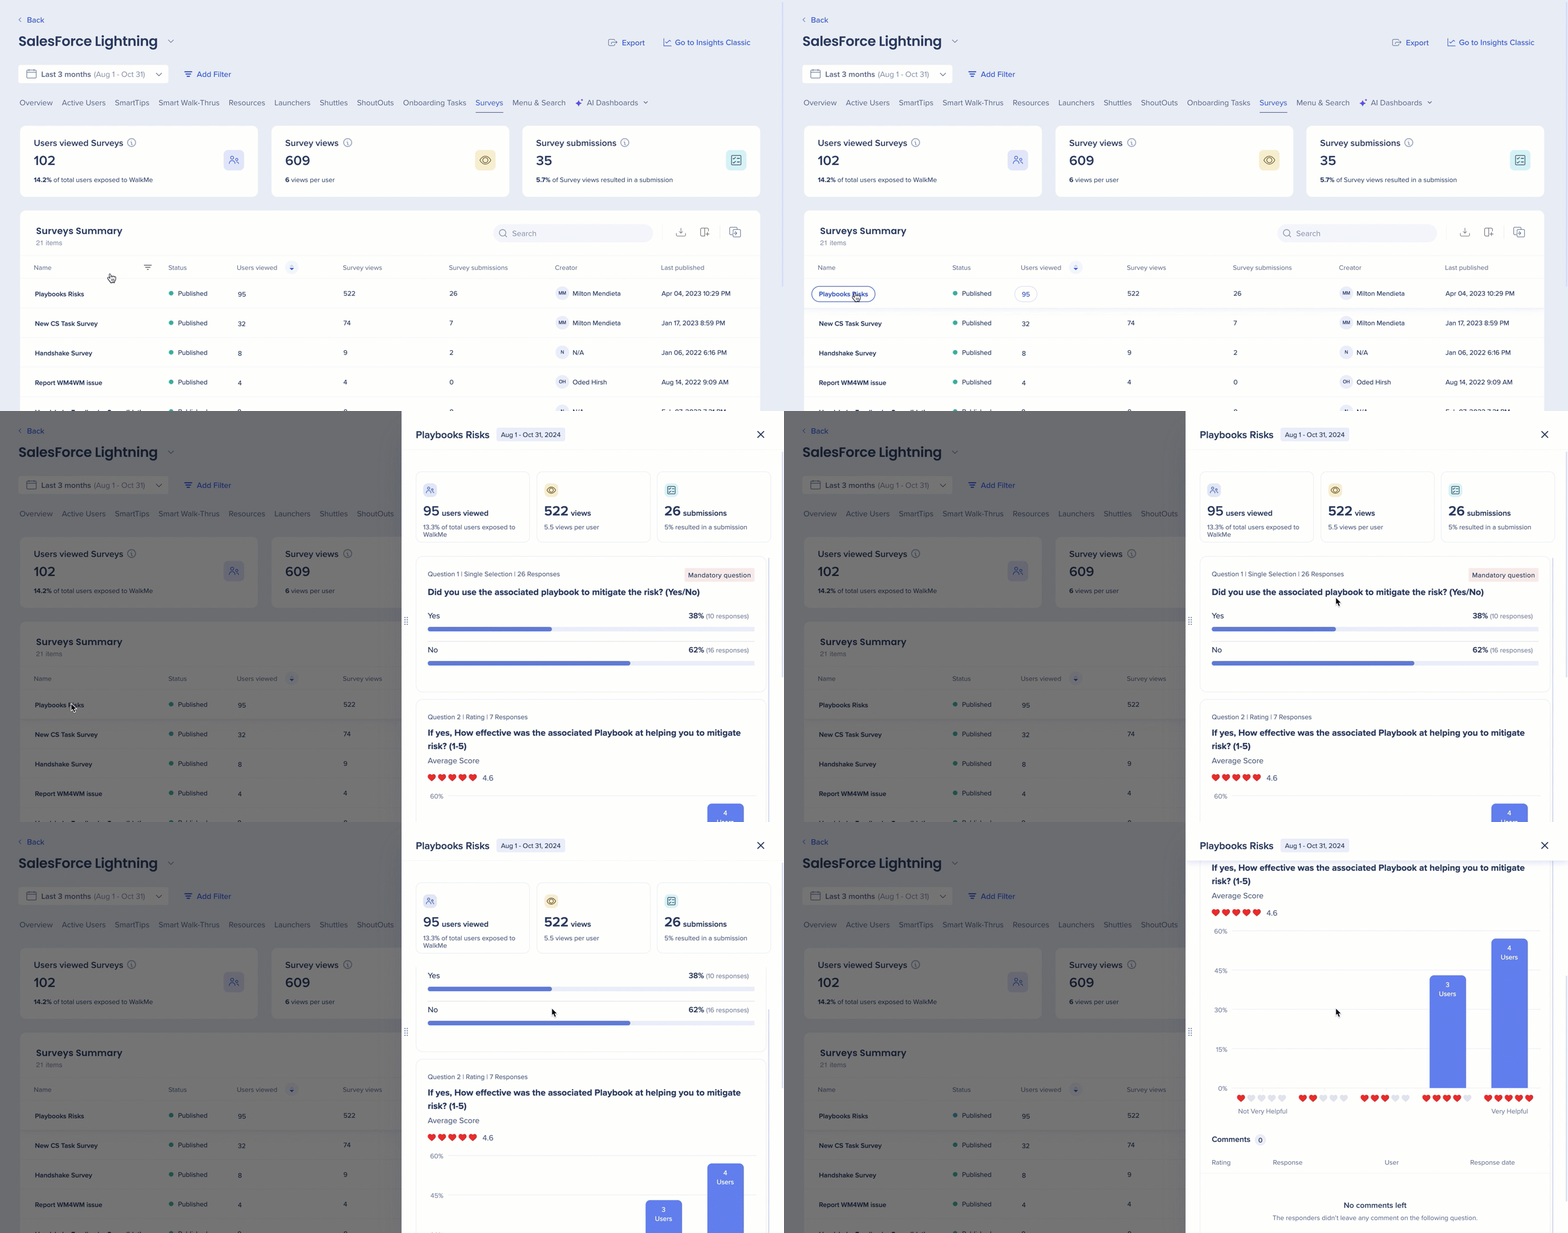
Click on a WalkMe item name in the summary table to open the deep dive panel, where you'll find detailed insights for the specific item.
Smart Walk-Thru
General metrics

- Unique user plays: The number of unique users who played this SWT, excluding multiple plays (branching, connecting another SWT), and the percentage of users WalkMe was available to
- Total plays: The total number of times any Smart Walk-Thru was played (including multiple plays by the same user), and the average number of plays per user
- Plays that include more than one Smart Walk-Thru (for example, branching and Connect to another Smart Walk-Thru) are counted as a single play
- Main goal Completions: The total count of main goals reached throughout all the Smart Walk-Thru plays, and the percentage of plays resulting in the main goal being completed
- Note: This counts only main goals, not milestone goals
Smart Walk-Thru step analysis
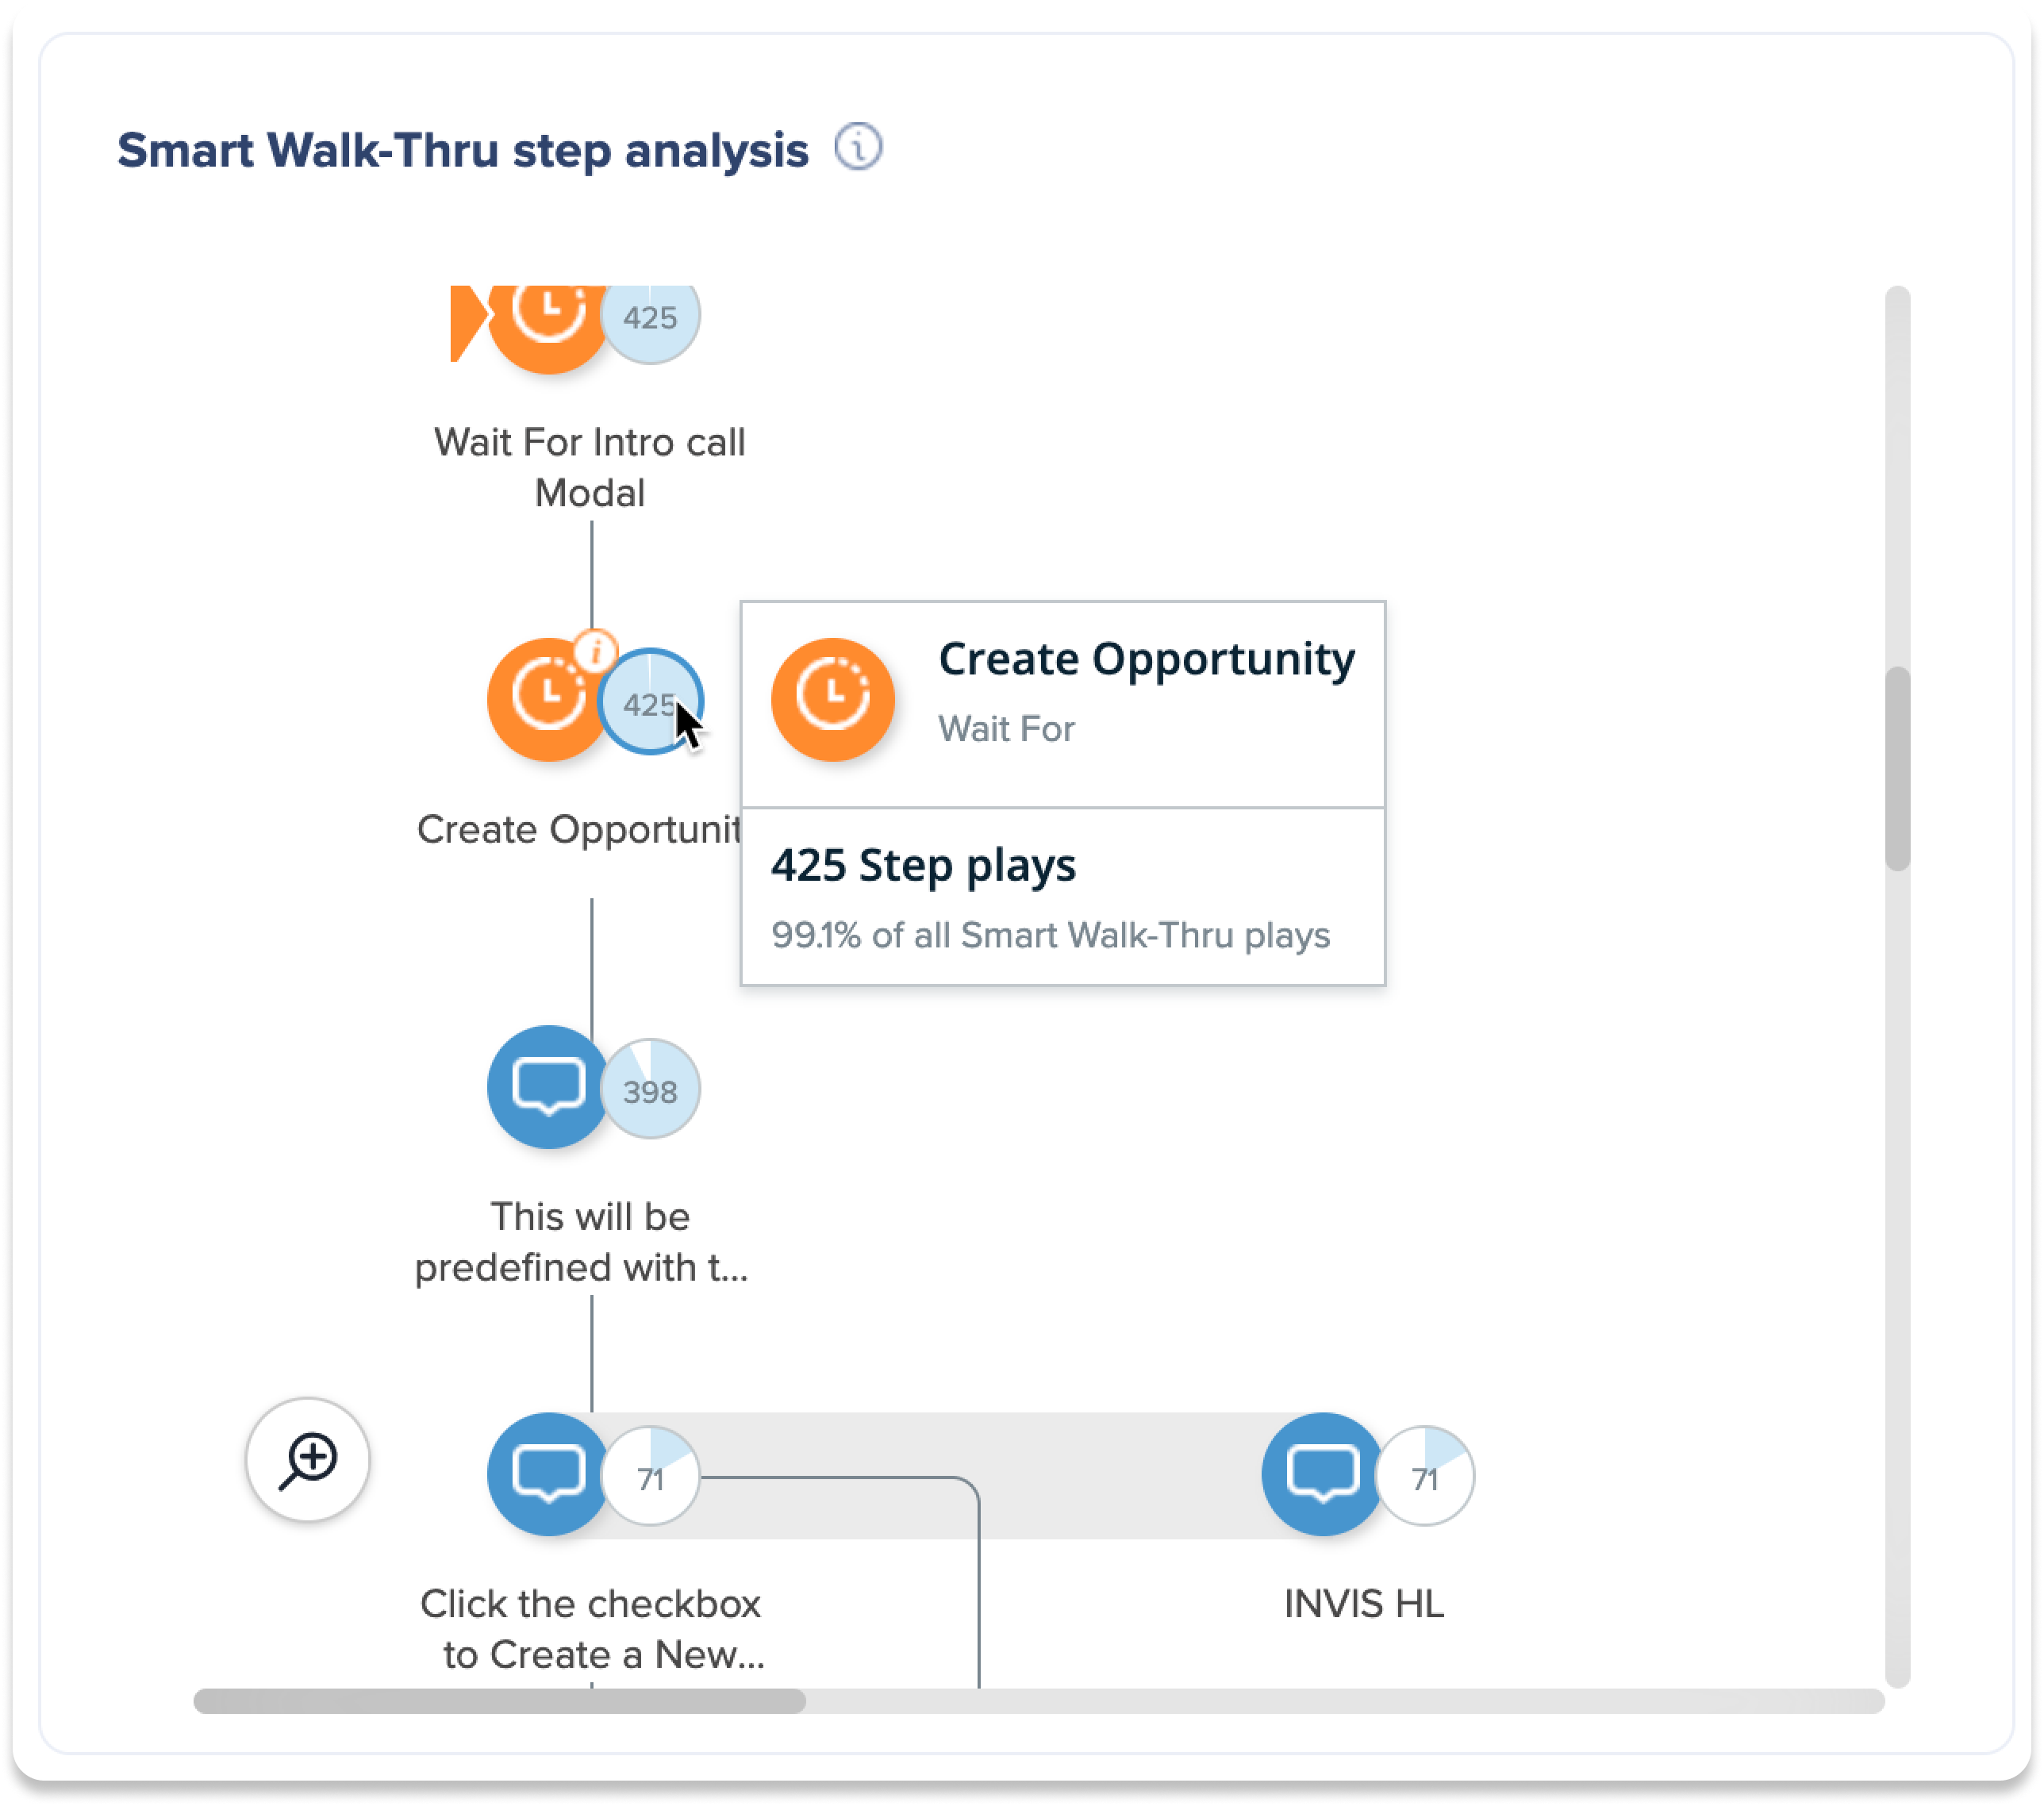
A flow diagram of each step, including branches, of this Smart Walk-Thru. The flow diagram, including names of steps and their position in the flow, reflects the last published state of the Smart Walk-Thru - any changes that were not published won't show up in this usage analysis
- Hover over the bubble to see the step name, step type, step plays, and the percentage of the time this step was played of all the times this Smart Walk-Thru was played
- The numbered bubbles indicate how many times each step was played for each unique Smart Walk-Thru play (no Smart Walk-Thru restarts or multiple same step plays). In other words, for each unique Smart Walk-Thru play each step will only be counted one time.
How it's being initiated?

Provides a list and pie chart indicating the various ways this Smart Walk-Thru is being initiated, and the percentage of total initiations each item represents.
Goal completion analysis
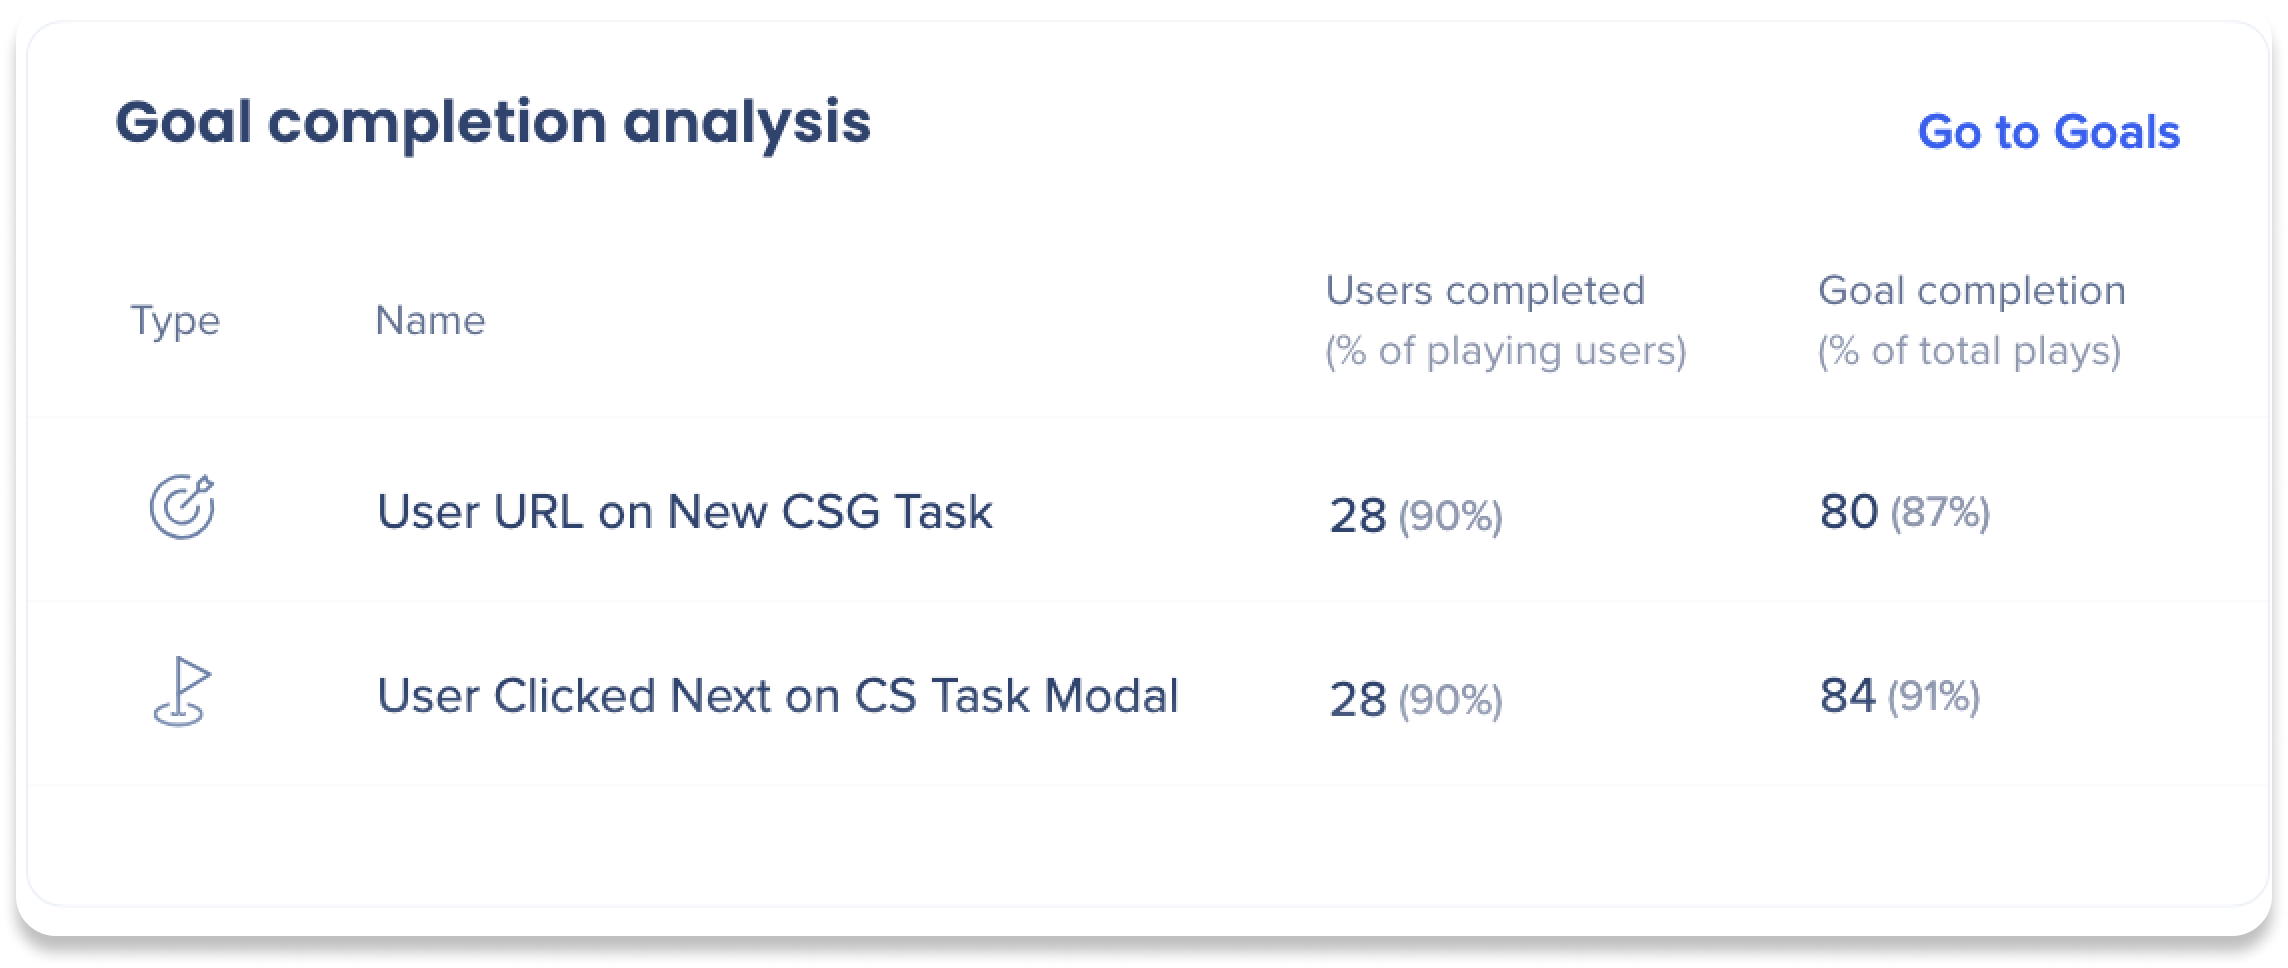
Table columns
- Type:
- Main goal: The dartboard icon indicates this is a main goal
- Milestone goal: The flag icon indicates a milestone goal
- Name: Name of a specific goal tied to the Smart Walk-Thru
- Users completed (% of playing users): The number of unique users who completed a goal and the percentage out of all users who played this Smart Walk-Thru
- Goal completion (% of total plays): The number of users who reached a goal and the percentage out of this Smart Walk-Thru plays
Go to Goals
Click Go to Goals to view the goals of the Smart Walk-Thru in the WalkMe Editor.

ShoutOuts
General metrics

- Users viewed: The total count of unique users who viewed this ShoutOut, and the percentage of users WalkMe was available to
- Views: The total count of times this ShoutOut was viewed (including multiple views by the same user), and the average number of views per user
- Clicks: The total number of times users clicked a button within the ShoutOu,t and the percentage of users that clicked-through
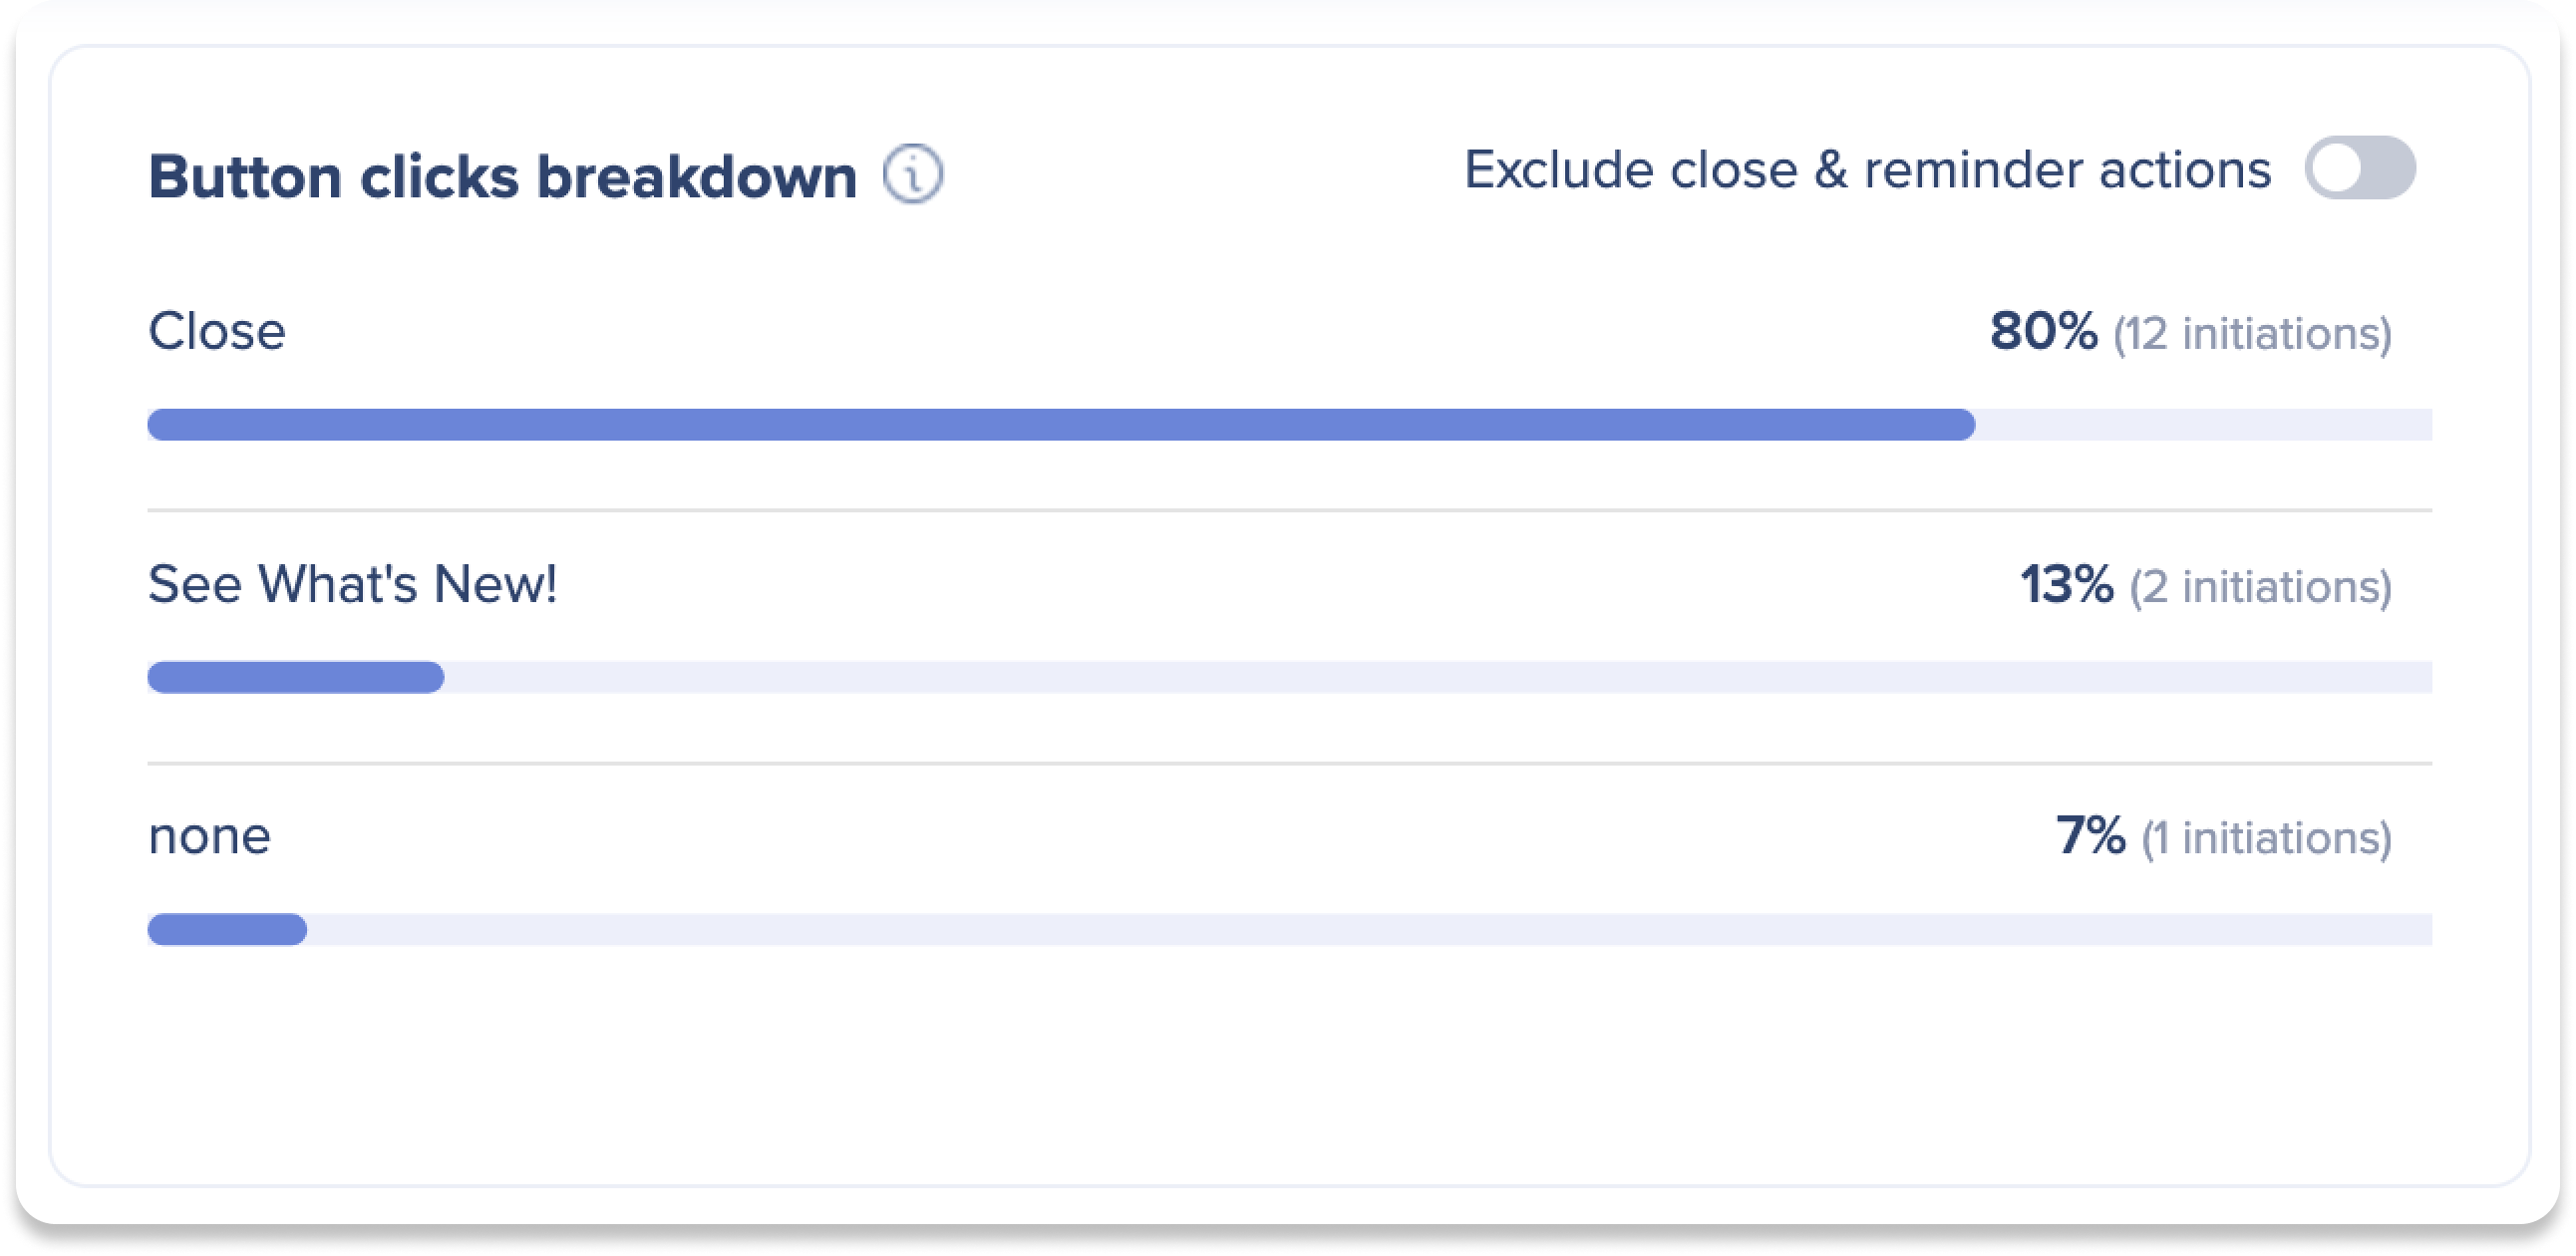
List of ShoutOut actions that were triggered by user (including Close and Reminder actions).
- Turn on the Exlude close & reminder actions toggle to remove those actions from the widget
How it's being initiated?

Provides a list and pie chart indicating the various ways this ShoutOut is being initiated, and the percentage of total initiations each item represents.
Goal completion analysis
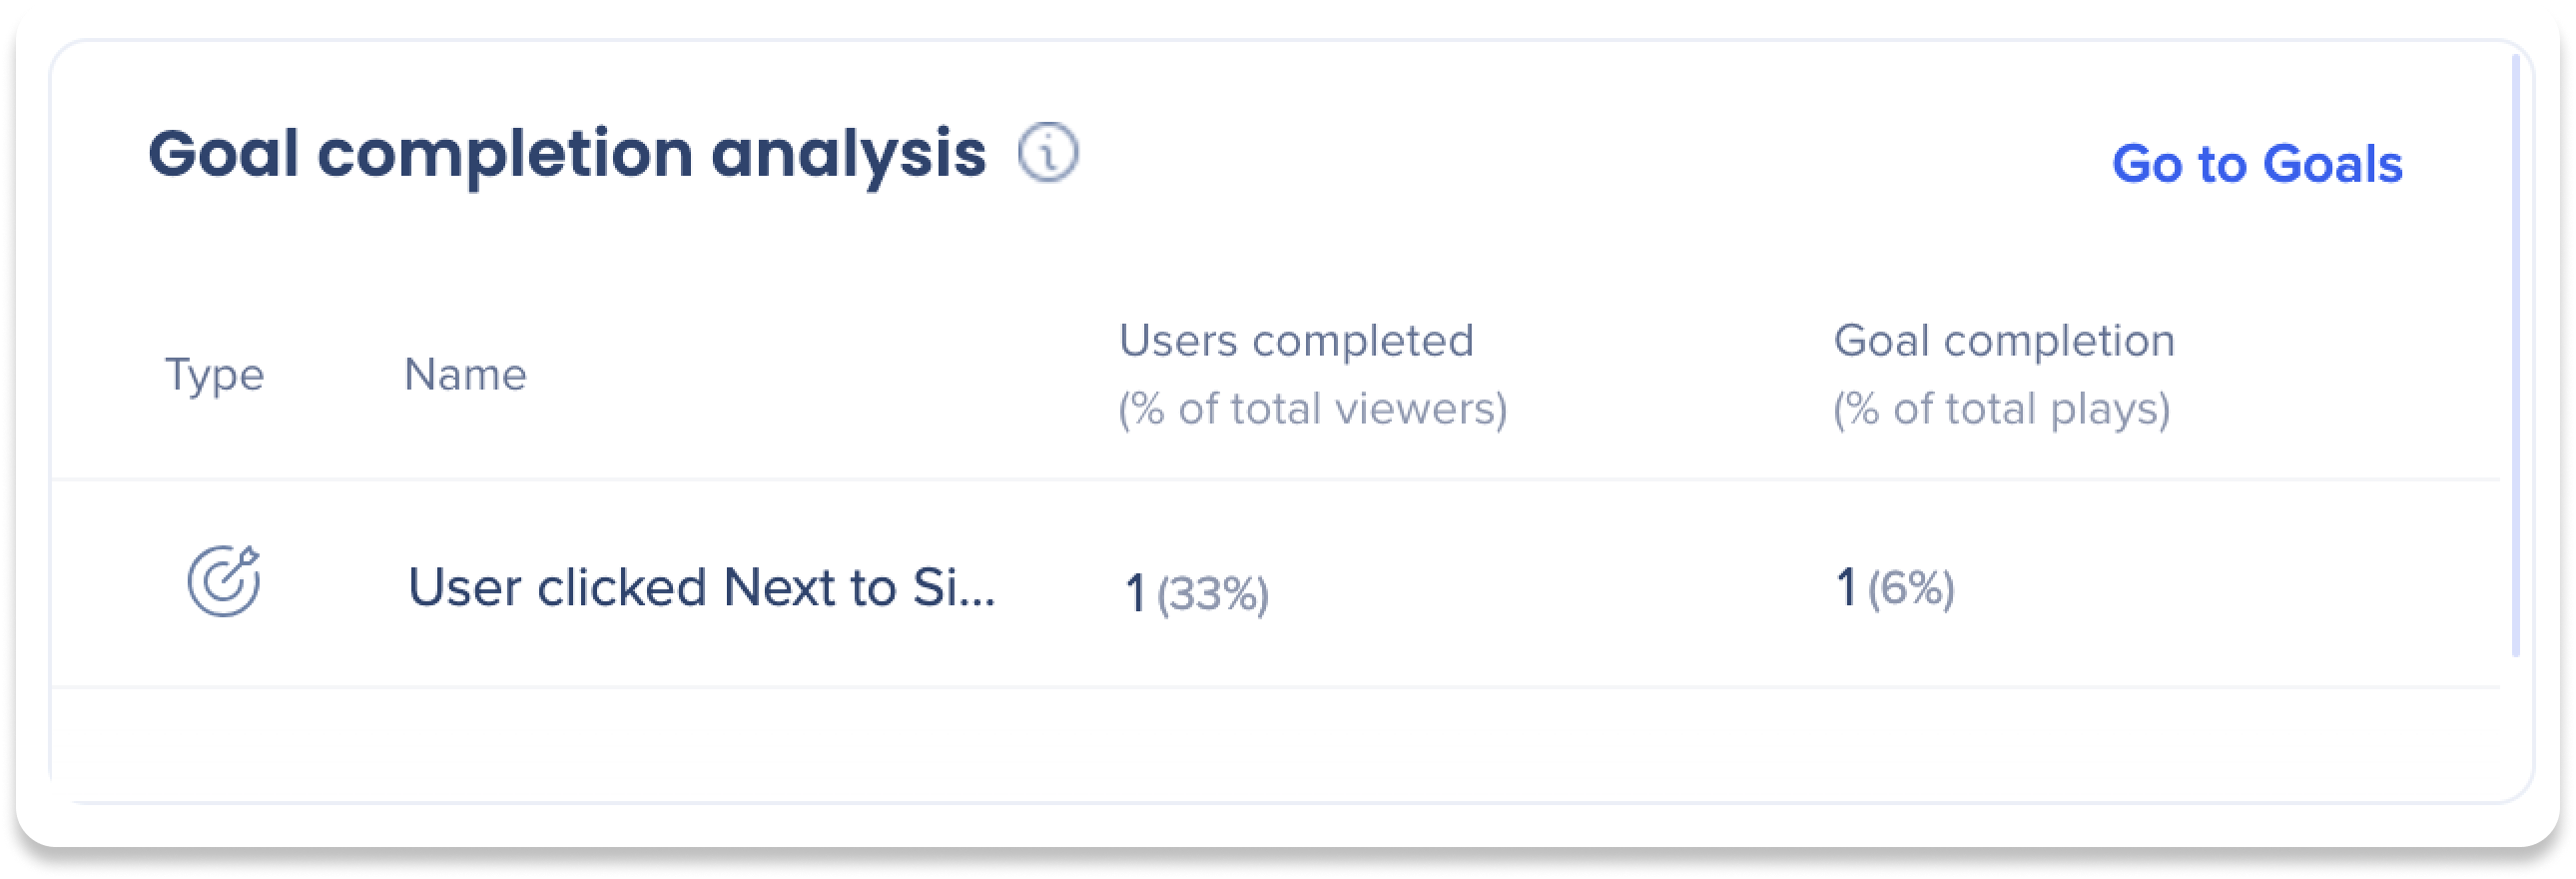
Table columns
- Type:
- Main goal: The dartboard icon indicates this is a main goal
- Milestone goal: The flag icon indicates a milestone goal
- Name: Name of a specific goal tied to the ShoutOut
- Users completed (% of playing users): The number of unique users who completed a goal and the percentage out of all users who played this ShoutOut
- Goal completion (% of total plays): The number of users who reached a goal and the percentage out of this ShoutOut plays
Go to Goals
Click Go to Goals to view the goals of the Smart Walk-Thru in the WalkMe Editor.
Surveys
General metrics

- Users viewed: The total count of unique users who viewed this Survey, and the percentage of users WalkMe was available to
- Views: The total count of times this Survey was viewed (including multiple views by the same user), and the average number of times each user viewed this Survey
- Submissions: The total count of surveys submitted, and the percentage of Survey views that resulted in a submission
Survey questions
- Each question widget contains the question asked, the question number out of all asked questions, the question type, and how many responses the question received
- The Mandatory question tag is displayed on questions that are required
- There are four different question types: Single selection, rating, free text, and net promoter score
Single selection
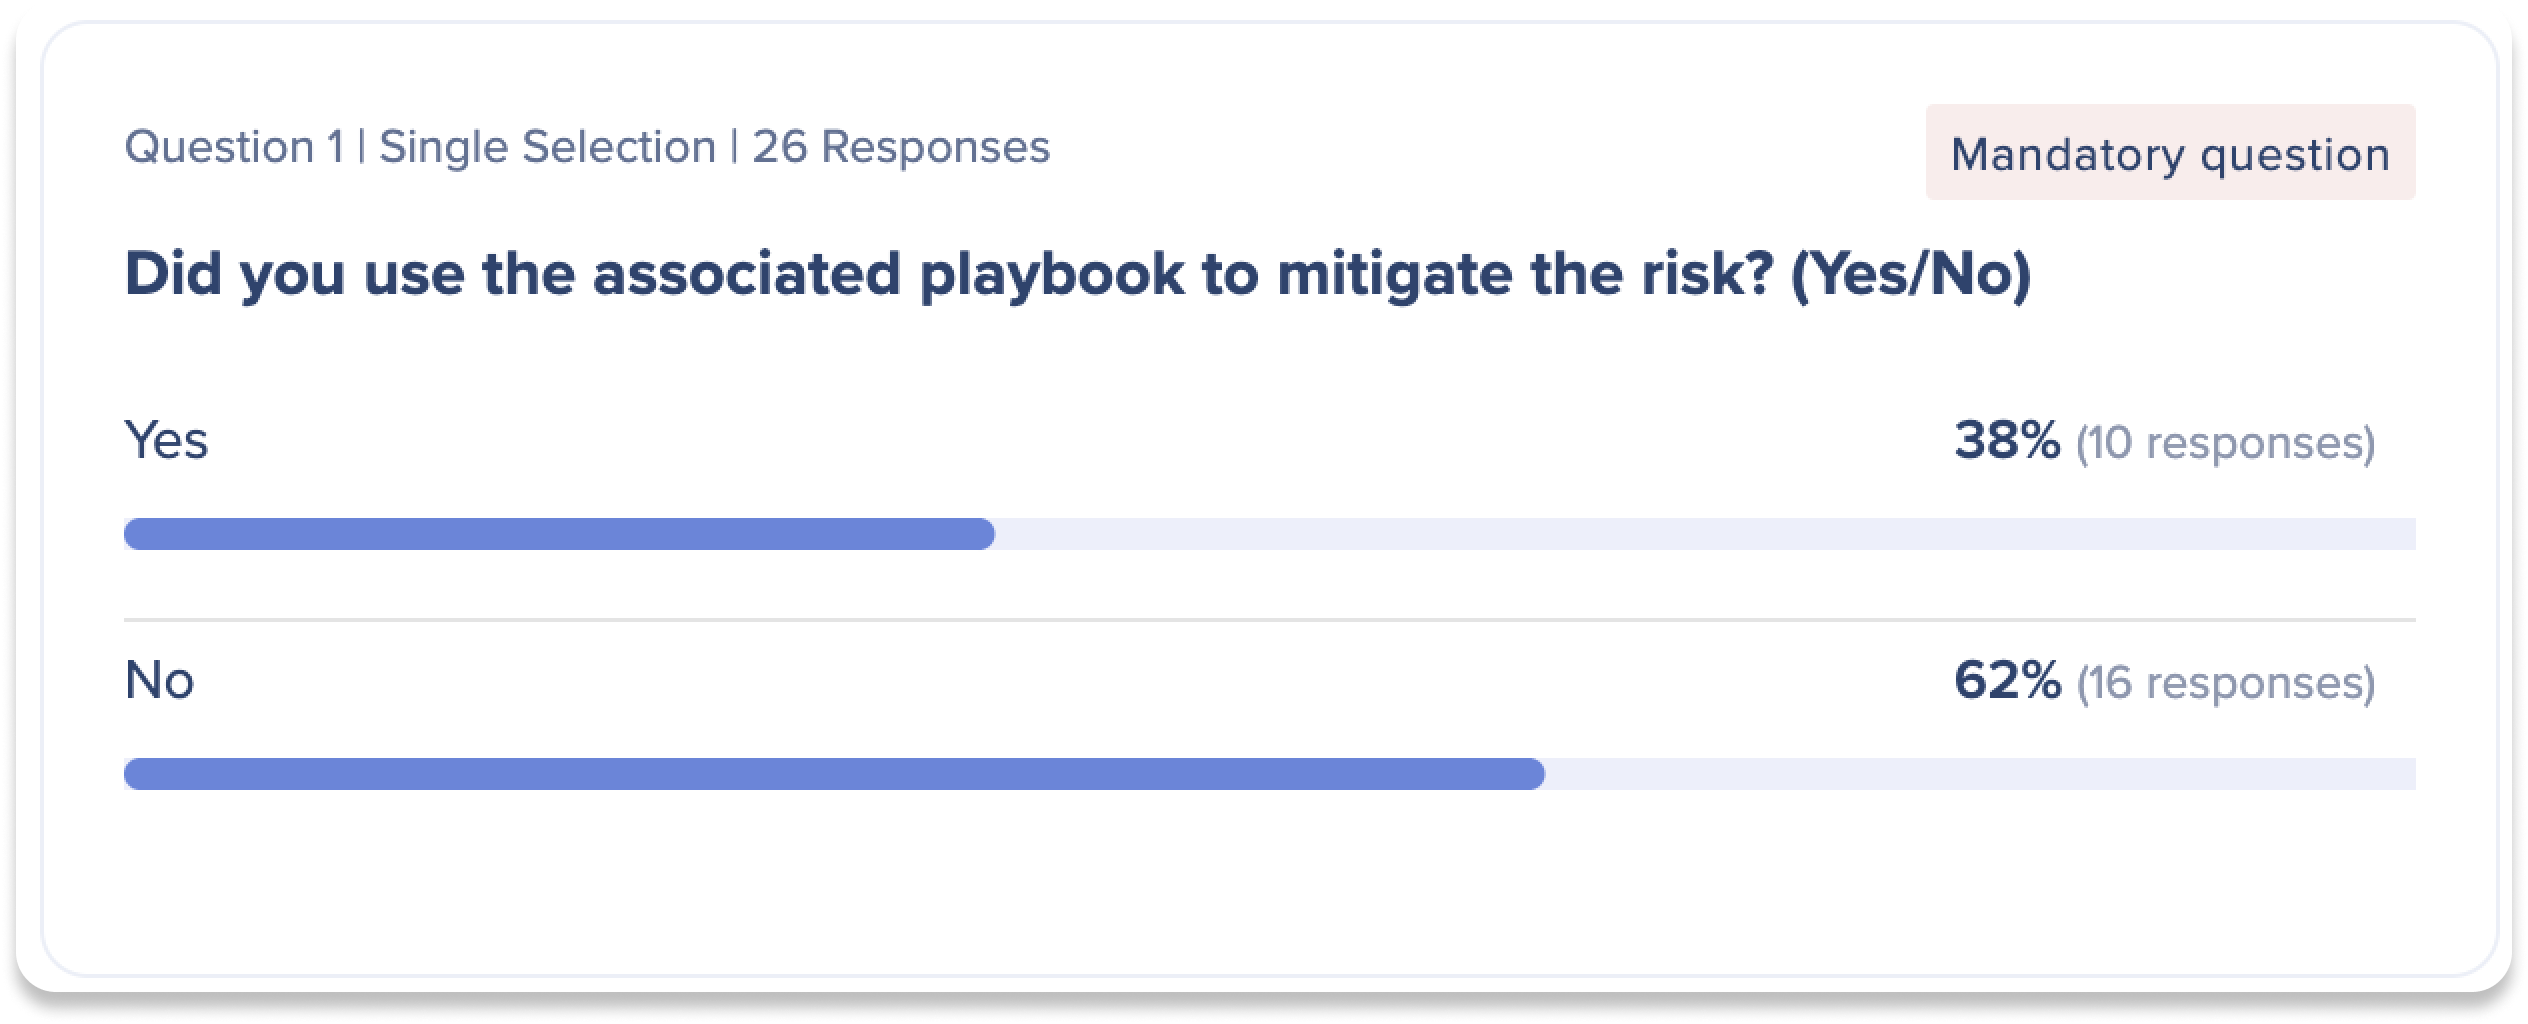
- The single selection question type is multiple choice, where only one option can be selected per user
- Each option displays the number of users who selected it and the percentage of these users relative to the total number of respondents for that question
Rating
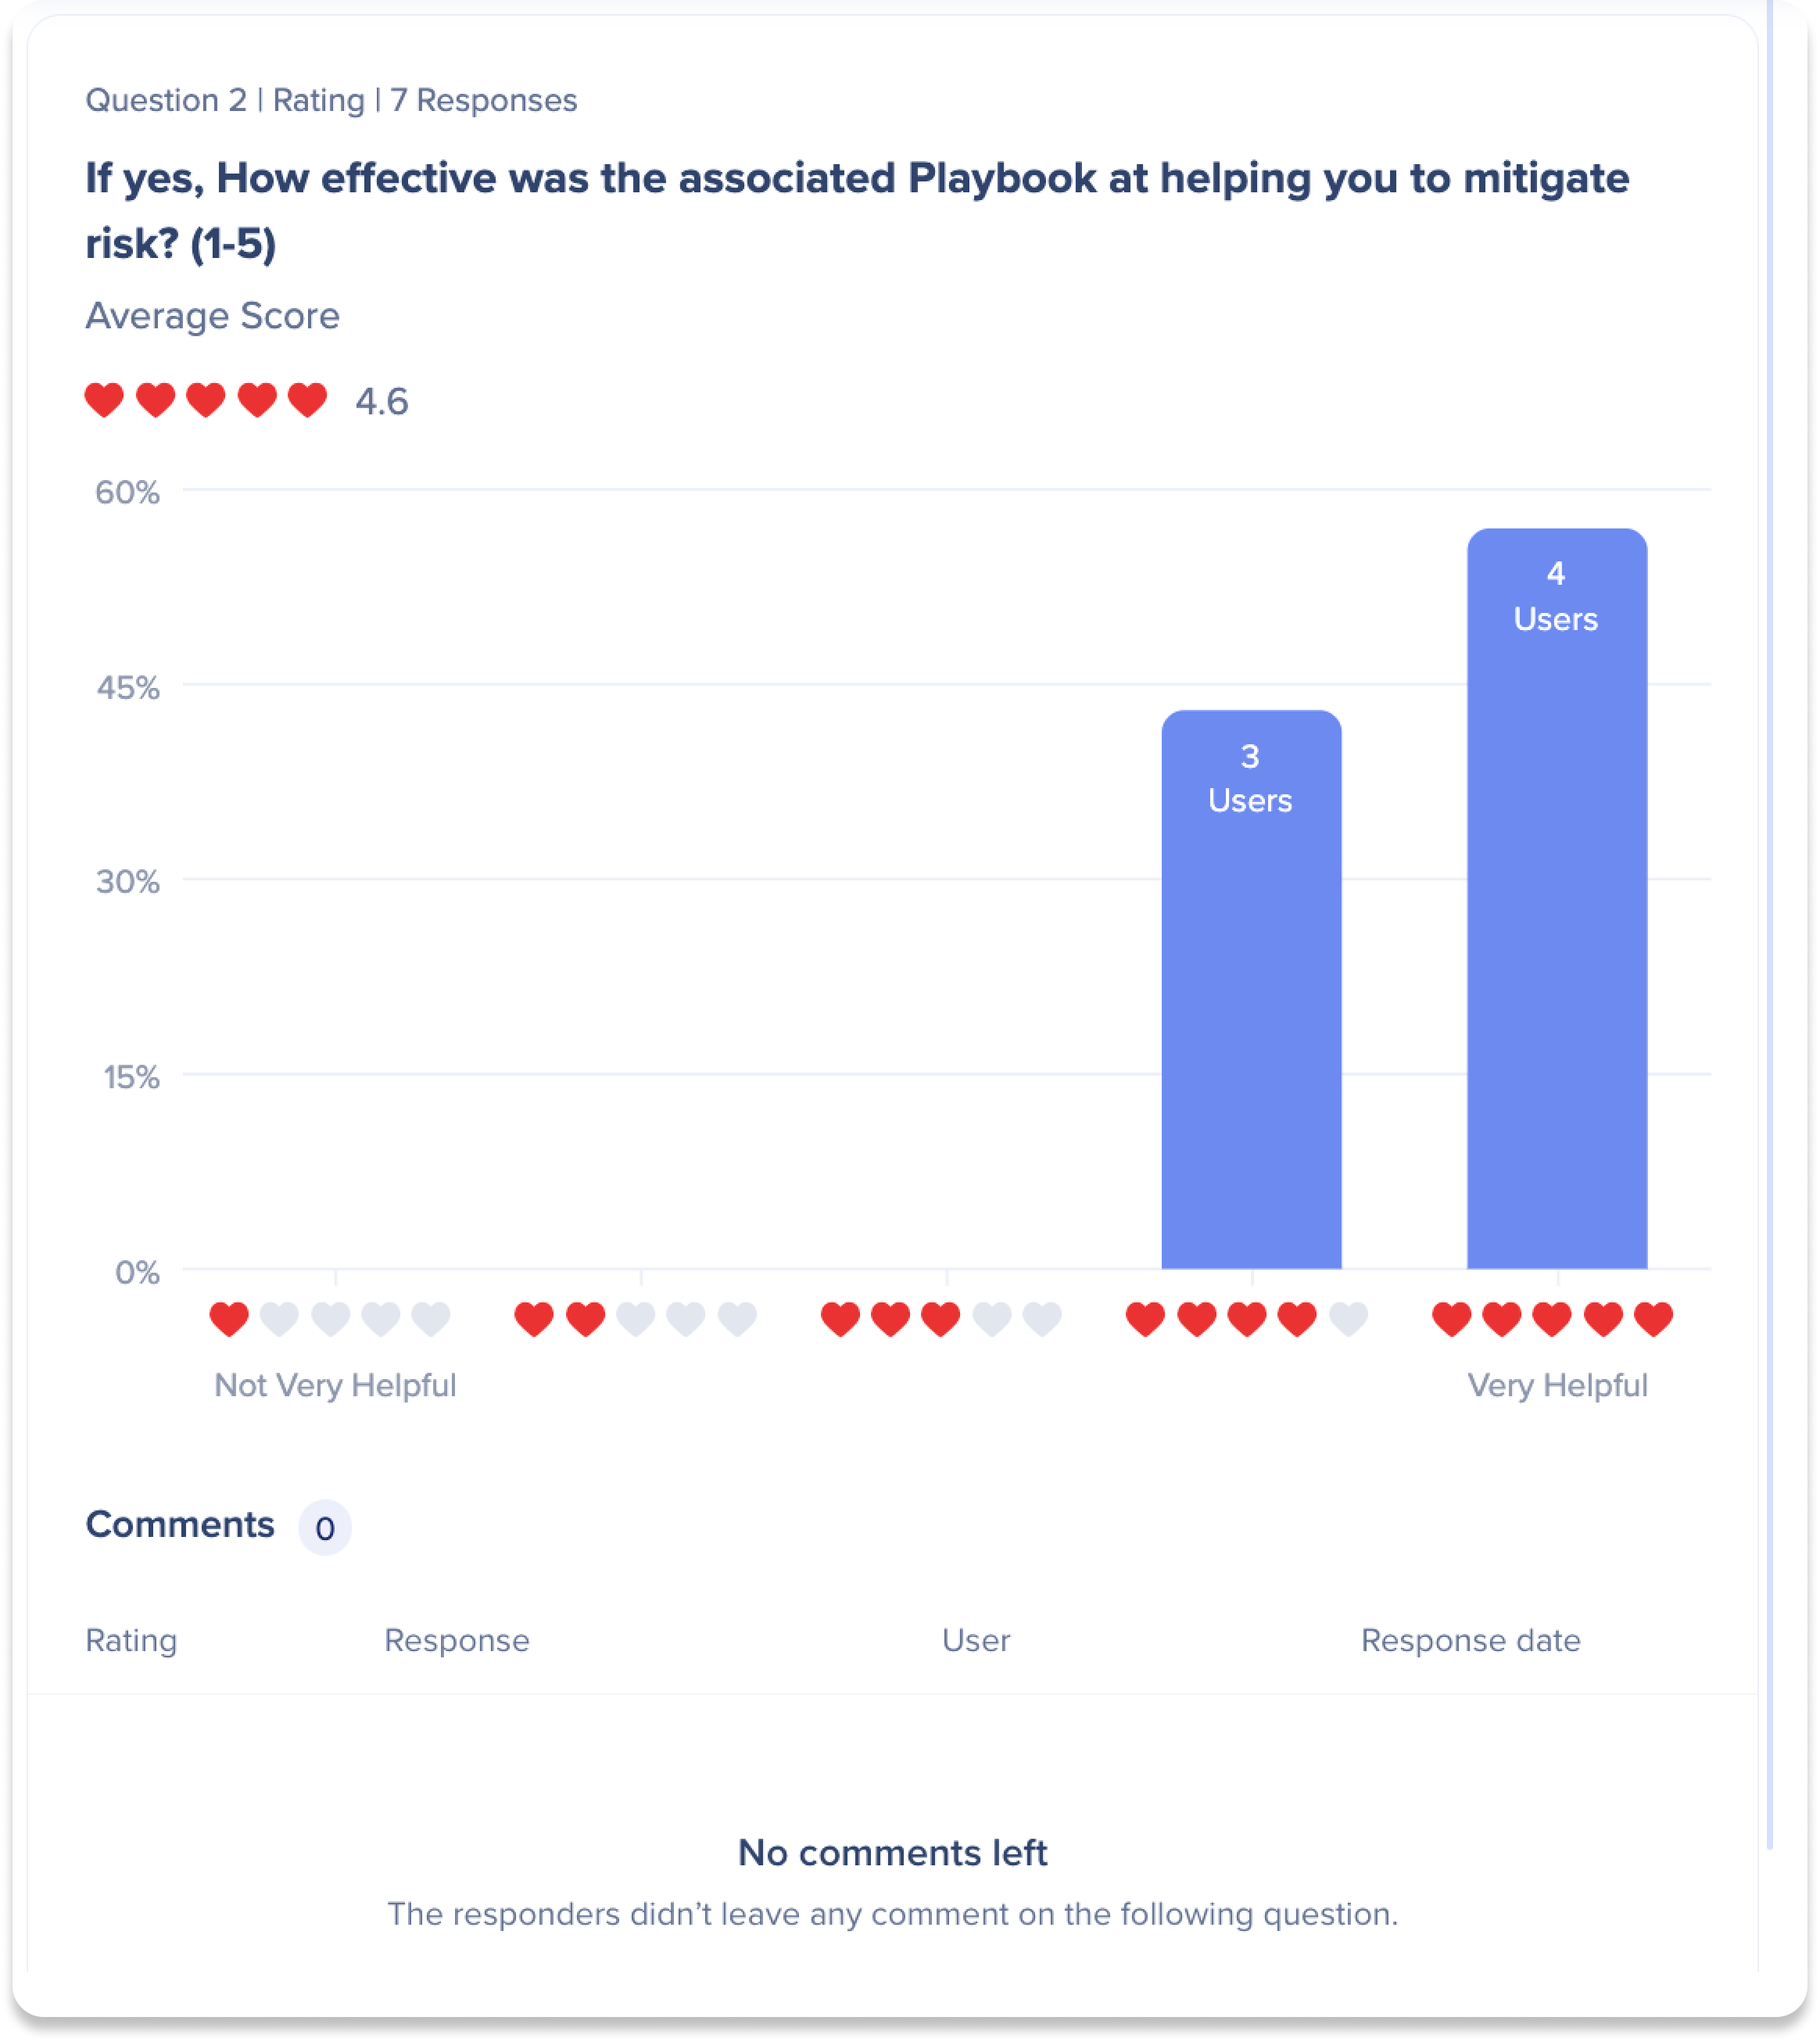
- The rating question type features a bar graph illustrating a rating scale from 1 to 5
- This graph shows the number of users who selected each rating, along with an average rating score from all respondents
- The comments section highlights the total number of comments for the question and provides detailed user data, including each comment's rating, response, username, and response date
Free text
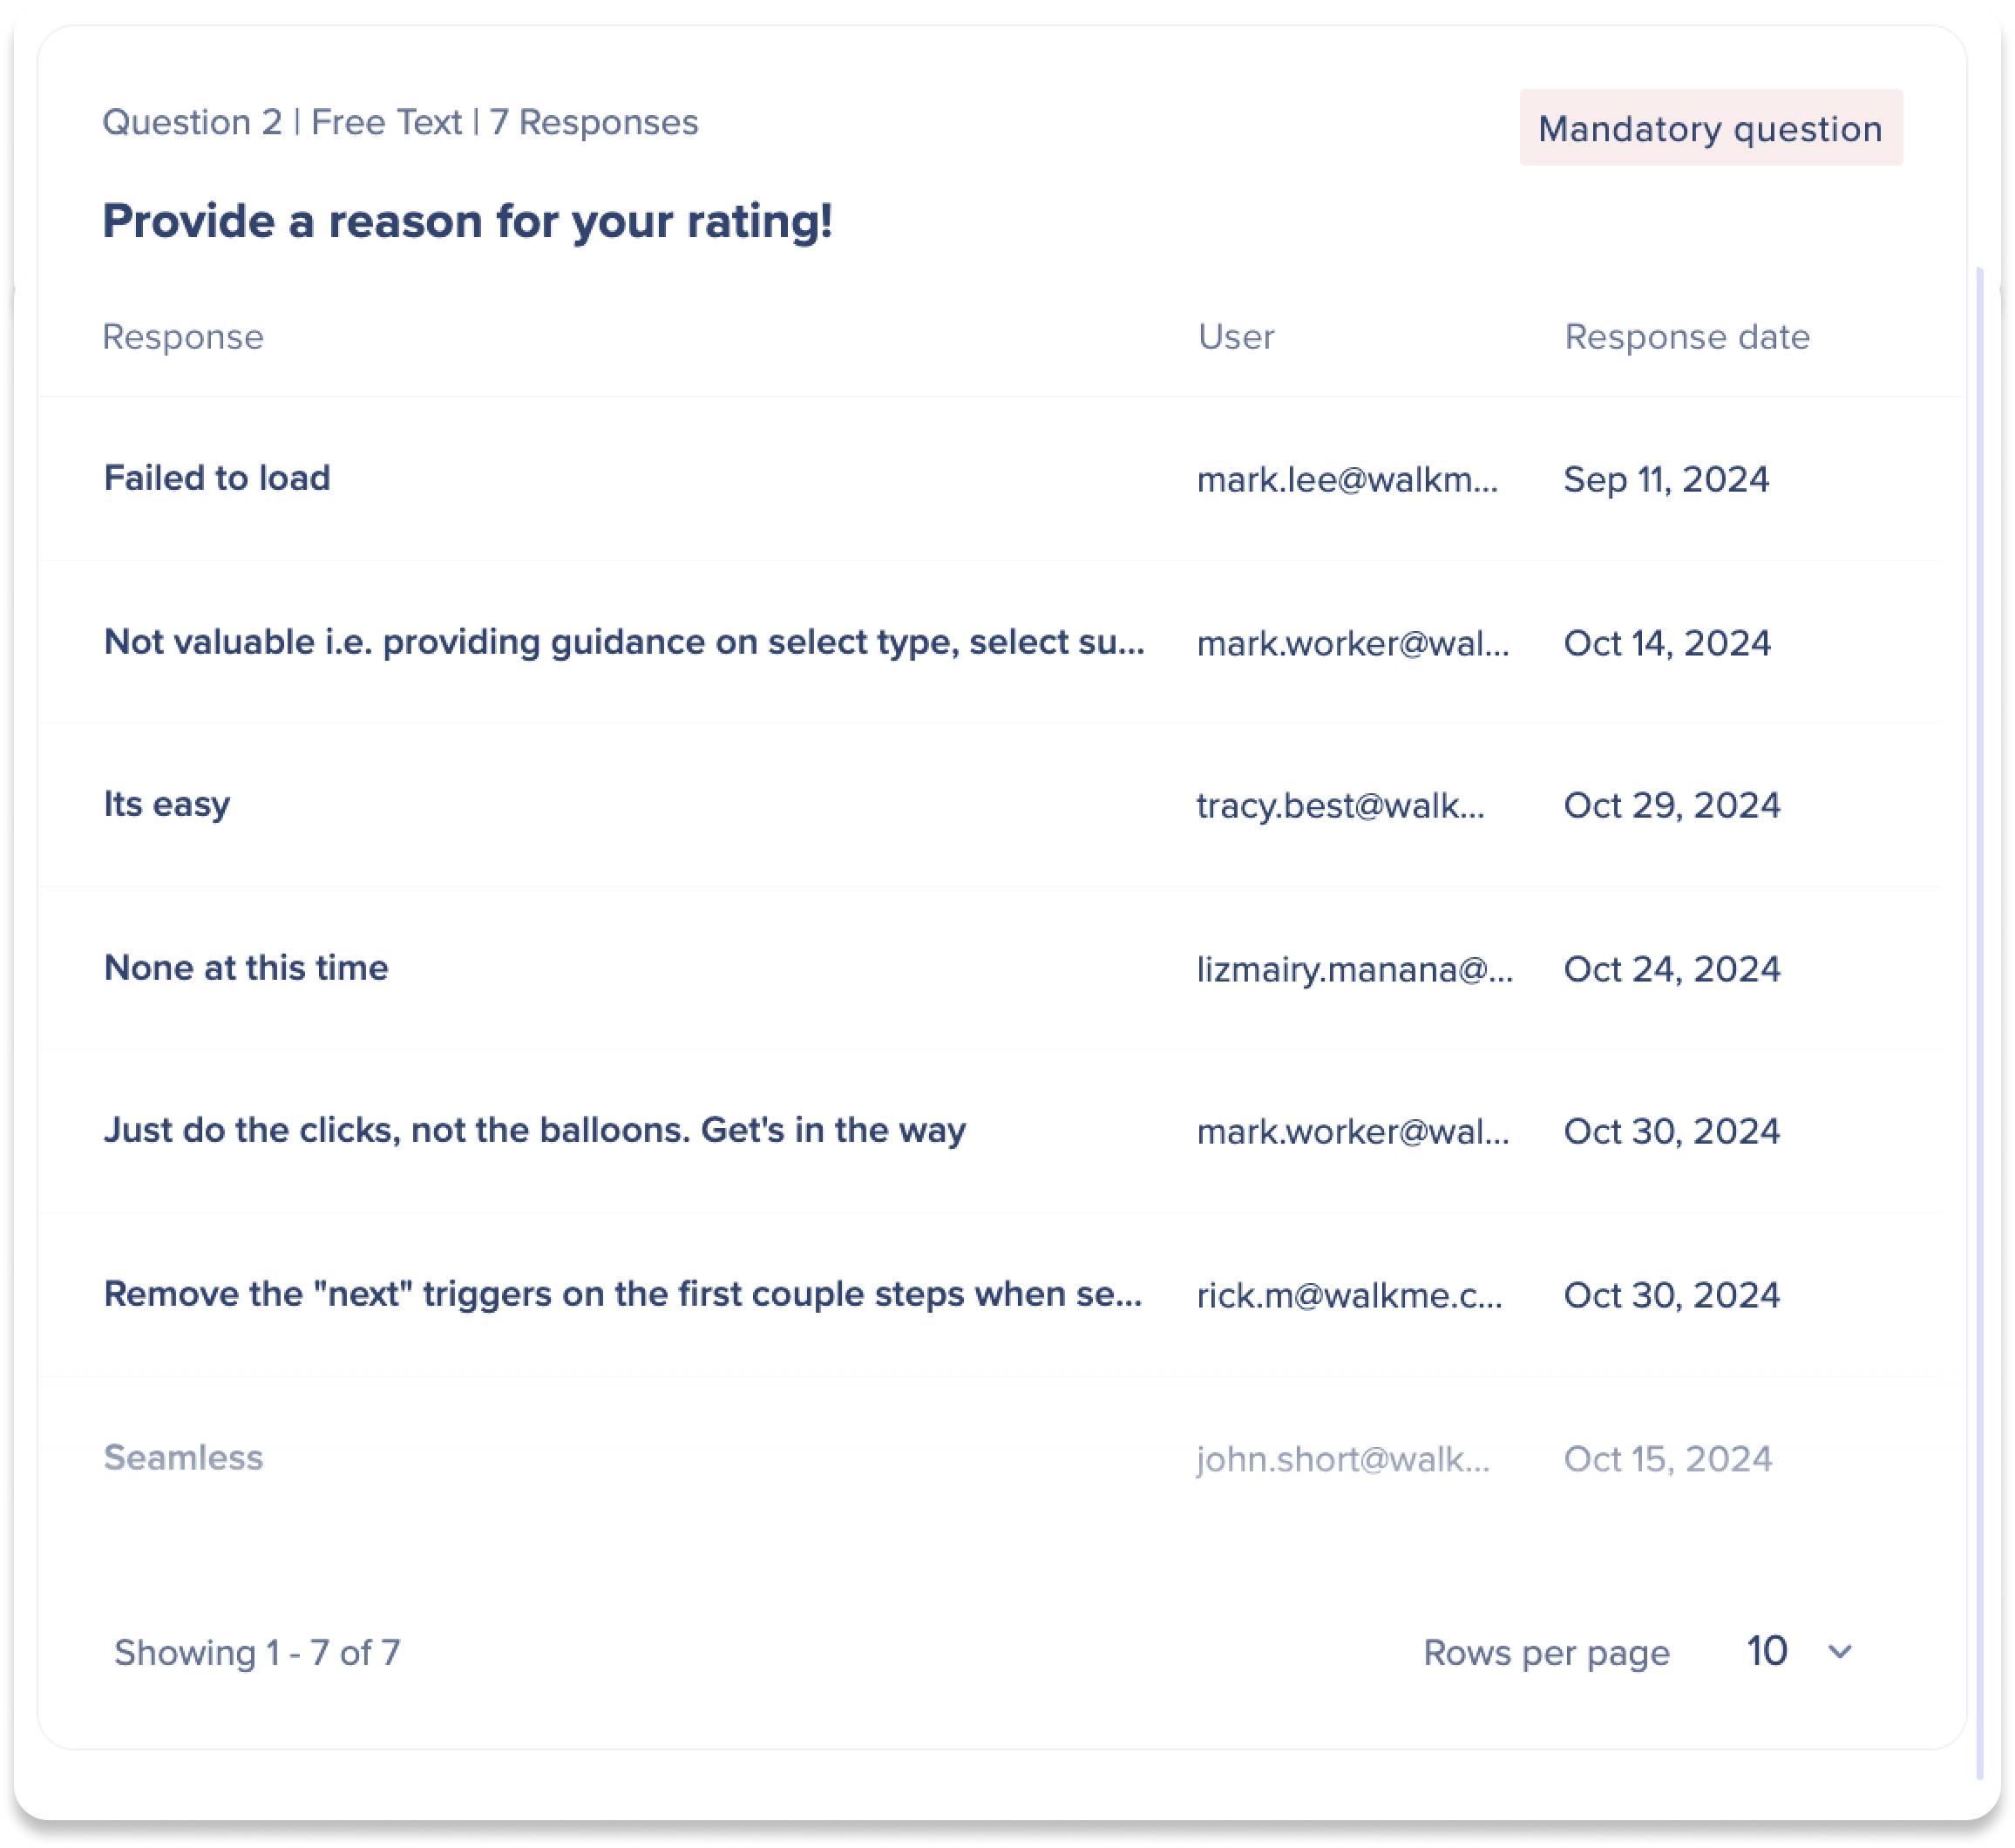
- The free text question type allows users to provide written responses to open-ended questions by typing their answers
- The widget displays a list of all of the responses for the question
- Each response includes the user and response date
Note
In the analysis for each question, you will find the number of responses received. If the question is optional (not mandatory), the number of responses may be different from the total number of submissions.
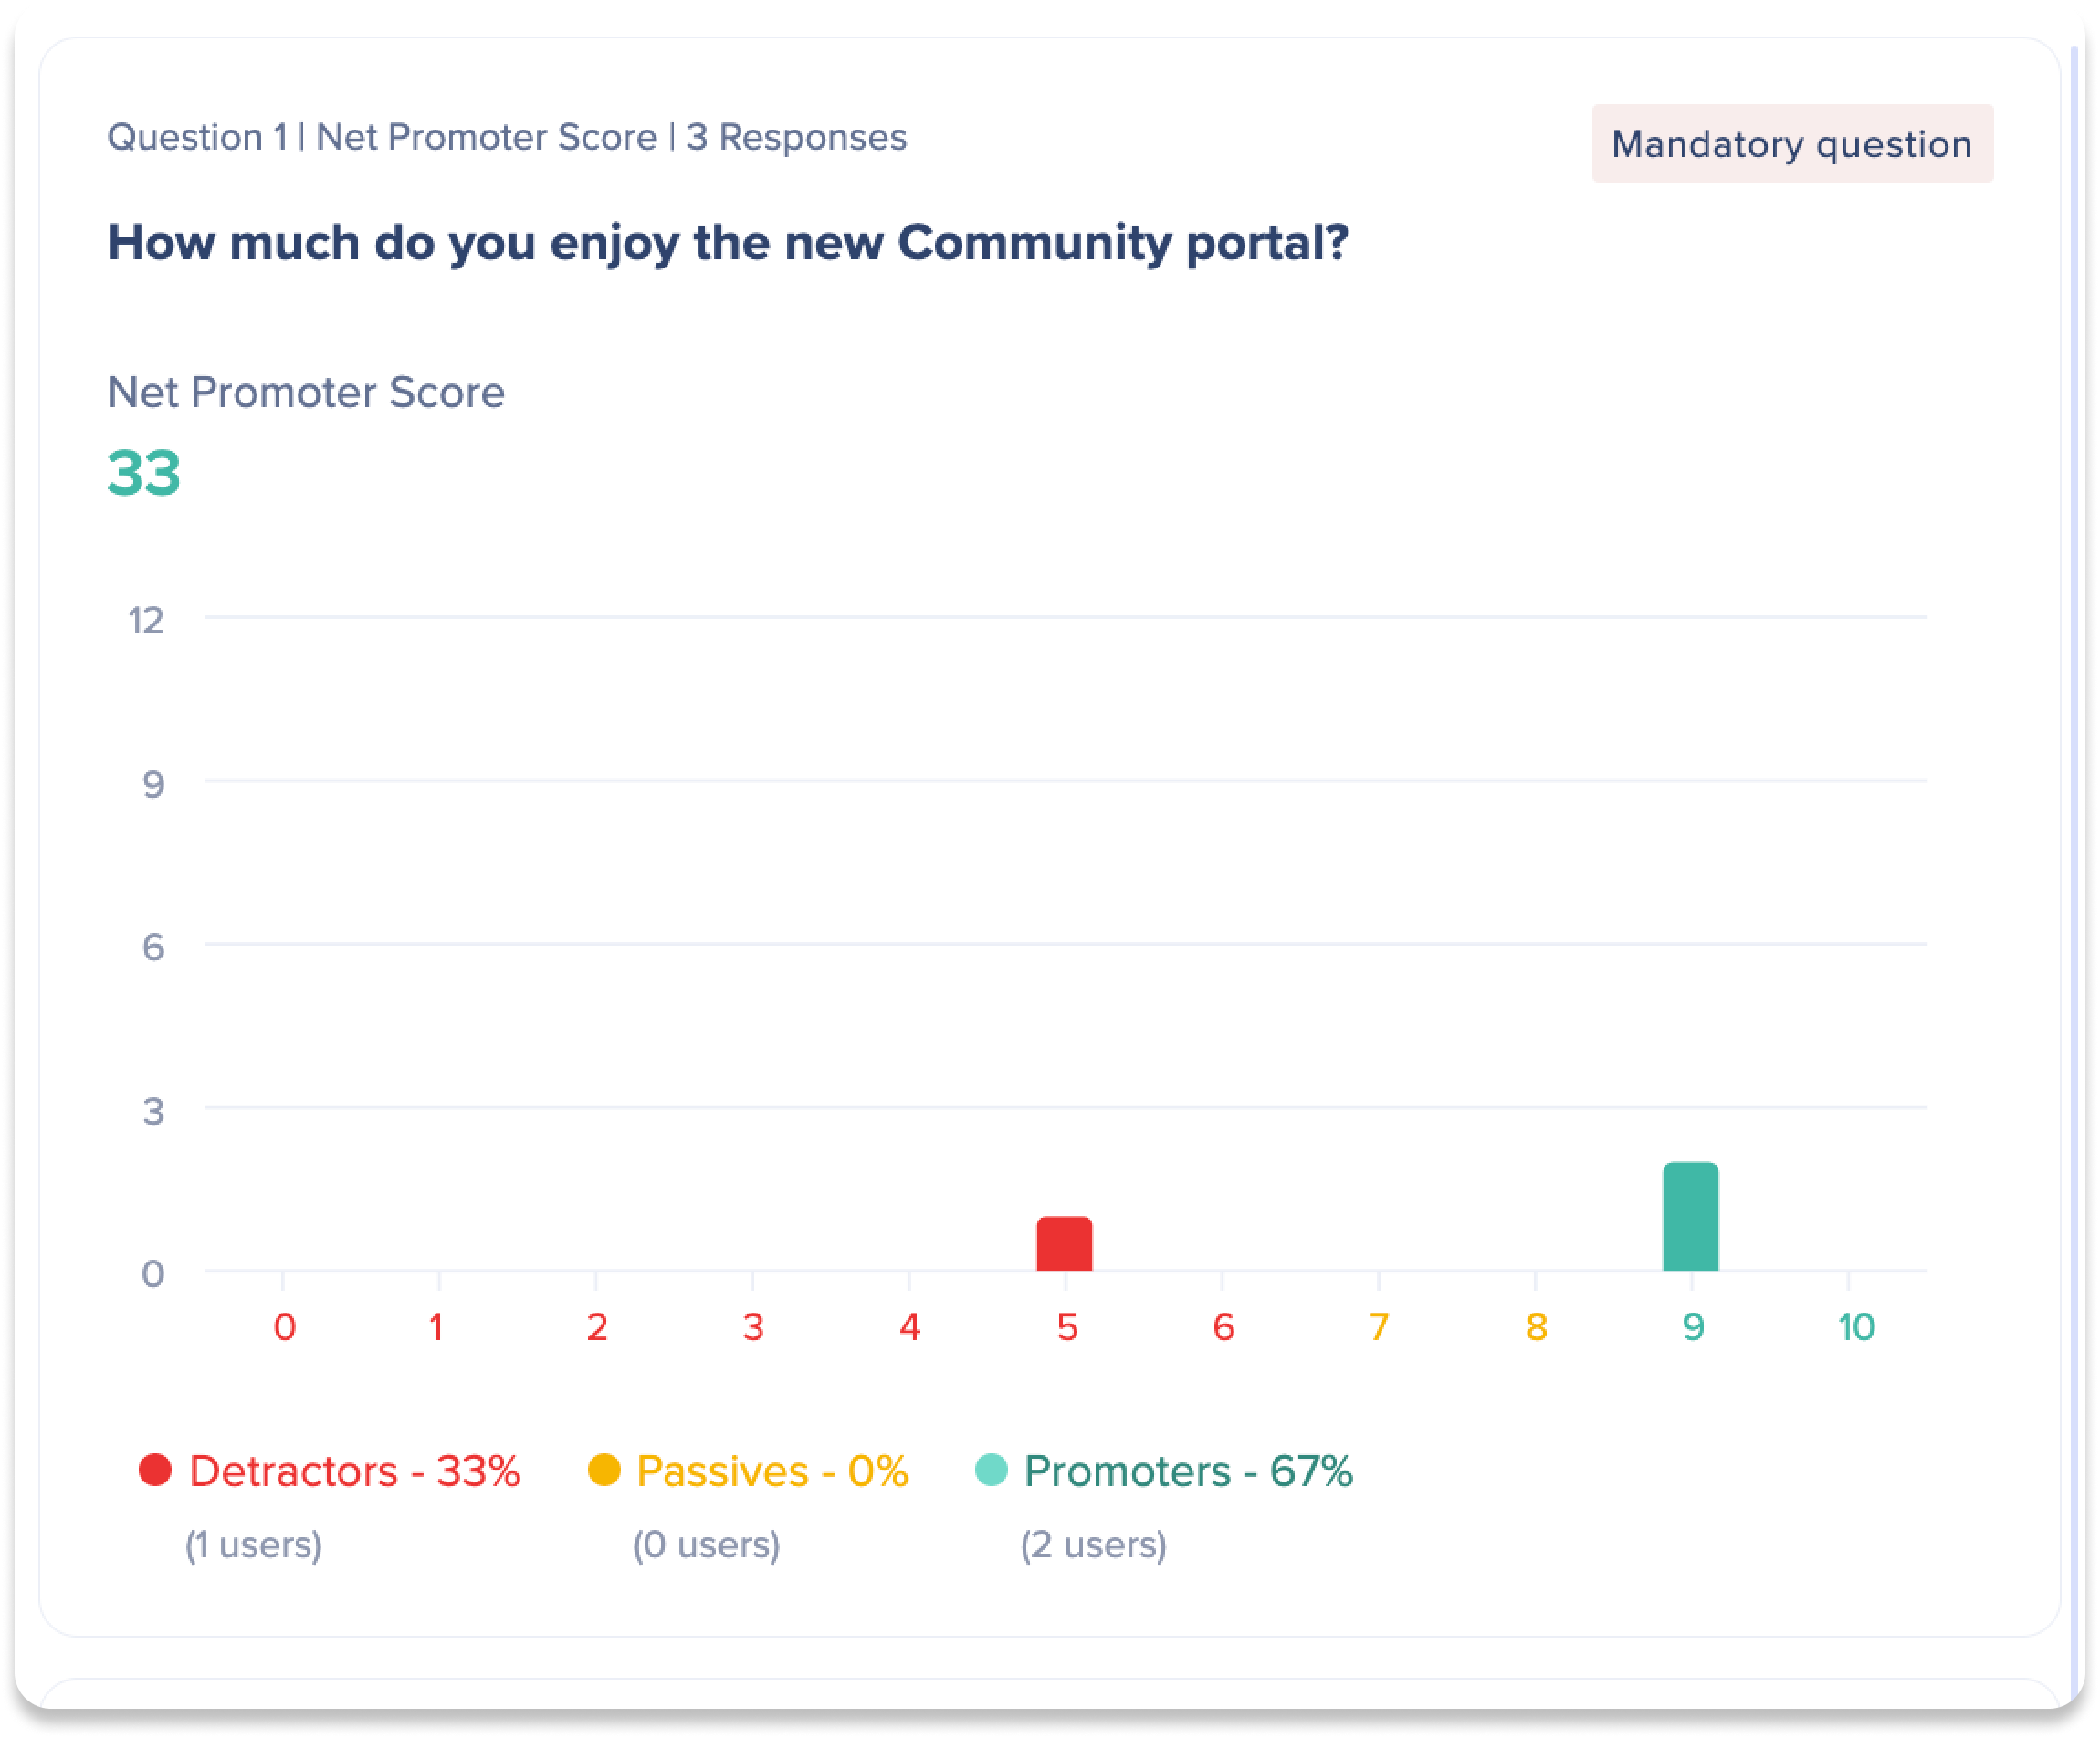
- The net promoter score question type is represented by a bar graph that includes the overall NPS score, as well as the percentage of users who selected each possible NPS score
- The scores are divided into different NPS categories:
- Detractors: Potentially harmful to your reputation
- Passives: Unlikely to be harmful or helpful
- Promoters: Likely to be helpful to your reputation
AI Deep Dives
Users with access to the AI Dashboards can also explore deep dive analyses of the following products: AI Answers, AI Action Bar, AI Rules, and AI SmartTips.
Learn more about the AI Dashboards and individual deep dives here:
AI Dashboards
Technical Notes


