Brief Overview
The Users page in Insights, accessible at insights.walkme.com, allows you to get to know your end users better. Understanding how your users are using the application enables you to drive meaningful behavior change.
The Users page provides detailed end user-level data of the people using your application or site:
- Their behavioral attributes such as their most recent session and average session time
- Custom end user attributes coming from your end-user incoming integrations
in its full format only to accounts with Unique User Identifier setting.
Users Page Overview

- All Sessions filters & Date Selection dropdown
- All Sessions filters
- The dropdown contains any previously saved filters.
- All the user metrics displayed are reflective of the chosen filters.
- For example, when using a “Tracked Events” filter, you will receive a list of users in which the chosen Tracked Event occurred at least in one session during the selected date range.
- Date Selection dropdown
- Use the dropdown to view only users that were active in the chosen date range.
- Add to Favorites View icon
- Click on the star icon to save the view to your favorites
- Unique Users in Filter
- Shows the total number of users who were active in the selected time range and the filter applied is true for.
- “All users” refer to all the users that were active since WalkMe was deployed.
-
- Use the search bar to search for values from all available columns
- Action buttons
- Manage columns
- Export
- Users & Accounts columns
- User
- Displays the user based on the End User Identifier method selected in the System settings.
- Next to each user is an icon indicating whether they were identified on Desktop Web or Mobile Web platform.
- Note: This means that it is possible for each user to be identified twice, once on each platform.
- Account
- If , the account name will be listed
- First seen
- This is the first time the user was visible to WalkMe
- Last seen
- This is the last time the user was active on the application
- Note: If a user was inactive for more than 6 months they will not appear in the users' list.
- Average time between sessions
- The average time between a user's sessions, calculated as the average time between the end of a user's last session and the start of the subsequent session
- Average session duration
- Average duration of all the user's sessions
- Total sessions
- The total count of a user's sessions
- Page navigation
- Navigate to the next page of users
- Rows per page
- Select how many rows you want to display
Decide which value to group columns by.
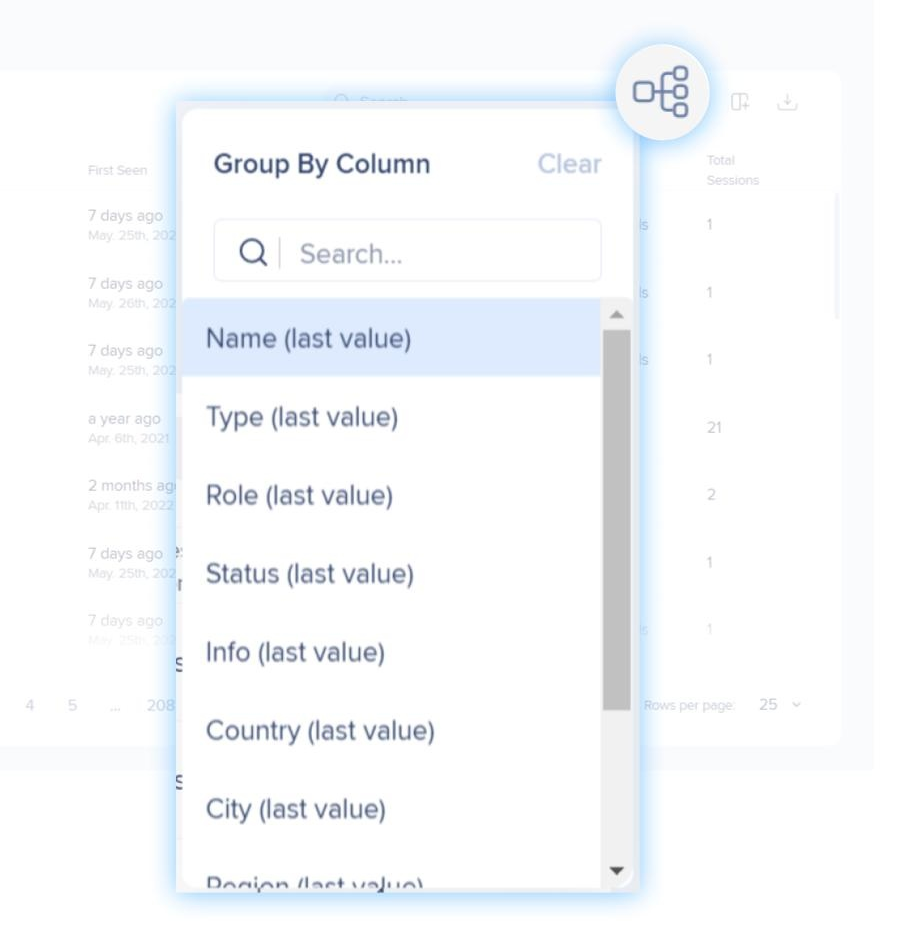
In this example, columns are grouped by Country. You can then expand on each value to see more data.

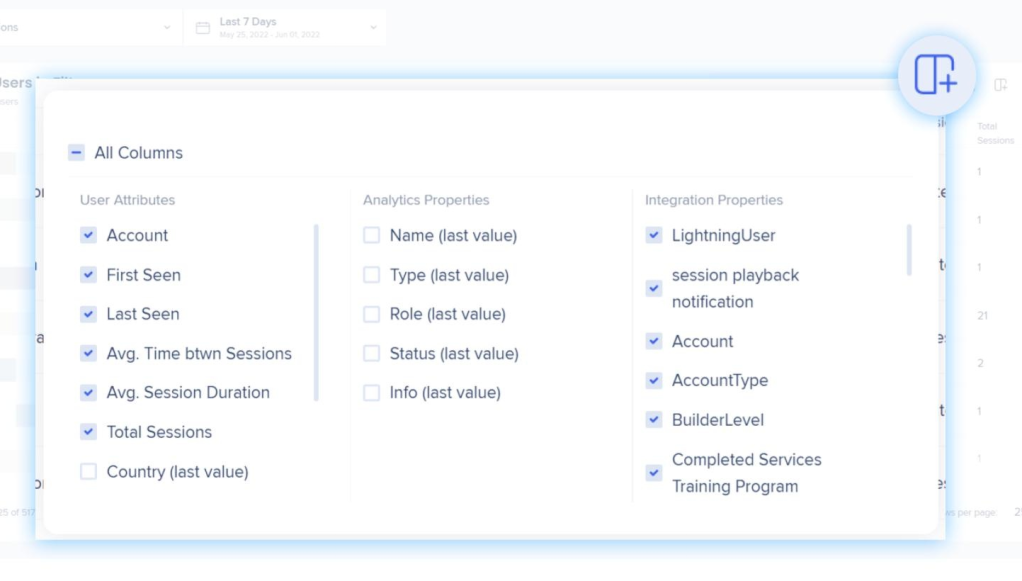
Select what you want to display as columns:
User Attributes
- Country, city, region, browser name, and browser version are not displayed by default, but can be added as additional columns.
Analytics Properties
- Name, Type, Role, Status, and Info are not displayed by default, but can be added as additional columns.
- Shows the most recently seen of the collected analytics properties.
Integration Properties
- The most recently seen value received for all the integrated custom properties of the user.
Export
- Export the users list to a CSV or XLSX file.

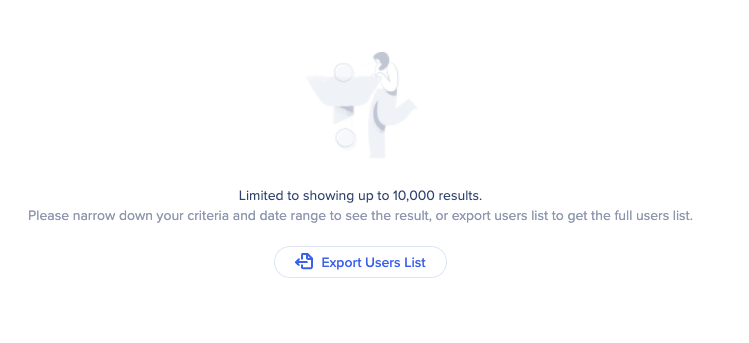
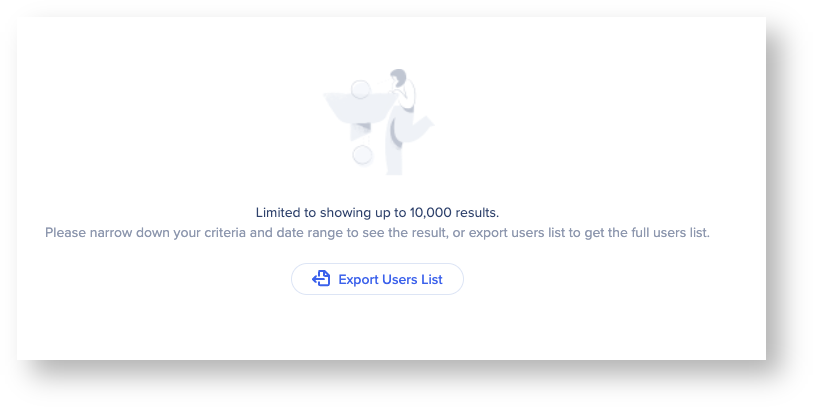
Please note: When the user count is under 30,000 results the users can be viewed instantly on the Users page. Otherwise a message will appear prompting to change the date range and any applied filters to be able view users on the page, or to use the Export Users List button to download the entire list.
Filters
- You can hover next to each column name to display a filter icon that allows you to filter the column.
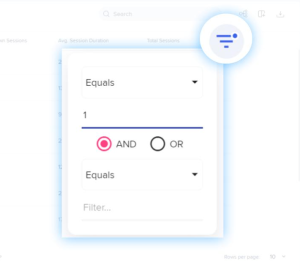
- The Total Sessions column has been filtered to show users who have only had 1 session.
- You can click Clear Filters to go back to the original view.

- User and Account columns can also be sorted alphabetically A-Z or Z-A.

Limitations