Analyzing Funnel Reports in Insights Classic
Last Updated October 7, 2024
Brief Overview
This article explains how to analyze the funnel dashboard data that appears on your Insights Classic Funnels page.
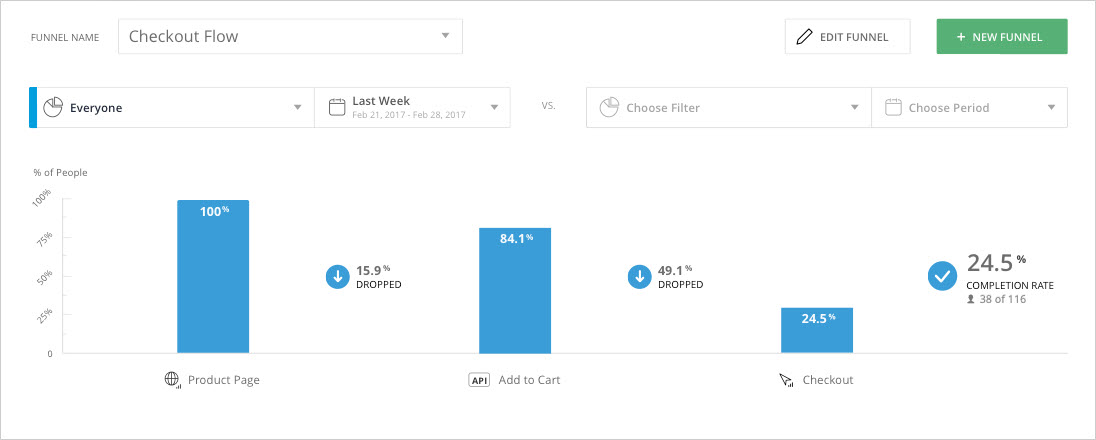
Analyzing the Funnels Dashboard
Analyzing a Single Funnel Filter
- Sign into your Insights account at insights.walkme.com
- Open the Funnels page
- Select a funnel from the drop-down menu
- Choose which saved filters and date-range you want to use to examine the funnel
- The default filters are All Sessions in Last 7 Days
- The results will be shown on a bar graph where the x-axis represents the steps of the funnel and their respective drop-off rates, and the y-axis the percentage of users in each step
- Use the Export button to further examine your funnel
- The export will provide a detailed list of all end users and sessions in which the funnel process was attempted
- For each end-user and session, you will see the last step of the funnel that was reached and the funnel duration time, meaning the time it took for the end-user to reach that step in that session
Steps For Comparing Funnel Filters
- Open the Funnels page in Insights
- Select a funnel from the drop-down menu
- Choose a funnel filter on the left side of the vs. and a funnel filter on the right side to compare
- The results will be shown on the dashboard
Was this article helpful?
Yes
No
Thanks for your feedback!