Brief Overview
UI Intelligence (UII) analyzes how users are interacting with your forms. It provides charts and information using the UII collected data. For an introduction into UII and its use cases, check out the UI Intelligence overview article.
This article provides guidance into our UII product and how you can use it.
How It Works
UII is made up of a Overview dashboard and form pages, which offers a high-level view of all of your forms' usage and user interaction and Form pages, where you can further dive into a specific form's performance.
The UII Overview page shows an overall summary of how users are interacting with your forms. The page provides charts and information using the UII collected data. Refer to the Recommendations section to find actionable tasks that will help improve your forms submission rates.
The Form page gives you low-level details on each individual form's performance. Use the heat map to visualize user interaction and analyze completion rates and errors in the form's insights panel.
All the analytics presented will help you understand where your users are experiencing issues.
Supported forms
While UI Intelligence supports most form types, there may be some exceptions. If you're form hasn't been analyzed, it's either because our AI hasn't discovered it yet or because it's not a supported type.
How to Access
After logging into the Console, accessible at console.walkme.com/uii/forms, select UI Intelligence from the NavBar. If you have more than one platform or environment under your WalkMe account, make sure to select the one you wish to examine from the top-right dropdown.
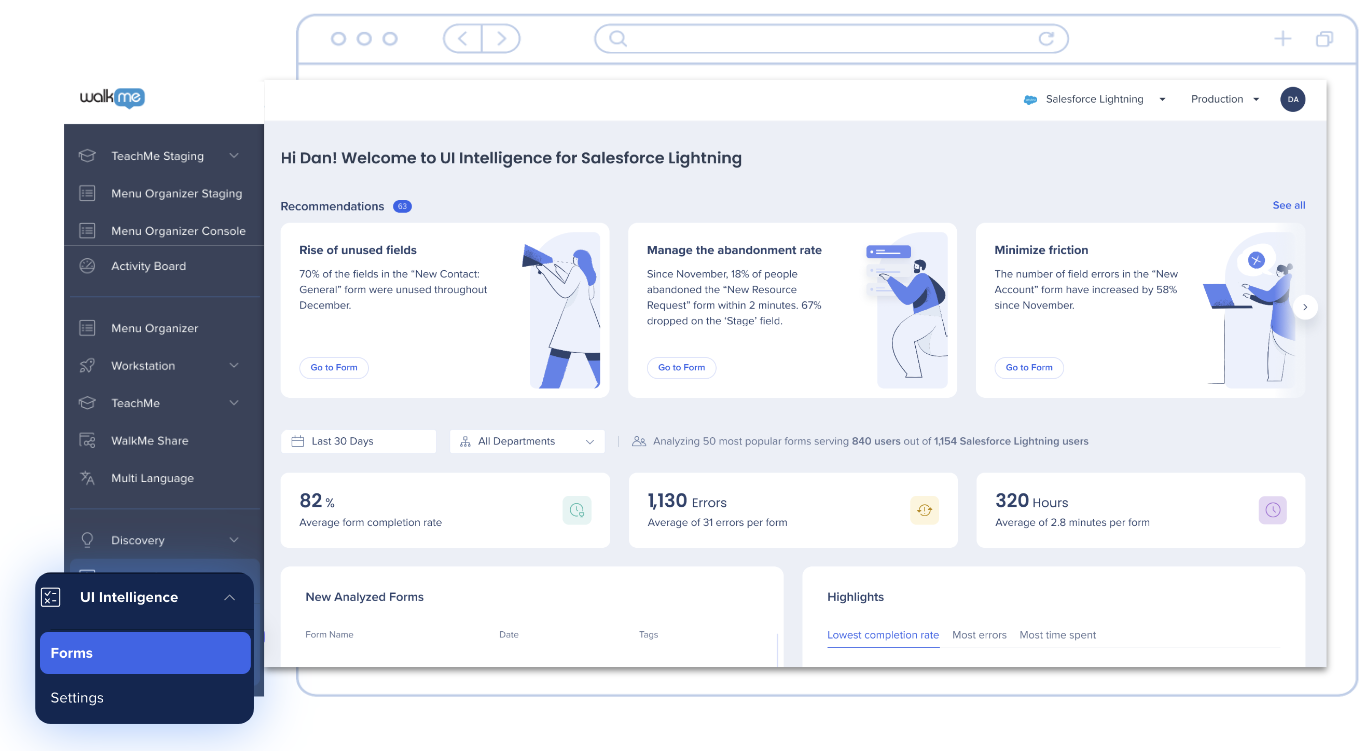
The Overview Dashboard
The Overview Dashboard is your main tool for user behavior analysis, providing great visibility into the day-to-day experience of your users.
You can filter data by time range and department set for a specific form or the entire dashboard view. This allows you to compare results before and after implementing WalkMe solutions so you can see improvements and the effects on users' behavior during different periods. We recommend to segment forms by department via IDP to drill into improvement opportunities for specific groups of users. Read more about IDP Integration and how to set it up.
There are 3 main components that make up the dashboard:
- Recommendations and high-level metrics: High-level insights that give you a sense of the volume of user activity and recommendations to improve usability
- Highlights and trends: Quick opportunities worth investigating and trends in form usage
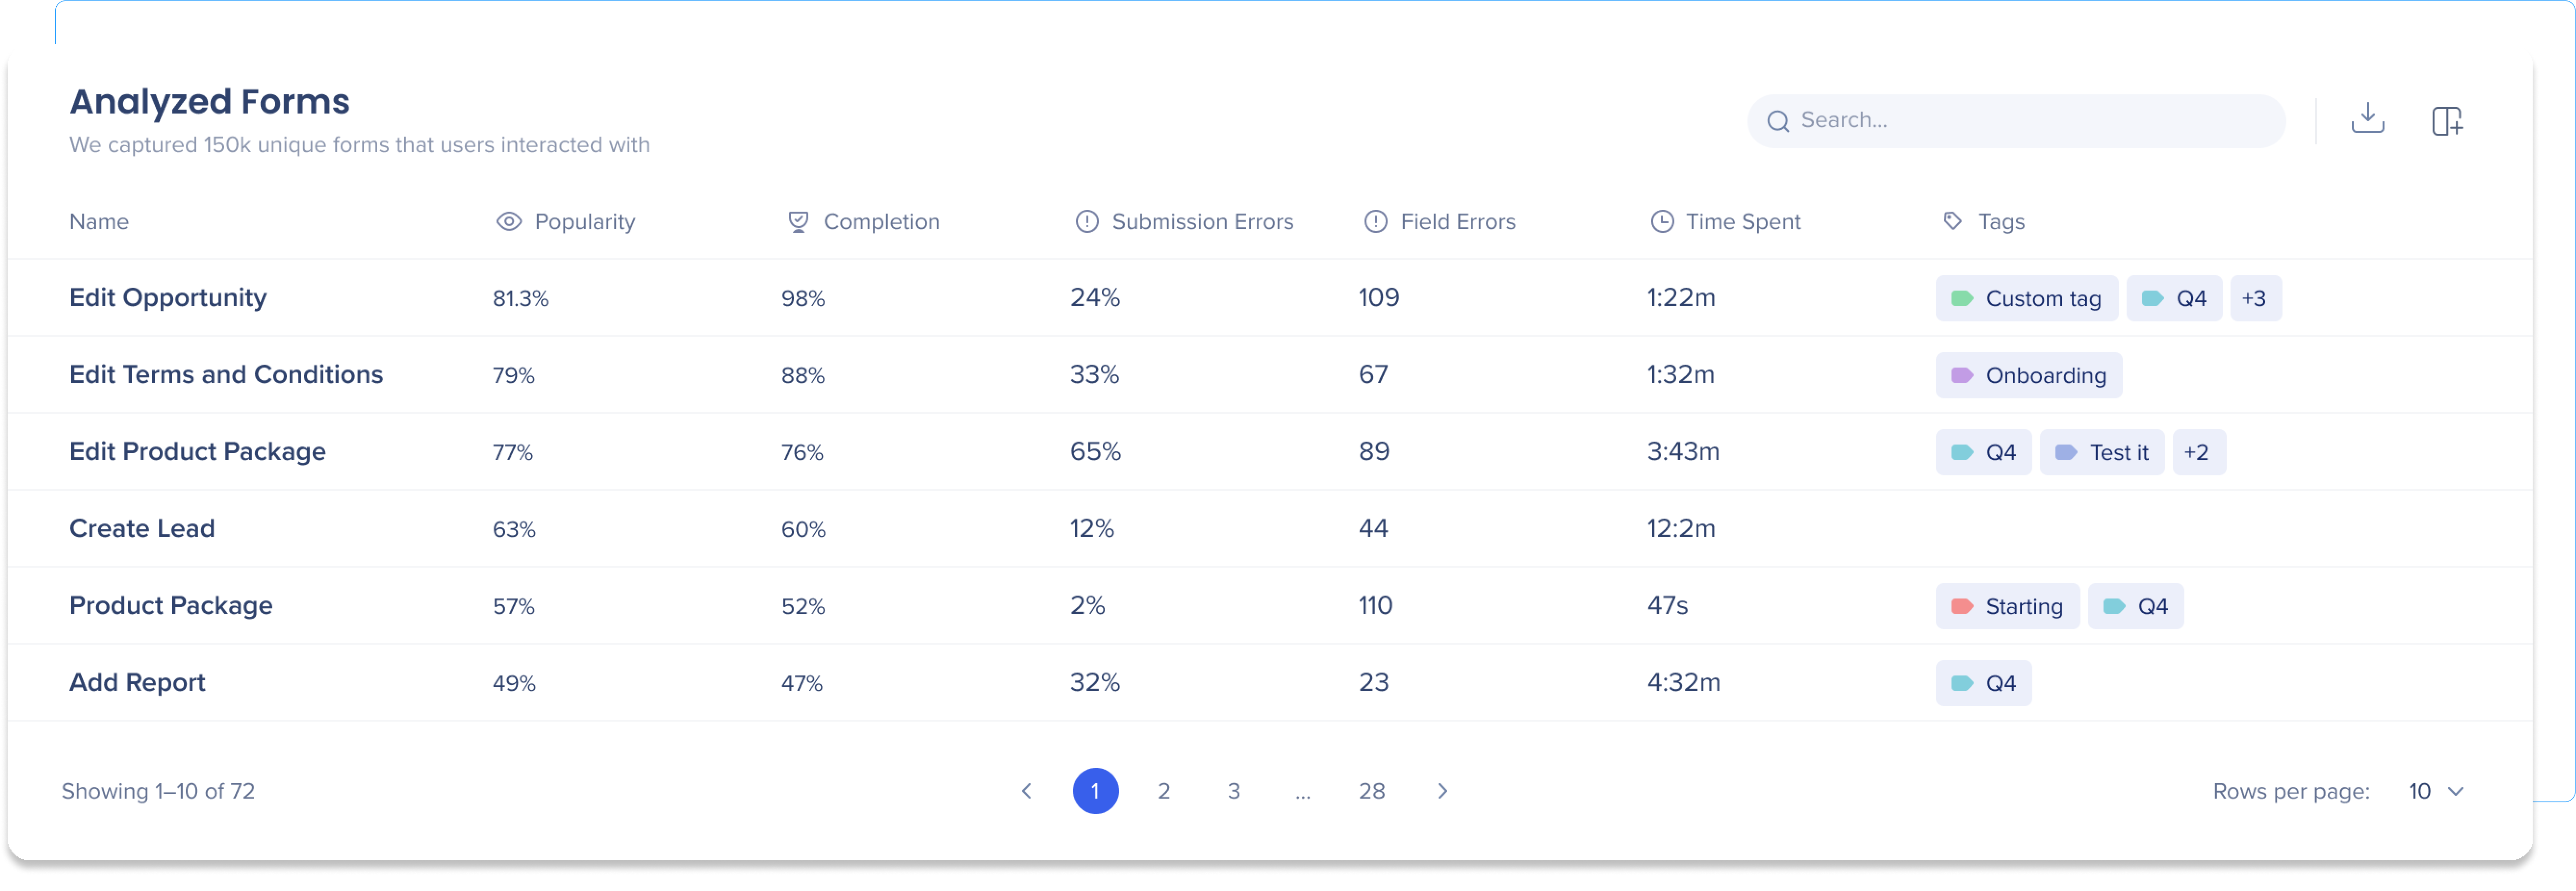
- All forms: List of all forms with key metrics for each
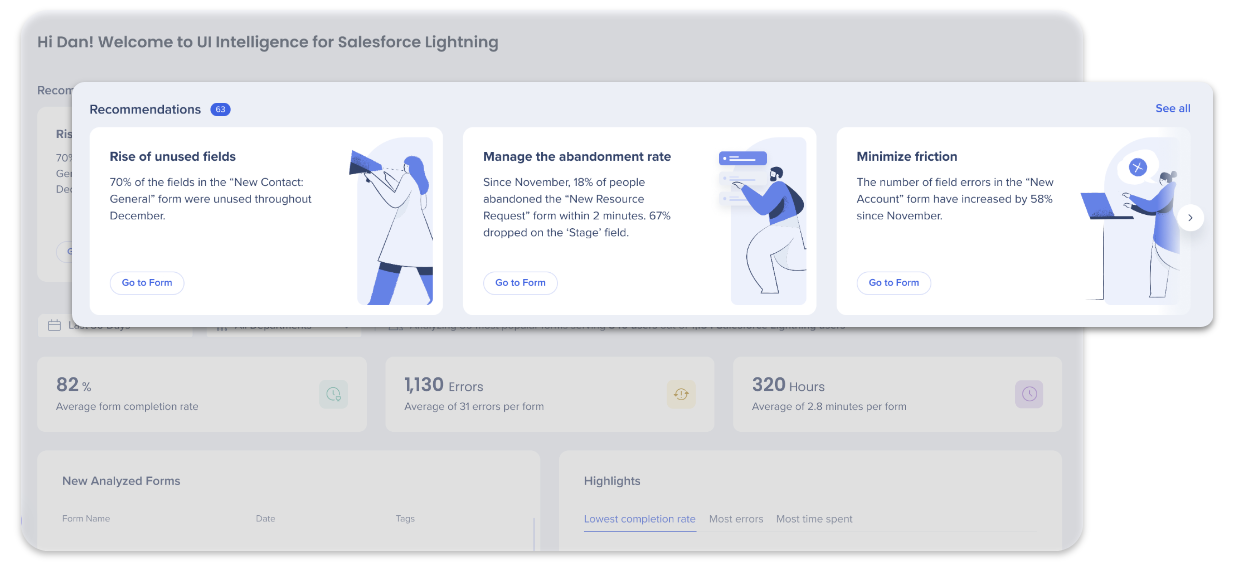
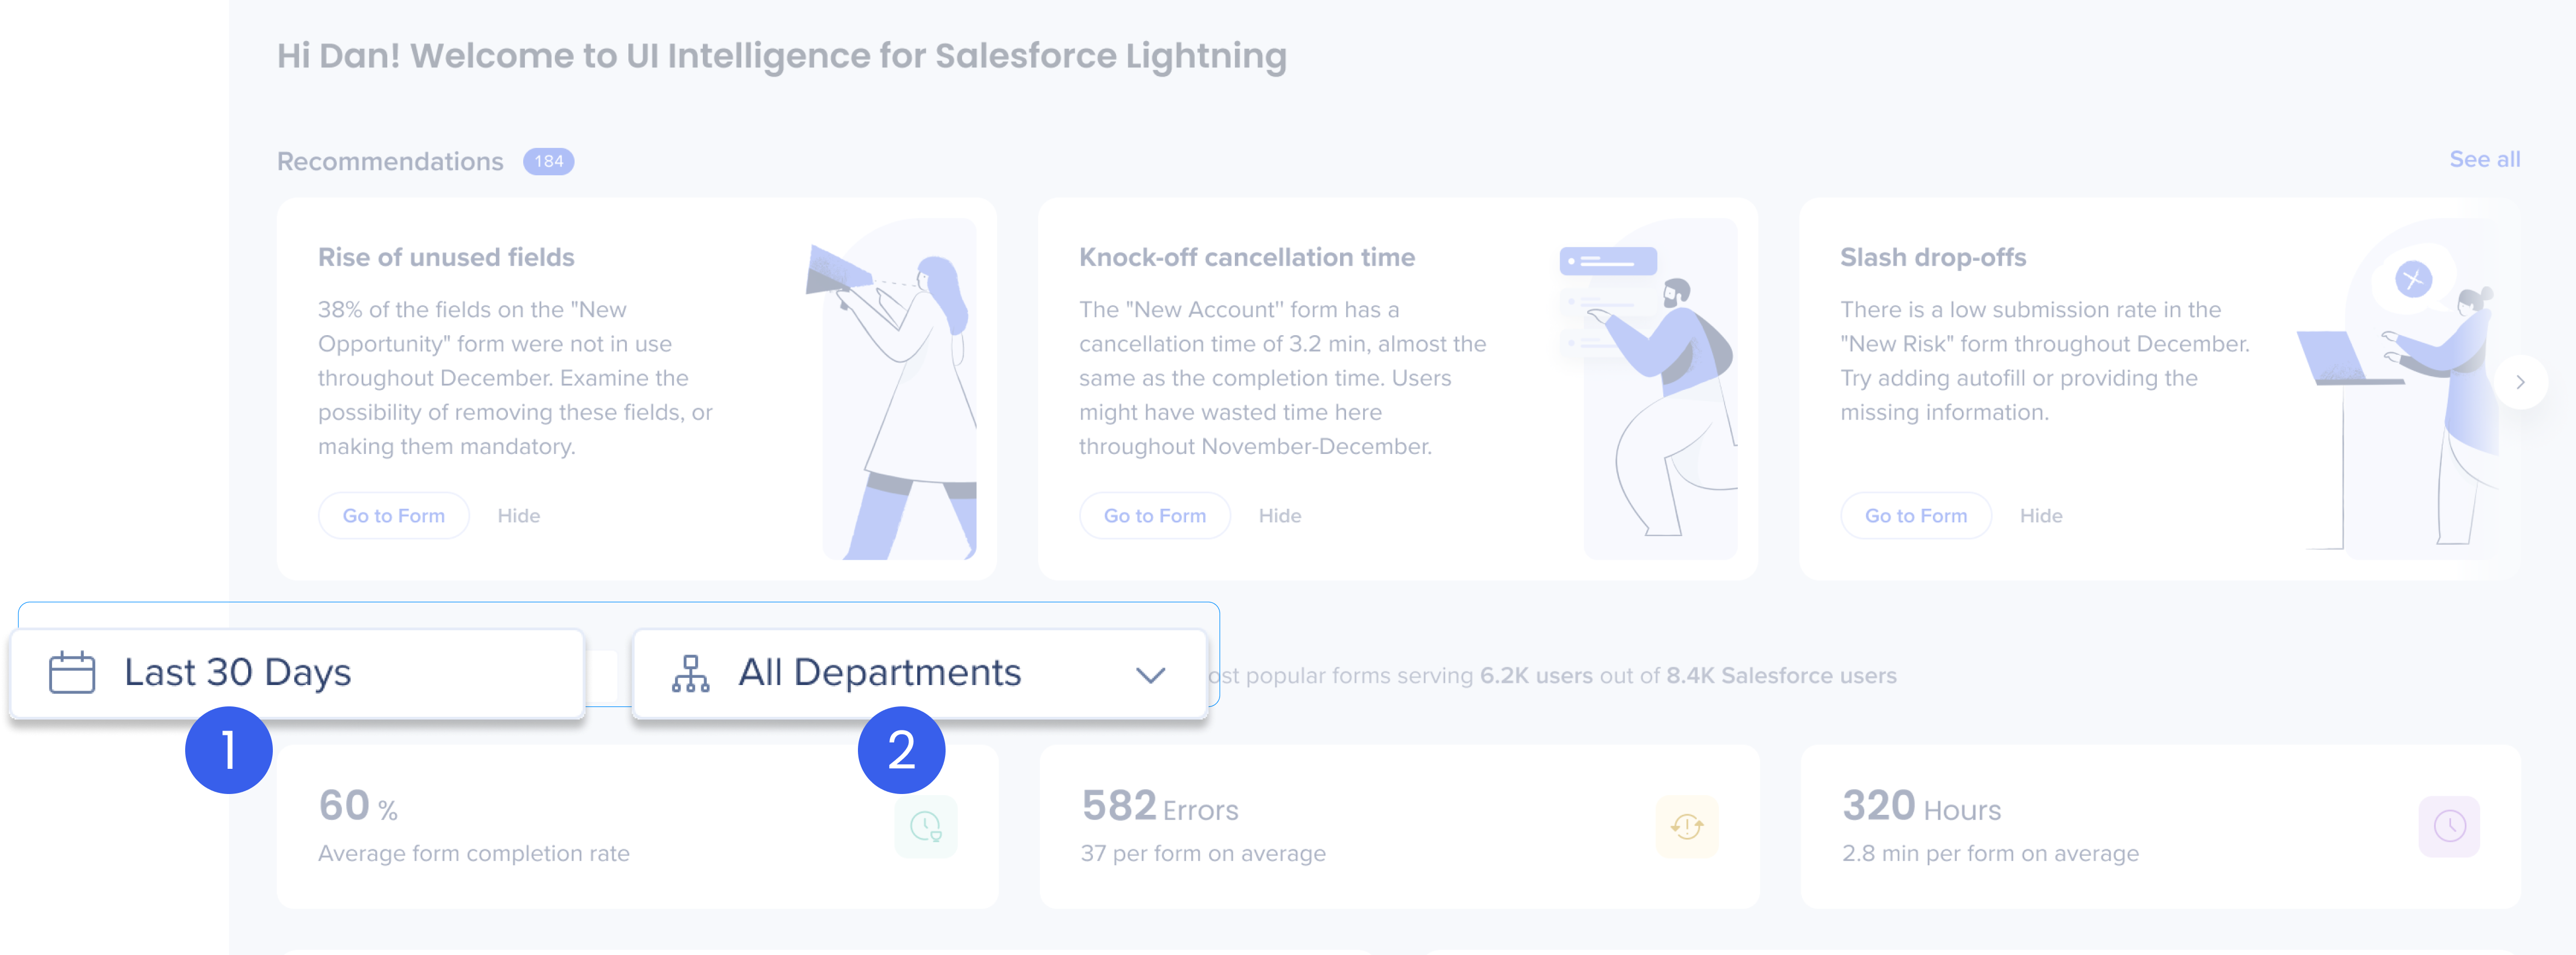
Recommendations
Recommendations take all the data that UII has analyzed on your forms and provides actionable tasks that will help improve your form's usability and submission rates.
- Click Go to Form on a recommendation to view all the recommendations related to one form.
- Click See all in the widget's top left corner to view all the recommendations of all of your forms.
The recommendations page displays all of the recommendations for every form. From here you can, mark recommendations as read, unread, or archived.
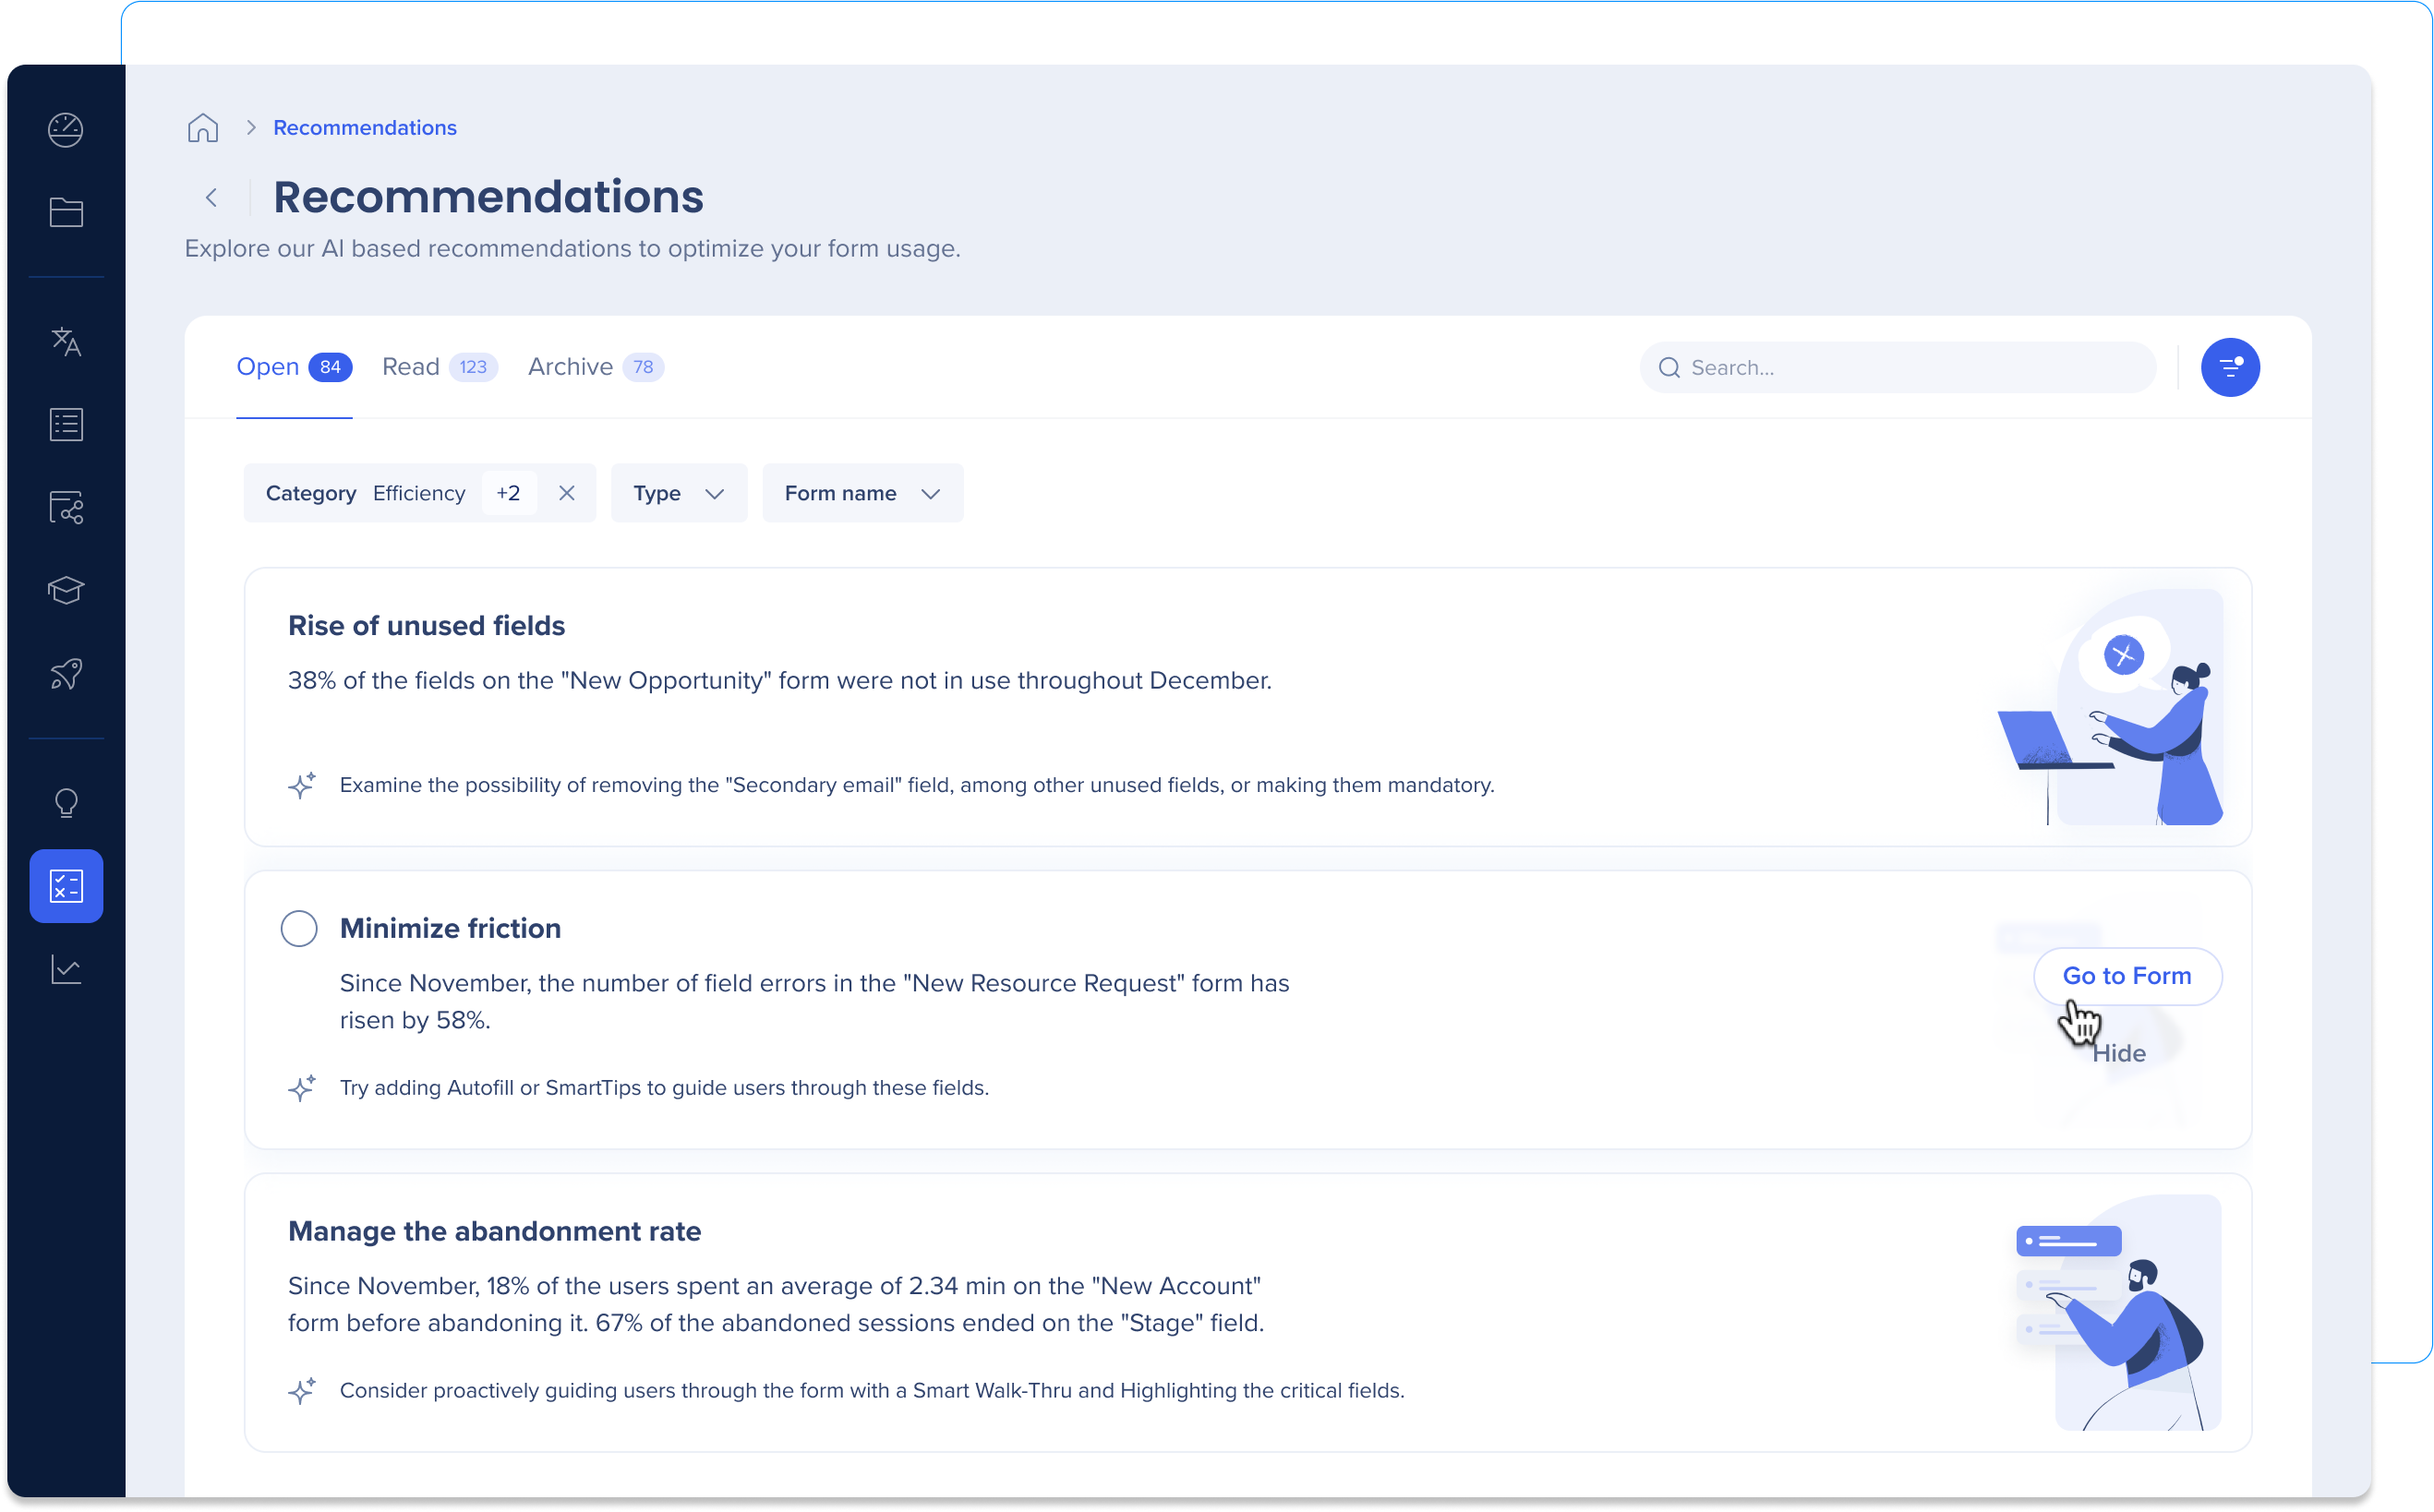
Recommendations auto-archive
Recommendations that are left as 'unread' for 30 days will be automatically archived. Similarly, all archived recommendations will be permanently deleted after 30 days. Recommendations that are marked as read won't be touched unless you manually move it to unread or archived.
Filters and Date Pickers
Pick a date range or refine the data showcased on the reports by department.
Click on the toggles to learn more about filters
1. Date picker
The data shown on all the reports on this page relates to the selected date range. Options include 7, 30, and 90 days, or you can create a custom range
2. Department Filter
Use the department dropdown to filter the data based on the department.
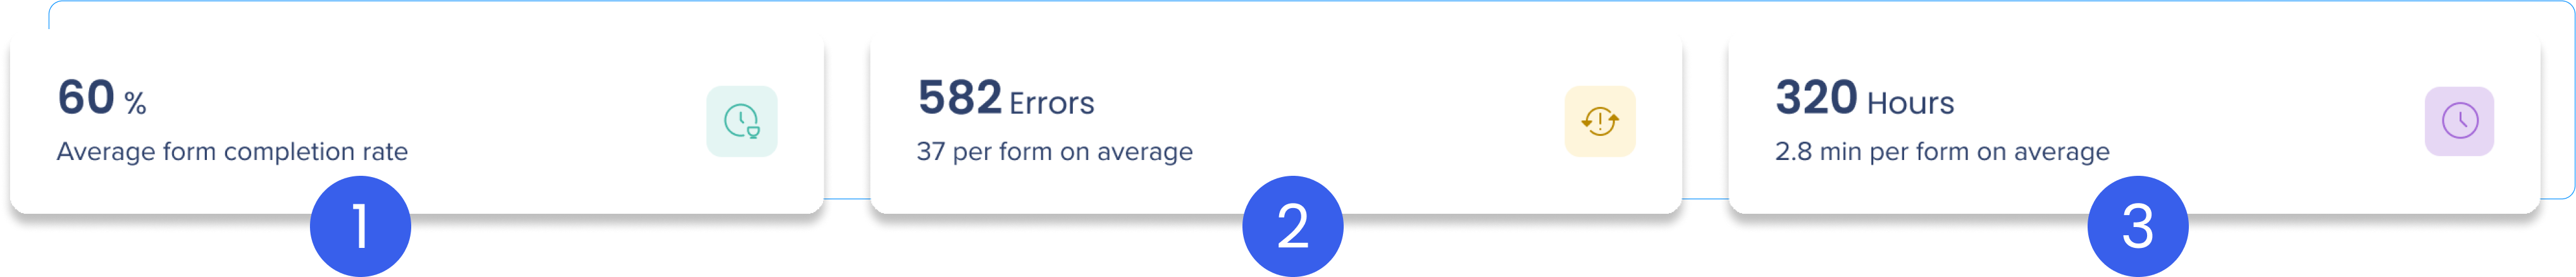
General Usage Metrics
Use these high-level metrics widgets to get a quick glance on the performance of your forms.
Click on the toggles to learn more about these widgets
1. Average form completion
Percentage of unique sessions that ended in form submission
2. Errors
Total number of errors encountered across all forms and the average number of errors encountered per form
3. Time spent
Total time it took users to submit forms. Including errors they encountered during the submission
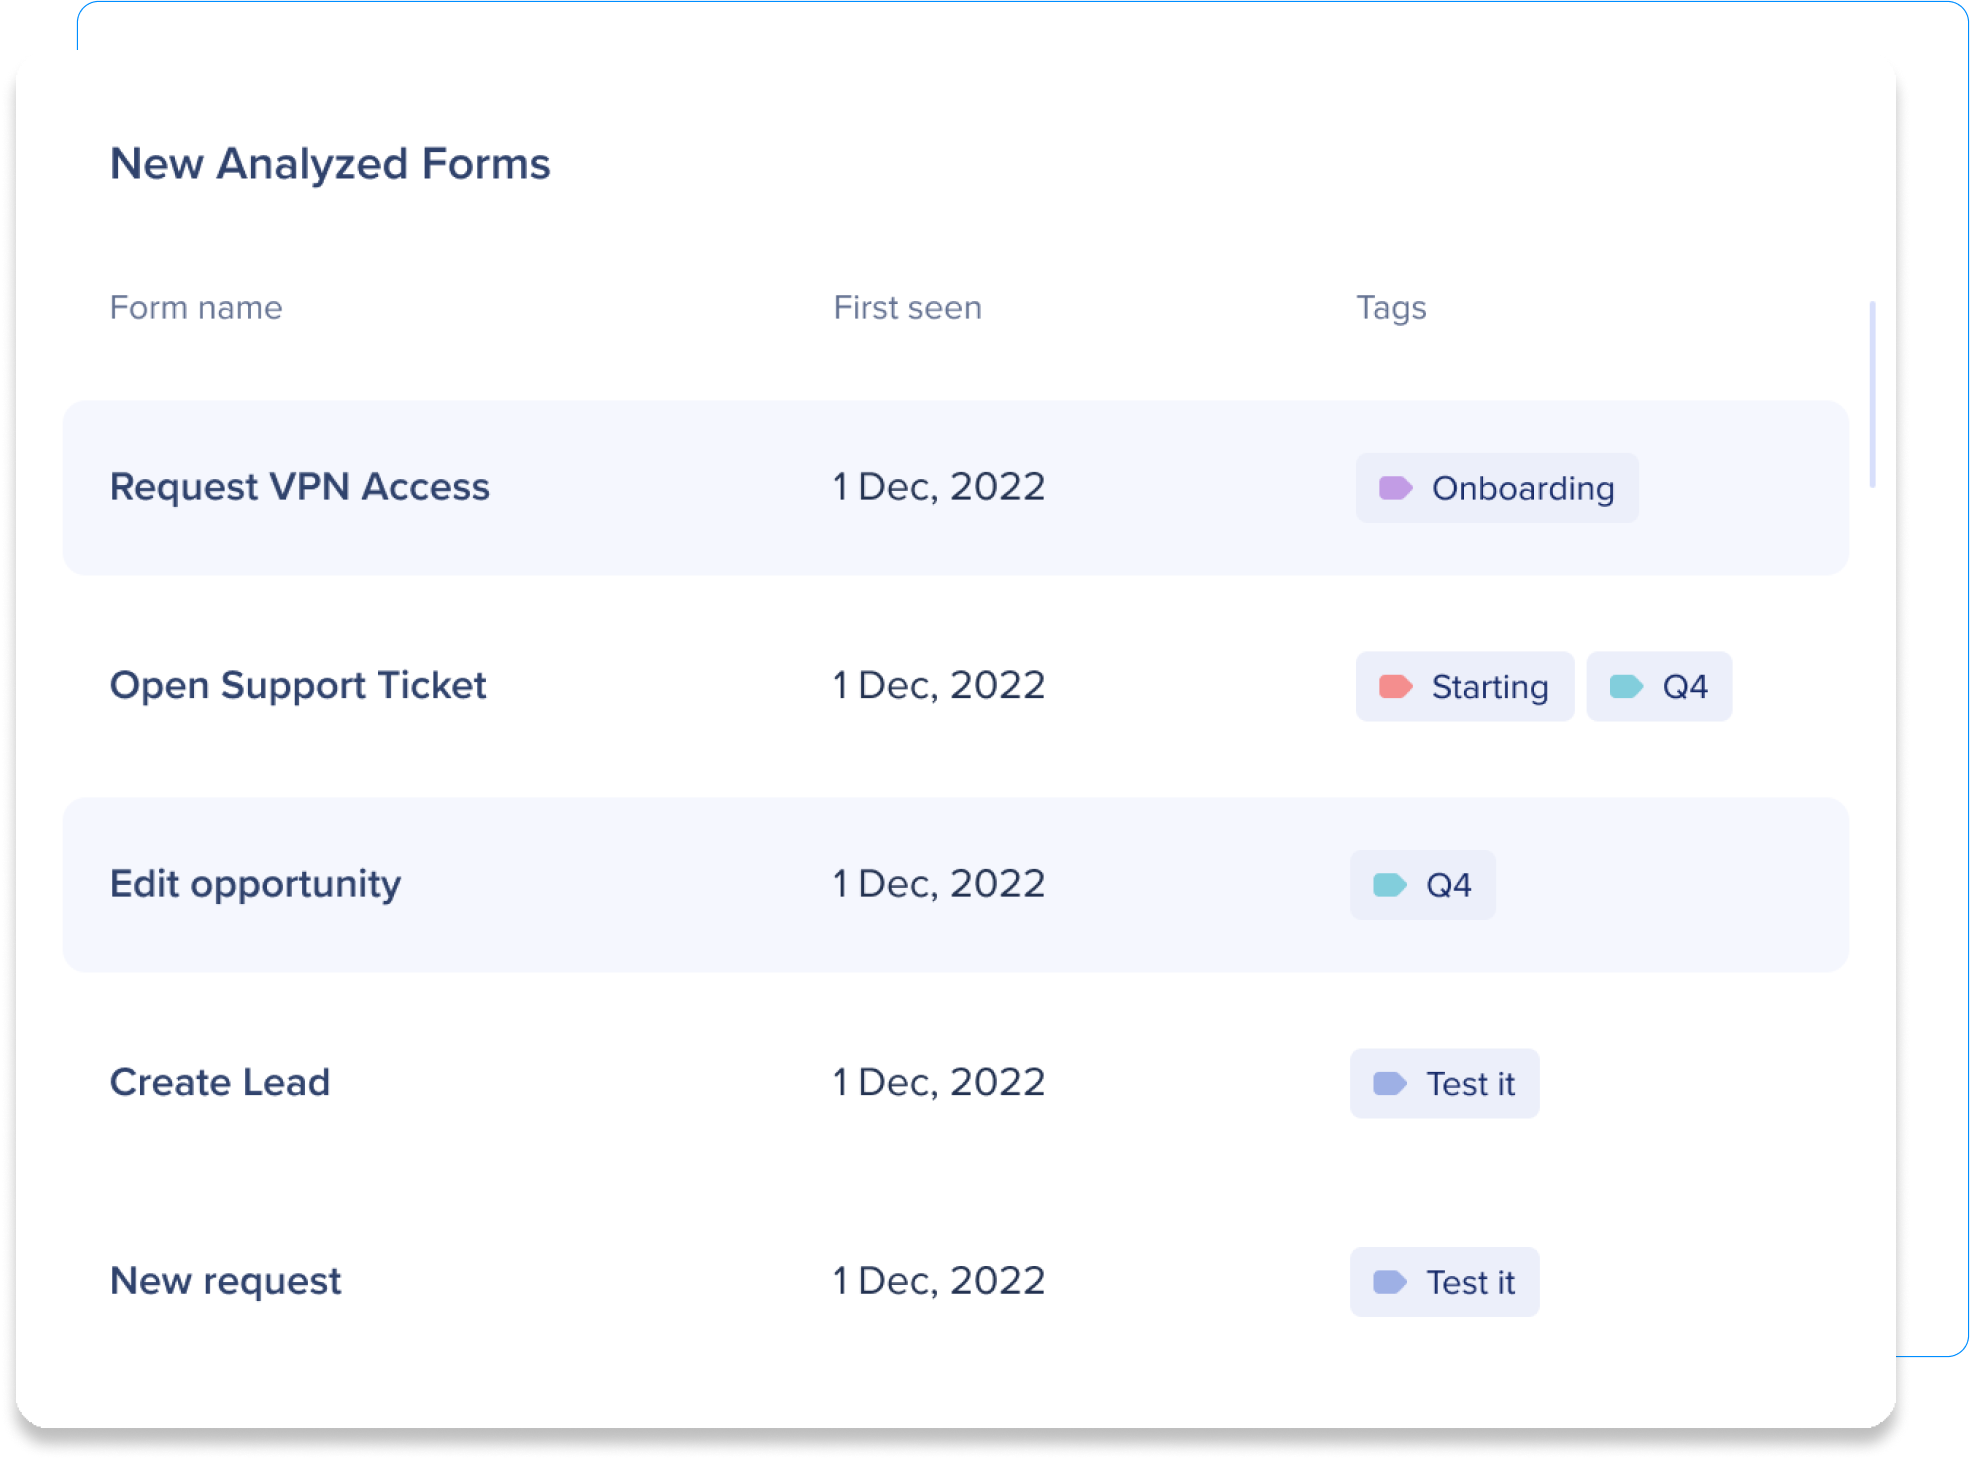
The Recently Analyzed Forms widget lists forms that have been recently captured and analyzed by our algorithm.
Click here to learn more about the columns...
Recently analyzed forms displays the following columns:
- Name: The form's name as determined by the algorithm
- First seen: This is the date that UII added the form
- Tags: Tags are auto-generate based on the IDP integration and other indicators
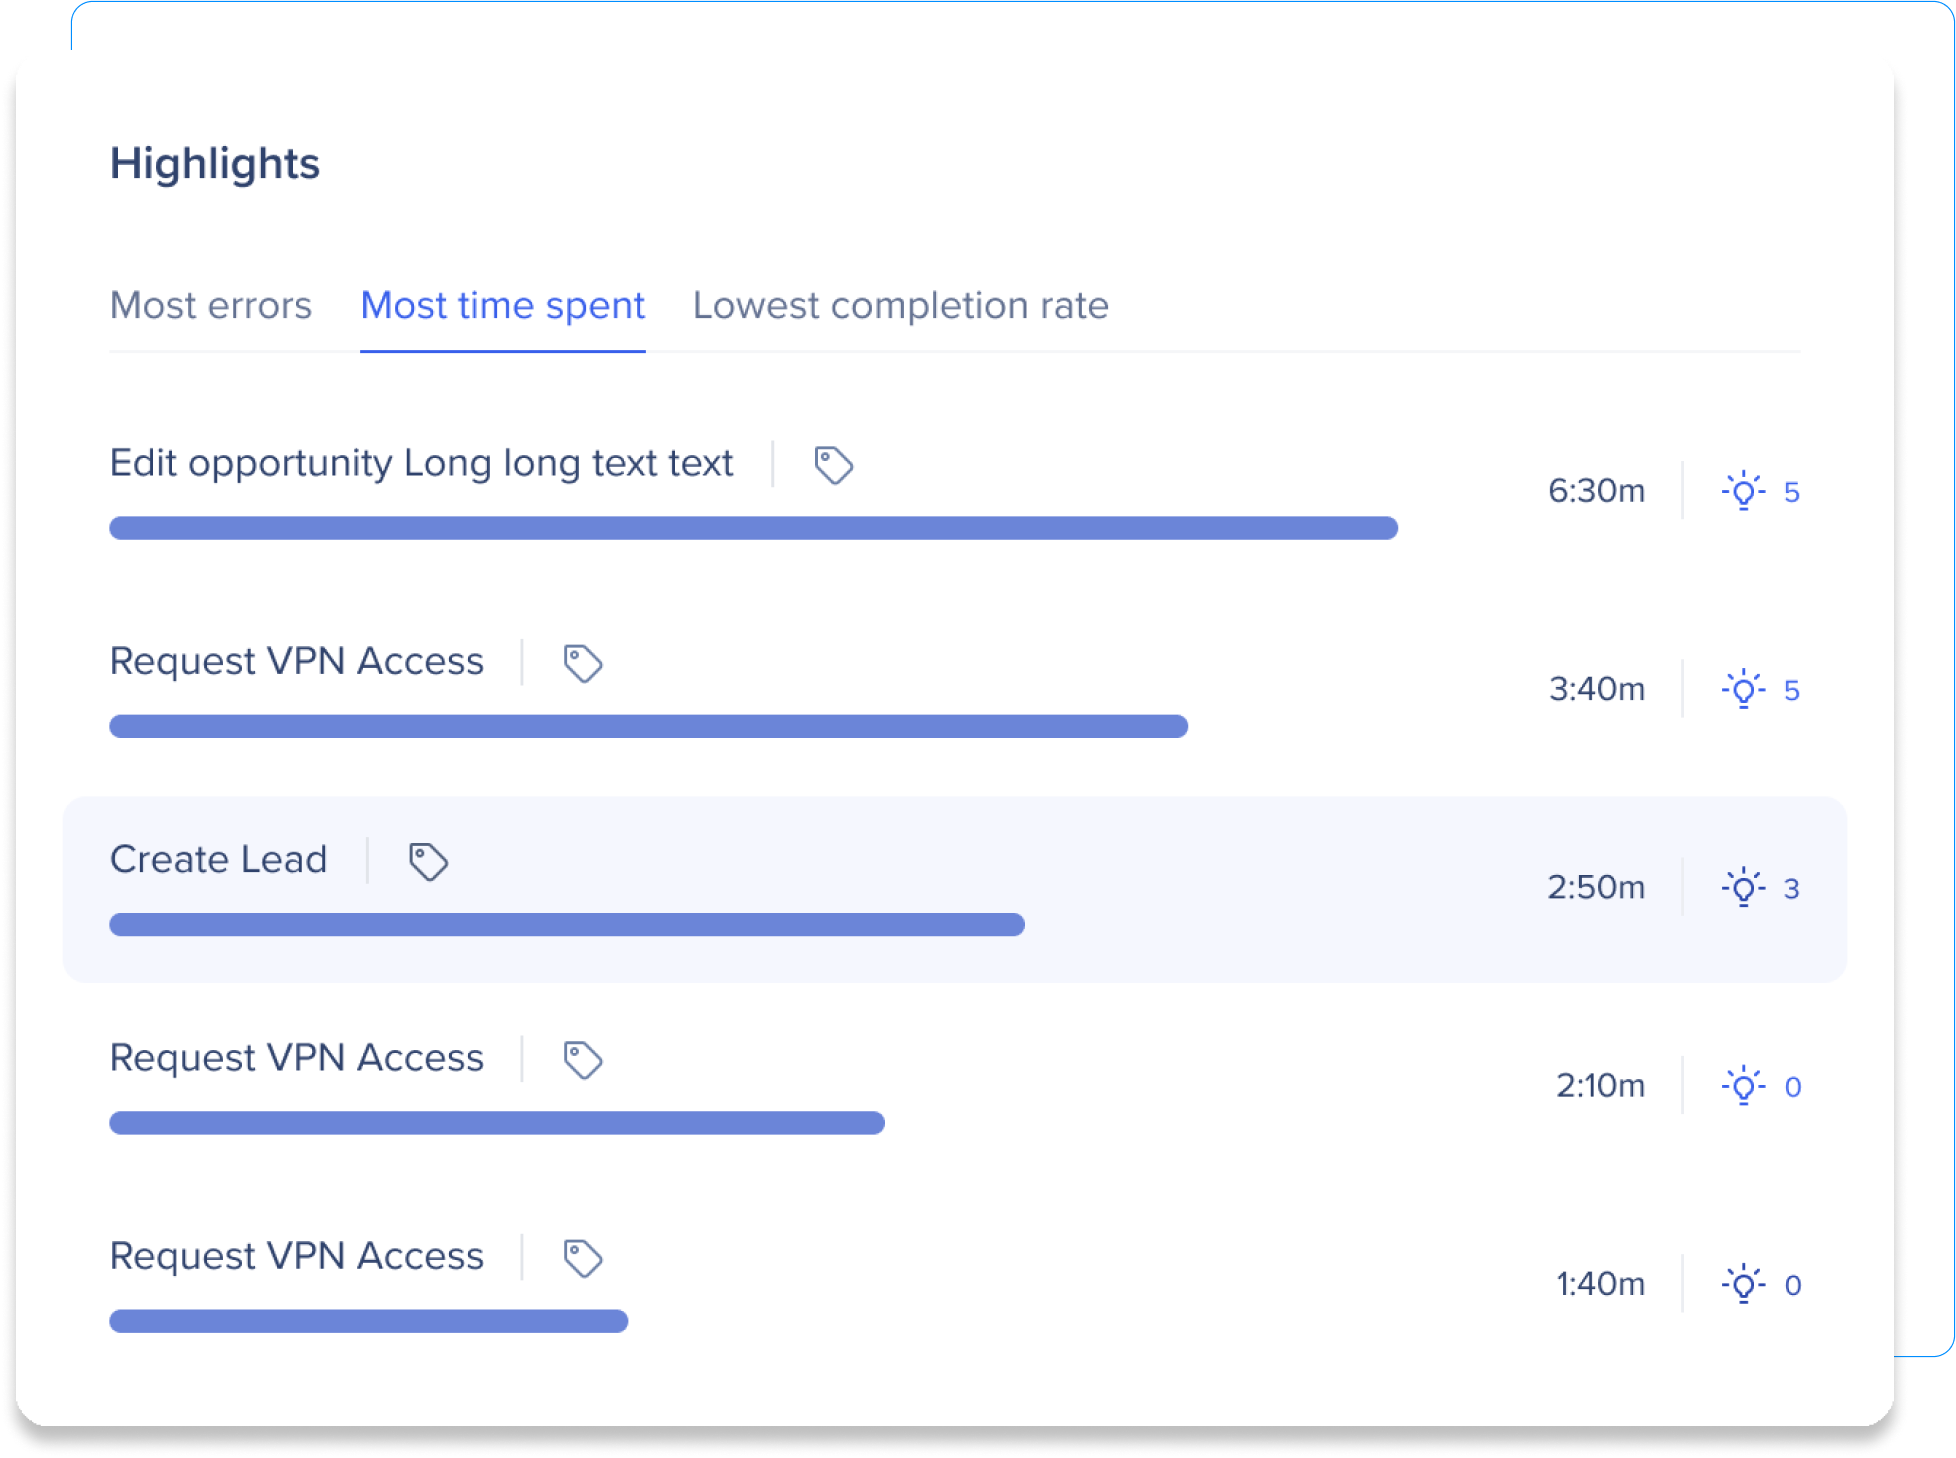
Highlights
The Highlights widget collects the forms that have the most potential for for updates. Highlights offer a quick way to start picking up forms for further investigation. We automatically populate the top forms that are under-performing in several metrics:
- Most errors: These are the forms that have the most errors encountered.
- Most time spent: These forms take the longest to complete of all the forms.
- Lowest completion rate: These forms have less submissions than the other forms.
Click the lightbulb to see recommendations for each form.
The all forms widget lists all of the forms that were identified by our AI-based algorithm.
Click on the toggles to learn more about the All Forms columns
Name
The name of the form as determined by the algorithm. Some names might be slightly different from the actual ones. This is due to an AI algorithm ignoring potentially private information.
Popularity
The percentage of the most viewed forms out of the total number of all form views.
Completion
The percentage of form views that ended with a successful submission, out of all the form views.
Submission errors
The percentage of failed submission attempts out of all the submission attempts (user clicked “Save”).
Field errors
Total number of form fields in which a validation error happened during a submission attempt.
Time spent
Average time of successful form submission, regardless of any errors during the process.
Tags
Add tags to forms for easy filtering and quickly find related forms and metrics.
You can also export the table's data for deeper analysis in 3rd party BI tools.
Export the table's data for deeper analysis in 3rd party BI tools
How to export:
-
Select one or multiple forms and click the Export icon next to the search field, or hover over a specific form and click its Export icon
-
You can also export from the form heatmap page
What you get: When exporting, the system generates and downloads a ZIP file containing two CSV reports.
-
Form-Level Report: The existing high-level metrics per form (for example: sessions, completion rate, overall errors)
-
Field-Level Report: Granular, per-field data for each selected form, with one row per field. Includes the following columns:
-
Form Name
-
Form ID
-
Field Name
-
Number of Errors
-
Total Time Spent
-
Total Clicks
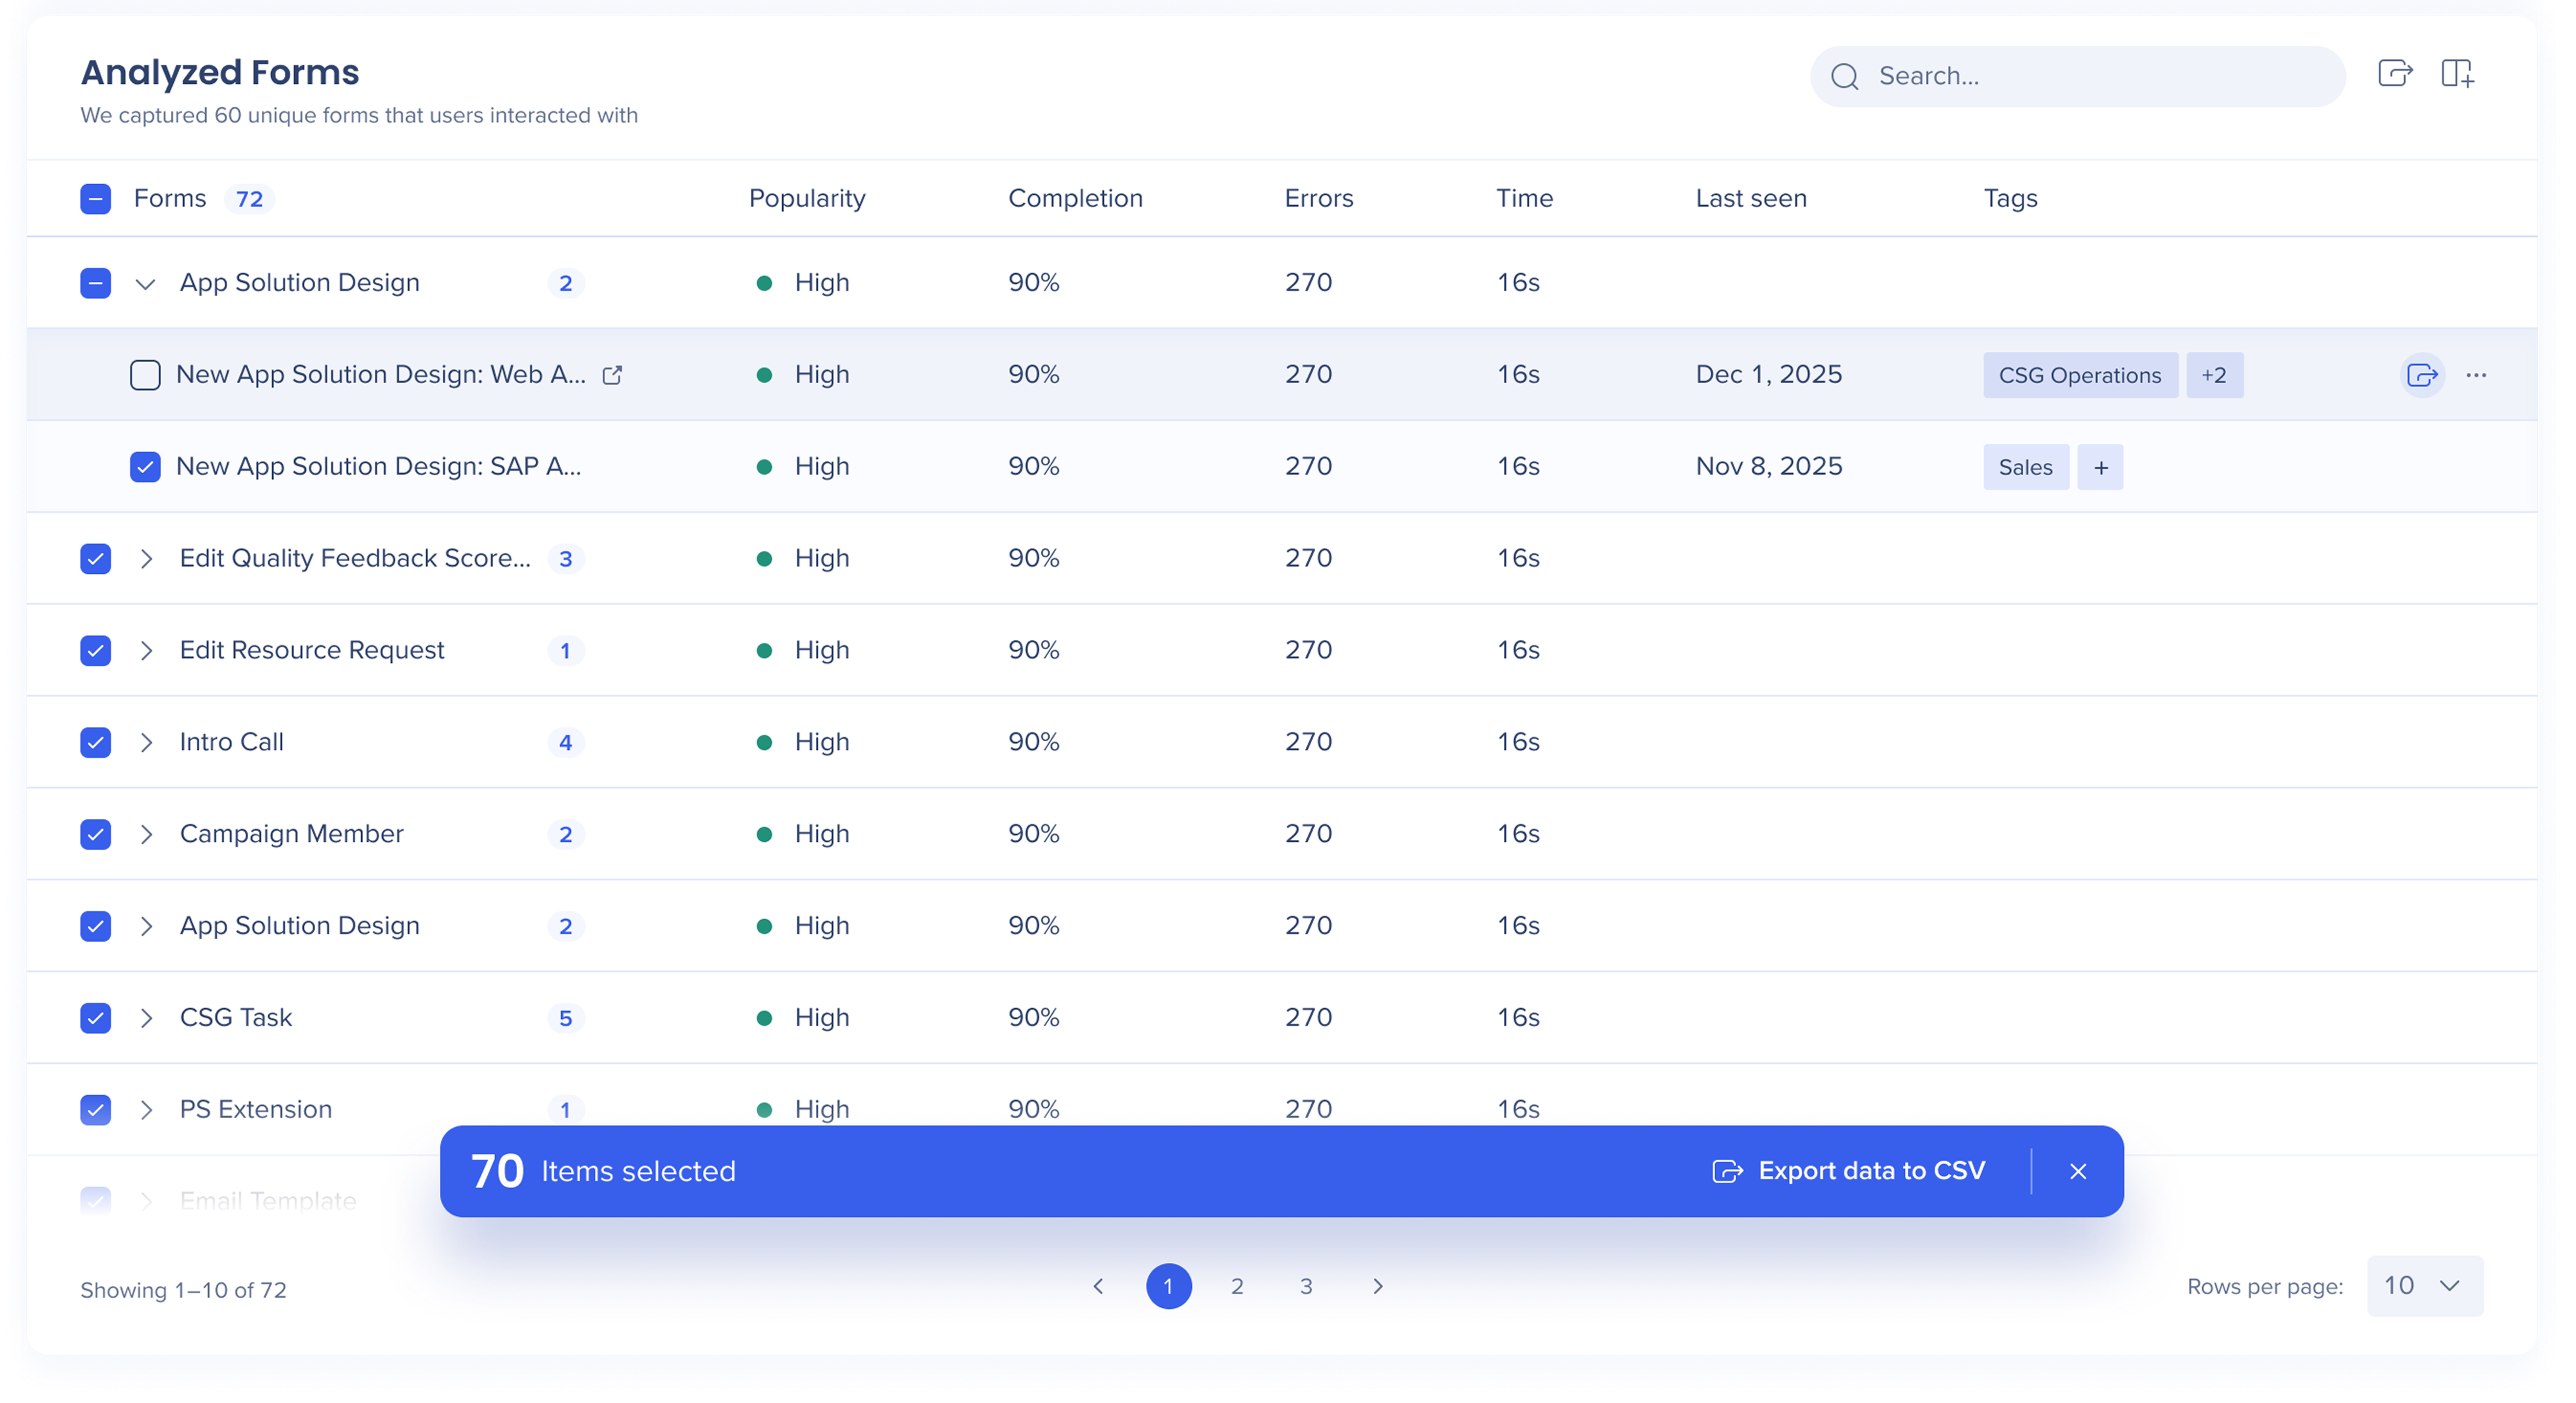
Note
If you've applied a department filter, the CSV file will only include data from the selected department.
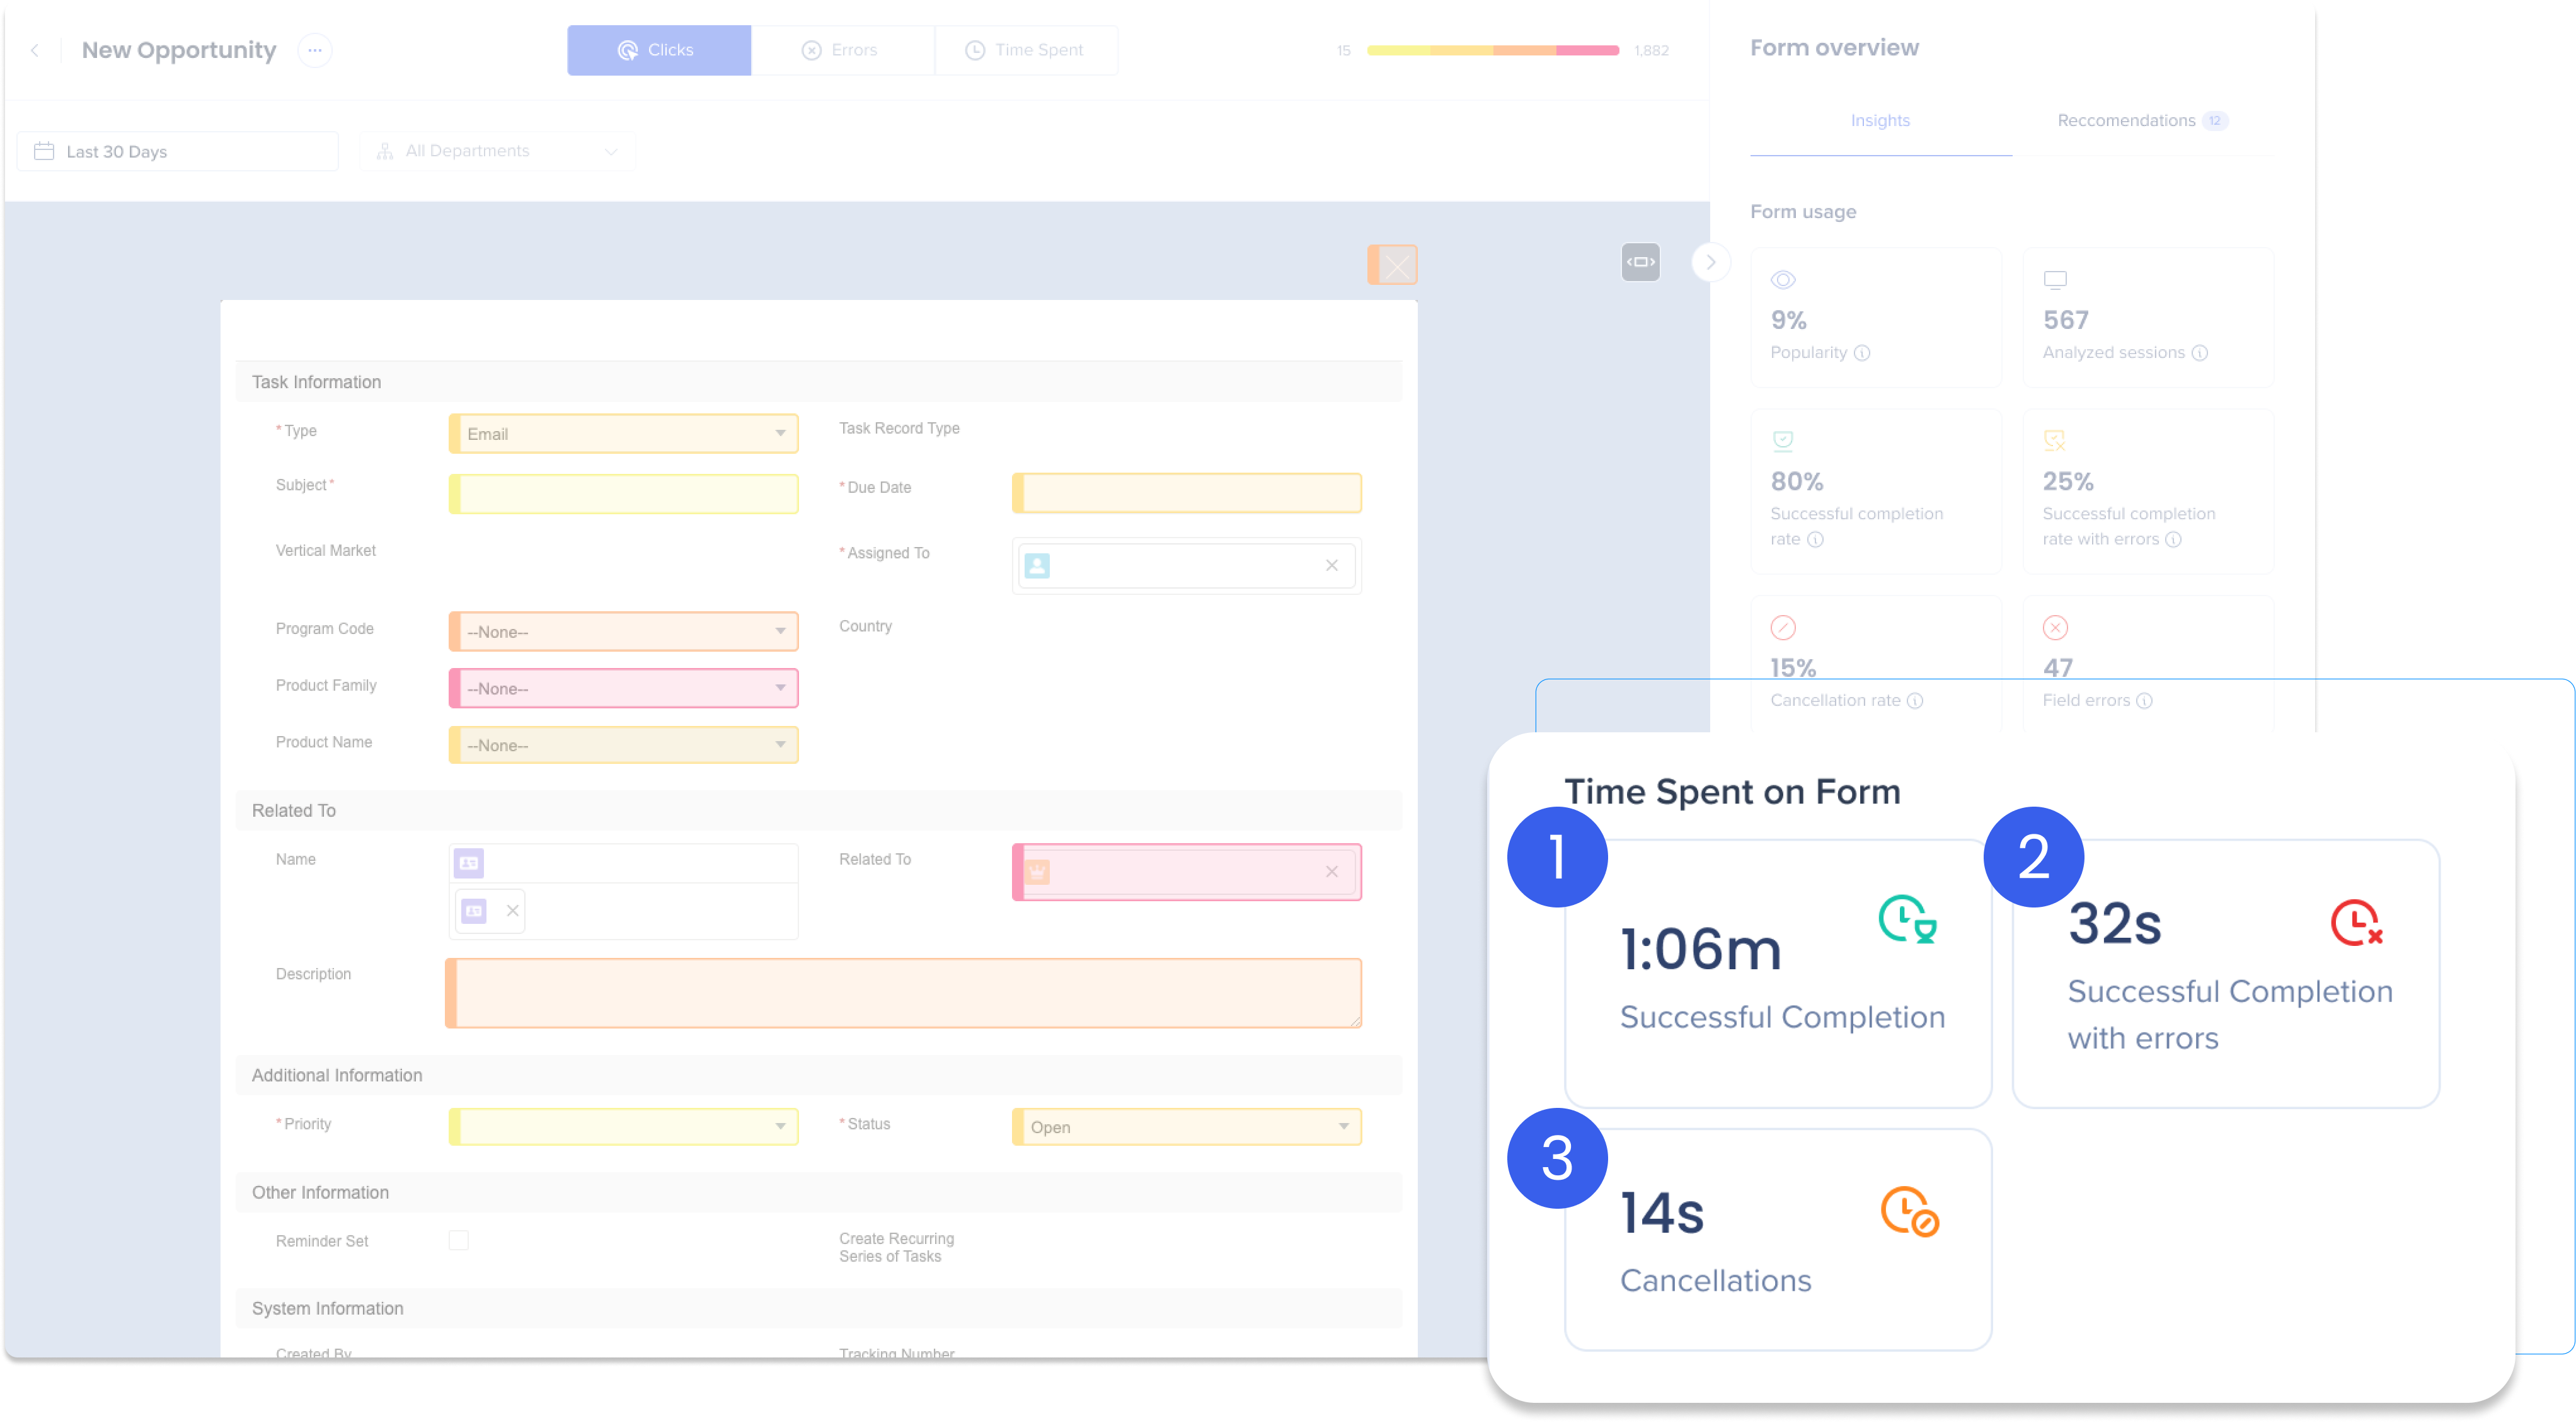
Form Page
After selecting a form from the dashboard, you reach the form page.
Here, you can see the actual form (excluding any potential personal content we automatically exclude), see various statistics about the entire form, field-level statistics, and industry benchmarks.
Heat Map
Use the heat map for a visualization on how this form is being used. Switch between Clicks, Errors, and Time Spent to see the statistics for each type of interaction.
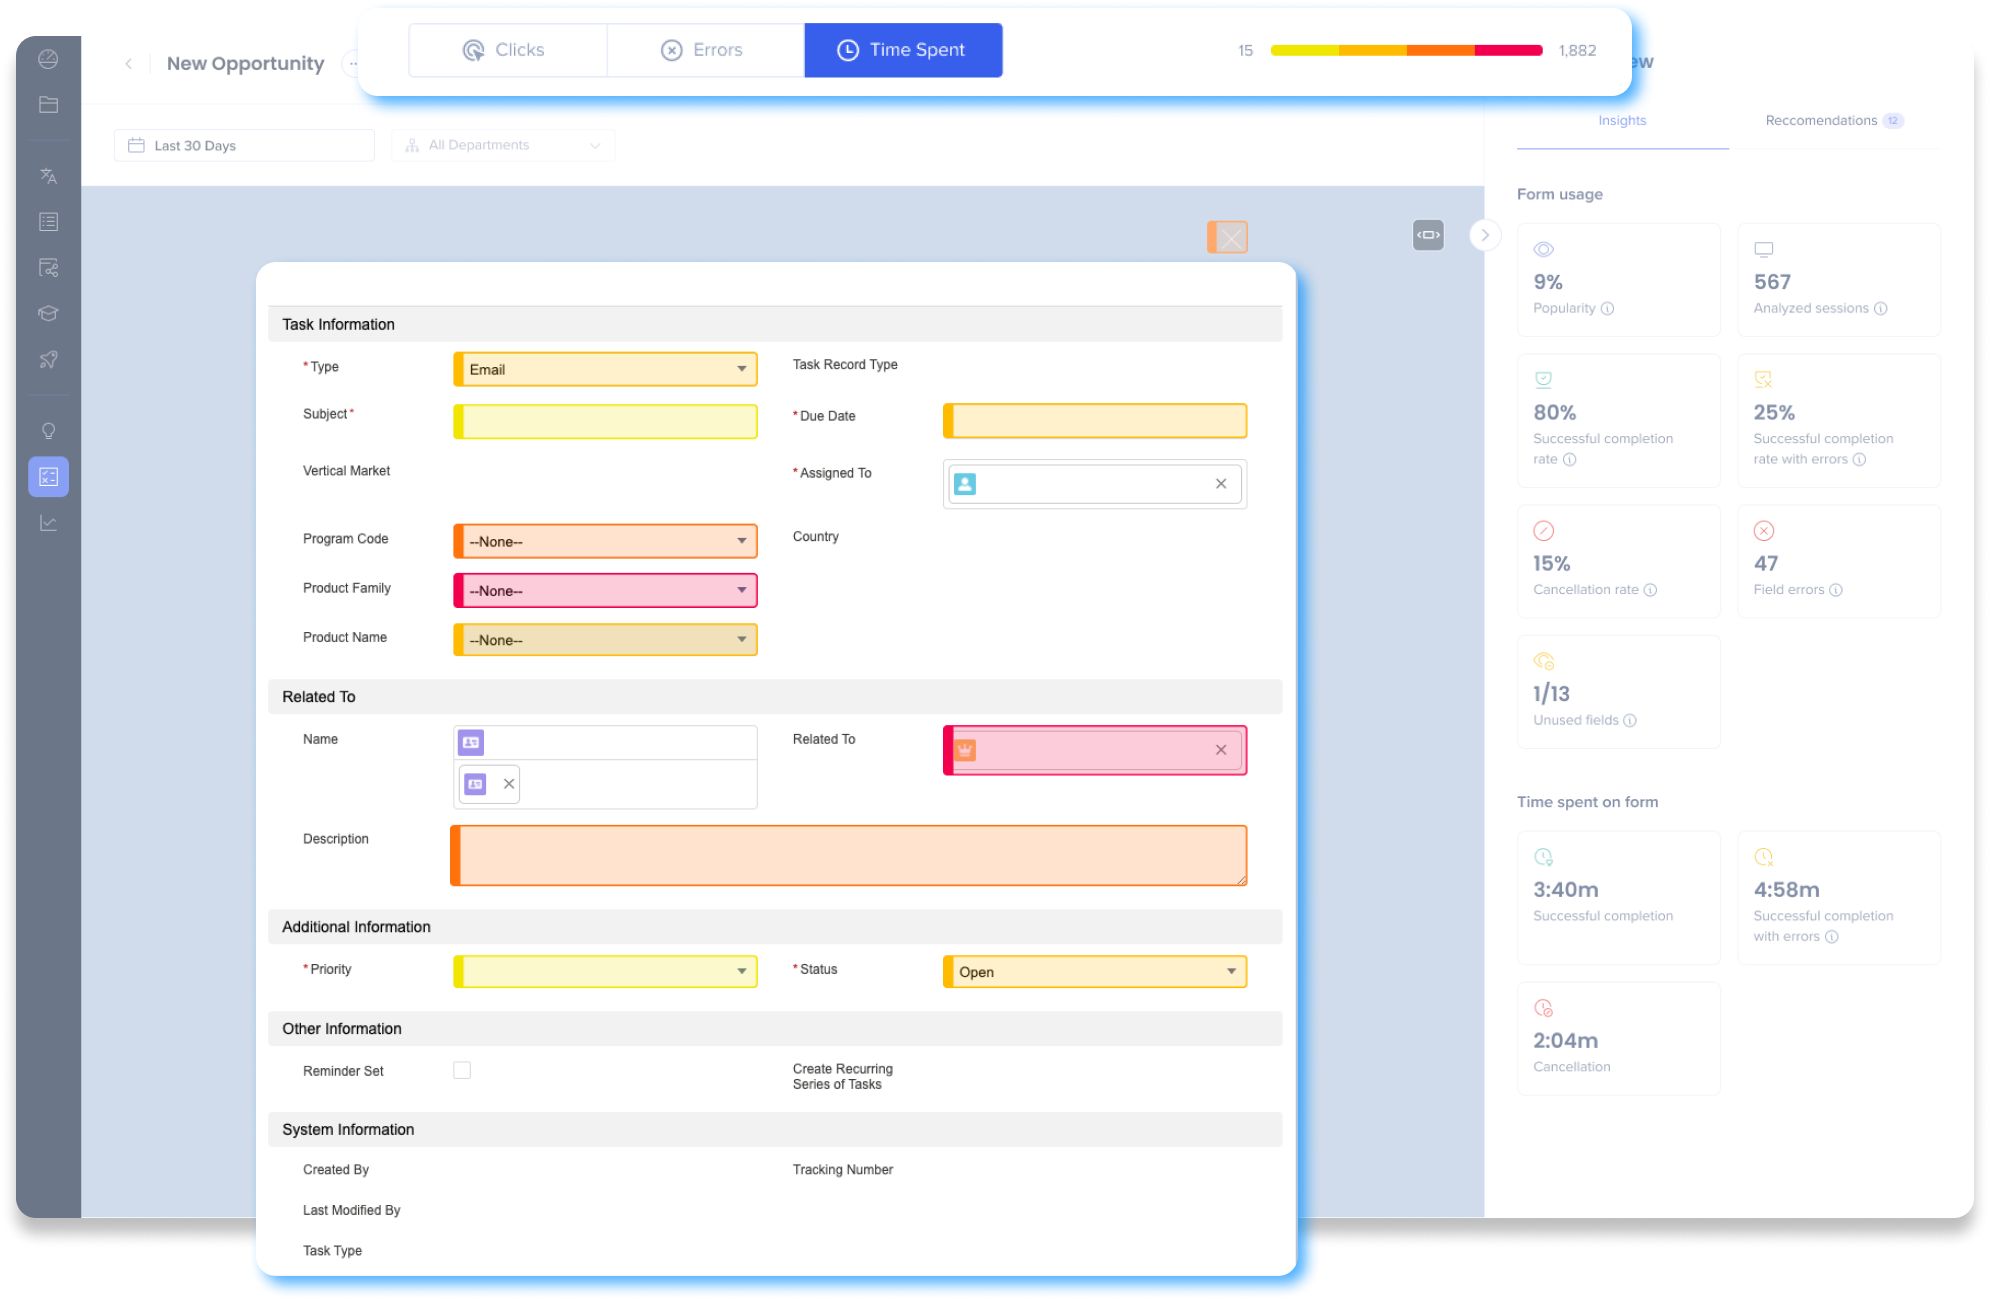
The fields are highlighted in different colors based on the range in which the specific value is at, for easier orientation when analyzing the data.
Color Spectrum

The color spectrum grades each interaction from lowest to highest and highlights each field with the corresponding color. Yellow is the lowest and pink is the highest.
The metric by which we present the data is selected at the top of the form:

Click on the tabs to learn more about the heat map metrics
Analyzing user clicks can help you understand how people are interacting with the form. Clicks are analyzed as follows:
- The total number of clicks on the form elements (input fields, buttons, etc.)
- Indication for user activity: popular fields, skipped fields, etc.
- Highest values are colored pink
Analyzing errors can help you understand if a field is confusing or complex. Errors are analyzed as follows:
- The total number of validation errors of fields, plus a detailed view of the errors themselves (the validation messages), with their number of occurrences
- Highest values are colored pink
How long people spend on your form can help you understand if the form is as productive as you want. Perhaps the form is too complicated and people are spending too much time to complete it. Time spent is analyzed as follows:
- The total time users spend (on average) on a selected field
- Indication of complicated, lengthy, or confusing fields. Pink indicates the highest complication
Click on the toggles to learn more about each metric
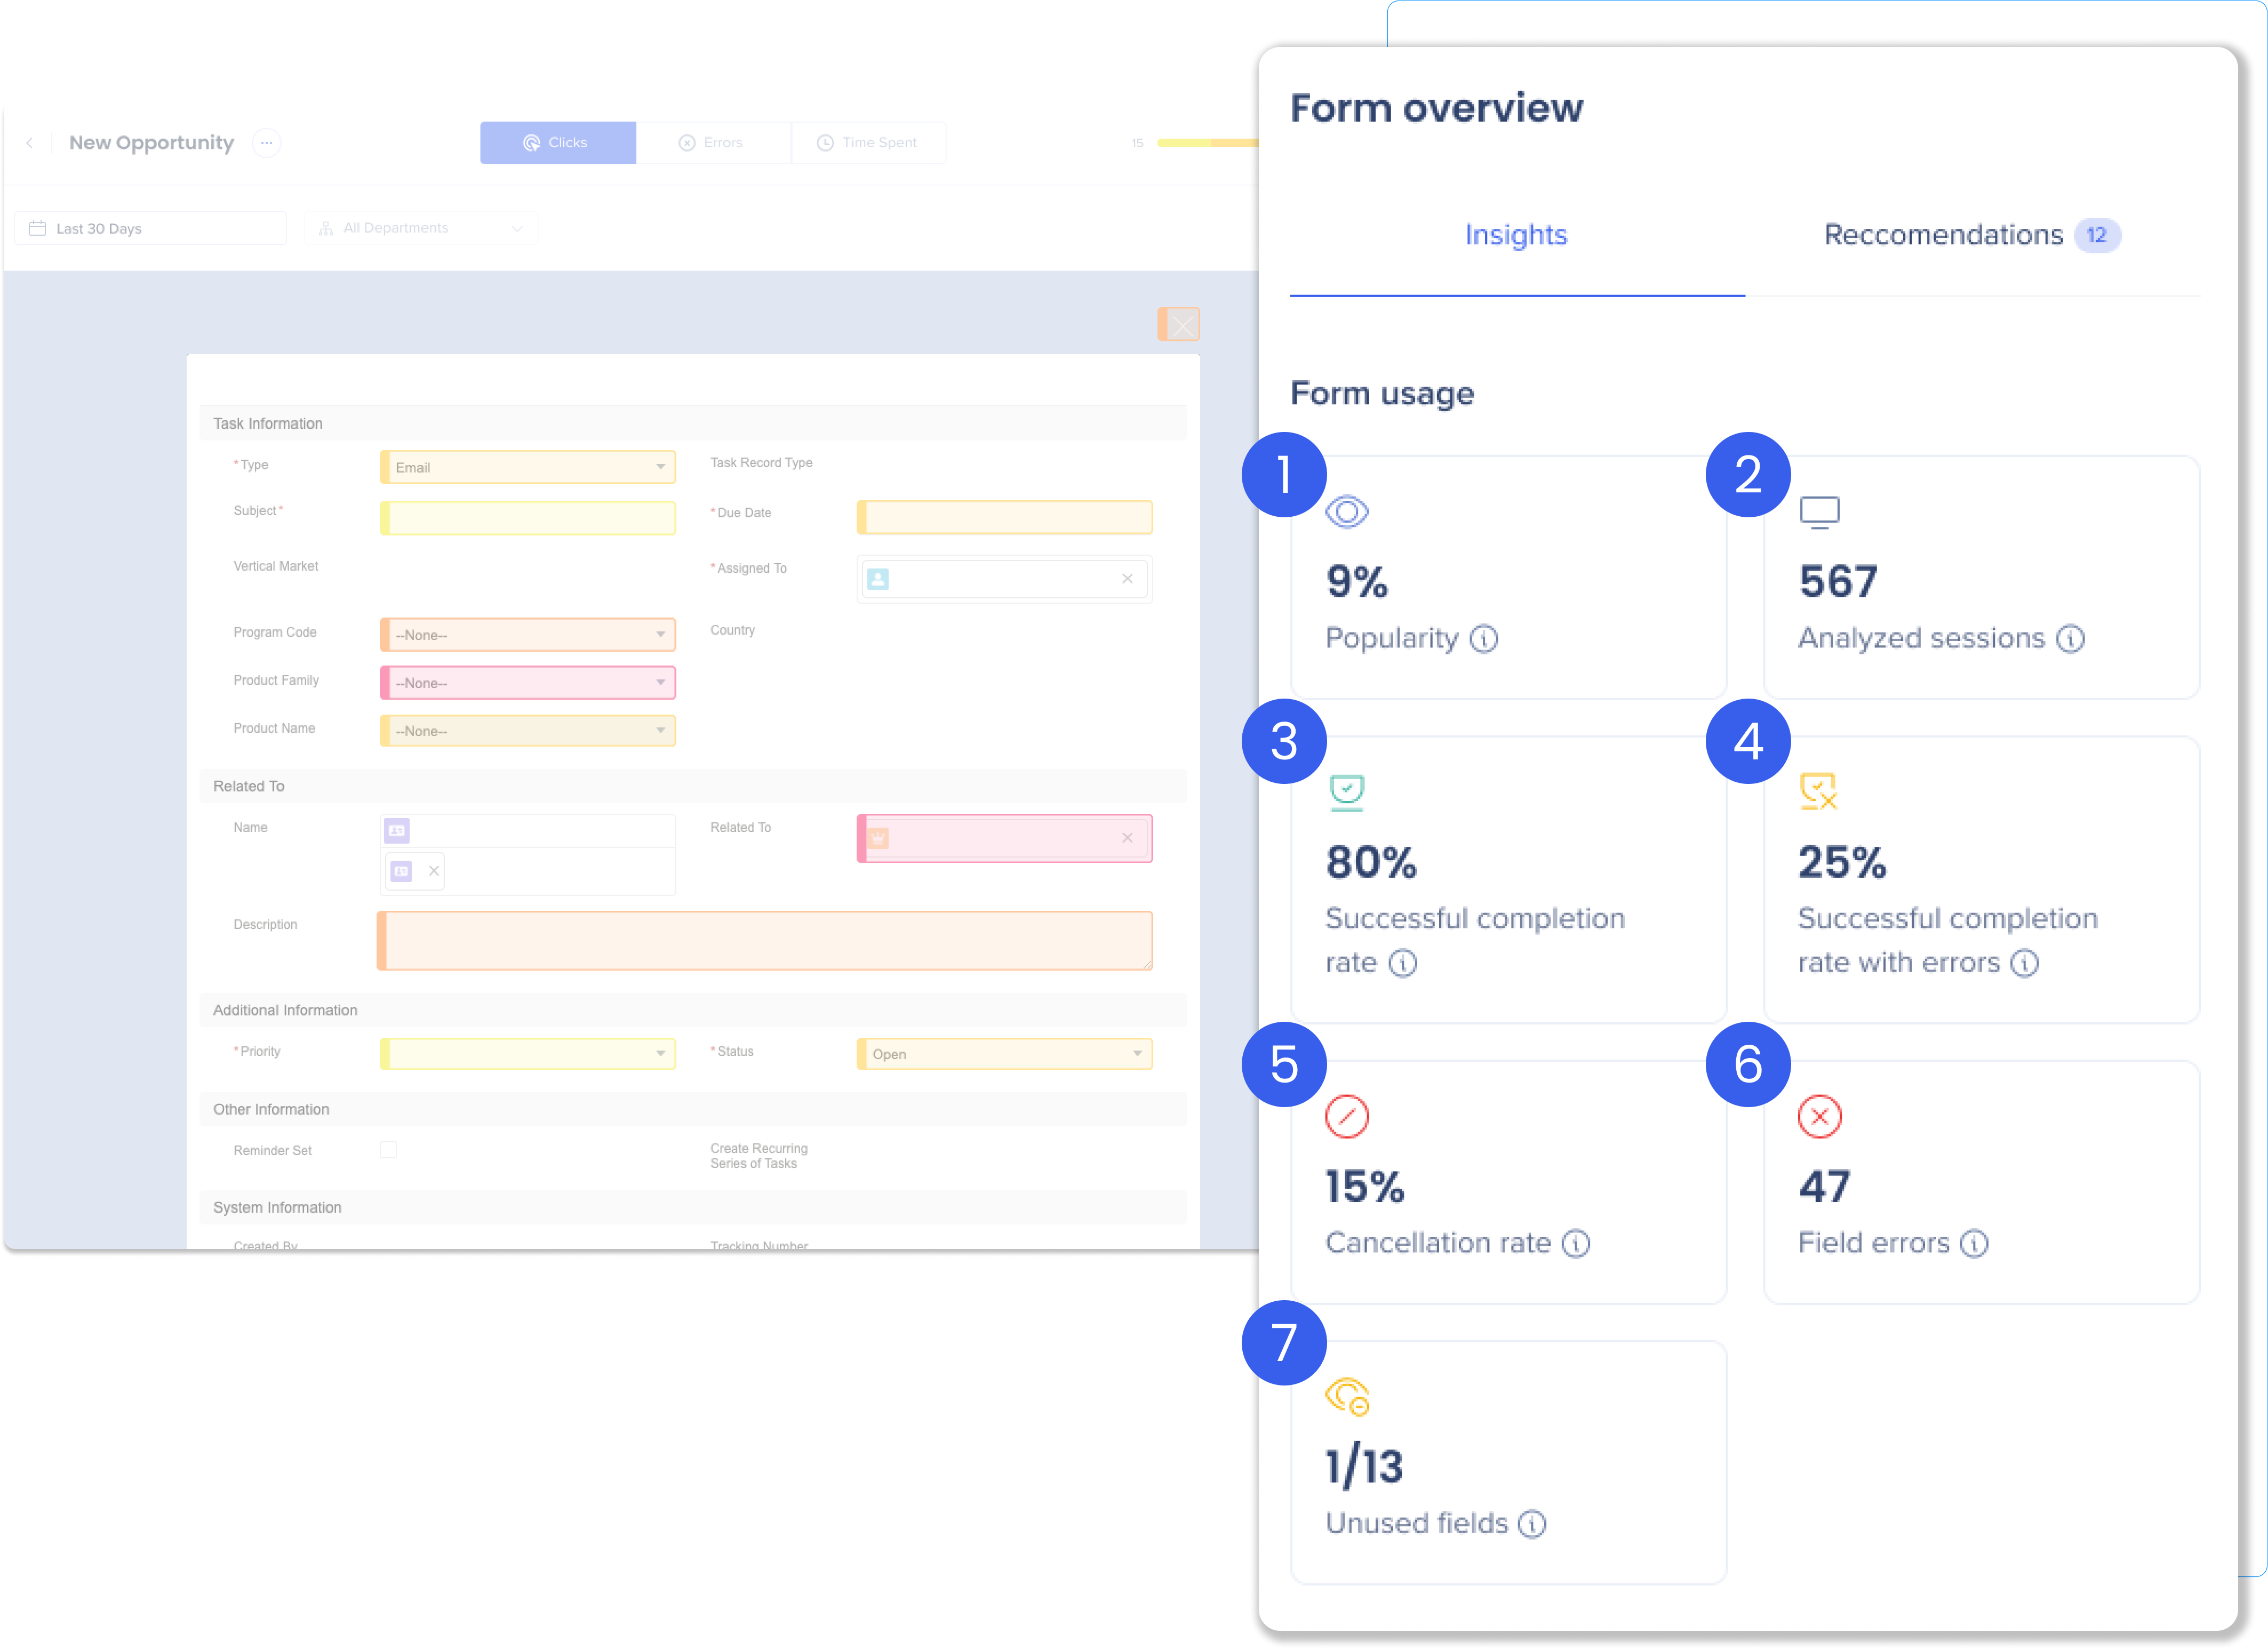
1. Popularity
The percentage of form views (how many times this form was viewed by users) out of the total number of all form views in the platform. Use it to identify the most popular forms and the less used ones.
2. Analyzed sessions
Total form views analyzed and validated within this timeframe.
3. Successful completion rate
The percentage of form views that ended with a successful submission, out of all the form views (submission attempt means the user clicked “Save” or "Submit").
4. Completion with errors
The percentage of failed submission attempts out of all the submission attempts (user clicked “Save”).
5. Cancelation Rate
The percentage of times a form was started and then abandoned without submitting.
6. Field errors
The total number of fields in the form where a validation error happened during the submission attempt.
7. Unused fields
The number of fields in the form never used or clicked on out of all fields.
Click on the toggles to learn more about each metric
1. Completion
The average time it takes to successfully submit the form (regardless if there were any errors during the submission process).
2. Submission errors
The average time it takes to successfully submit the form where the user has experienced at least one error while filling out the form. Compare it with the Completion time (above) to estimate how much extra time your users are wasting on errors.
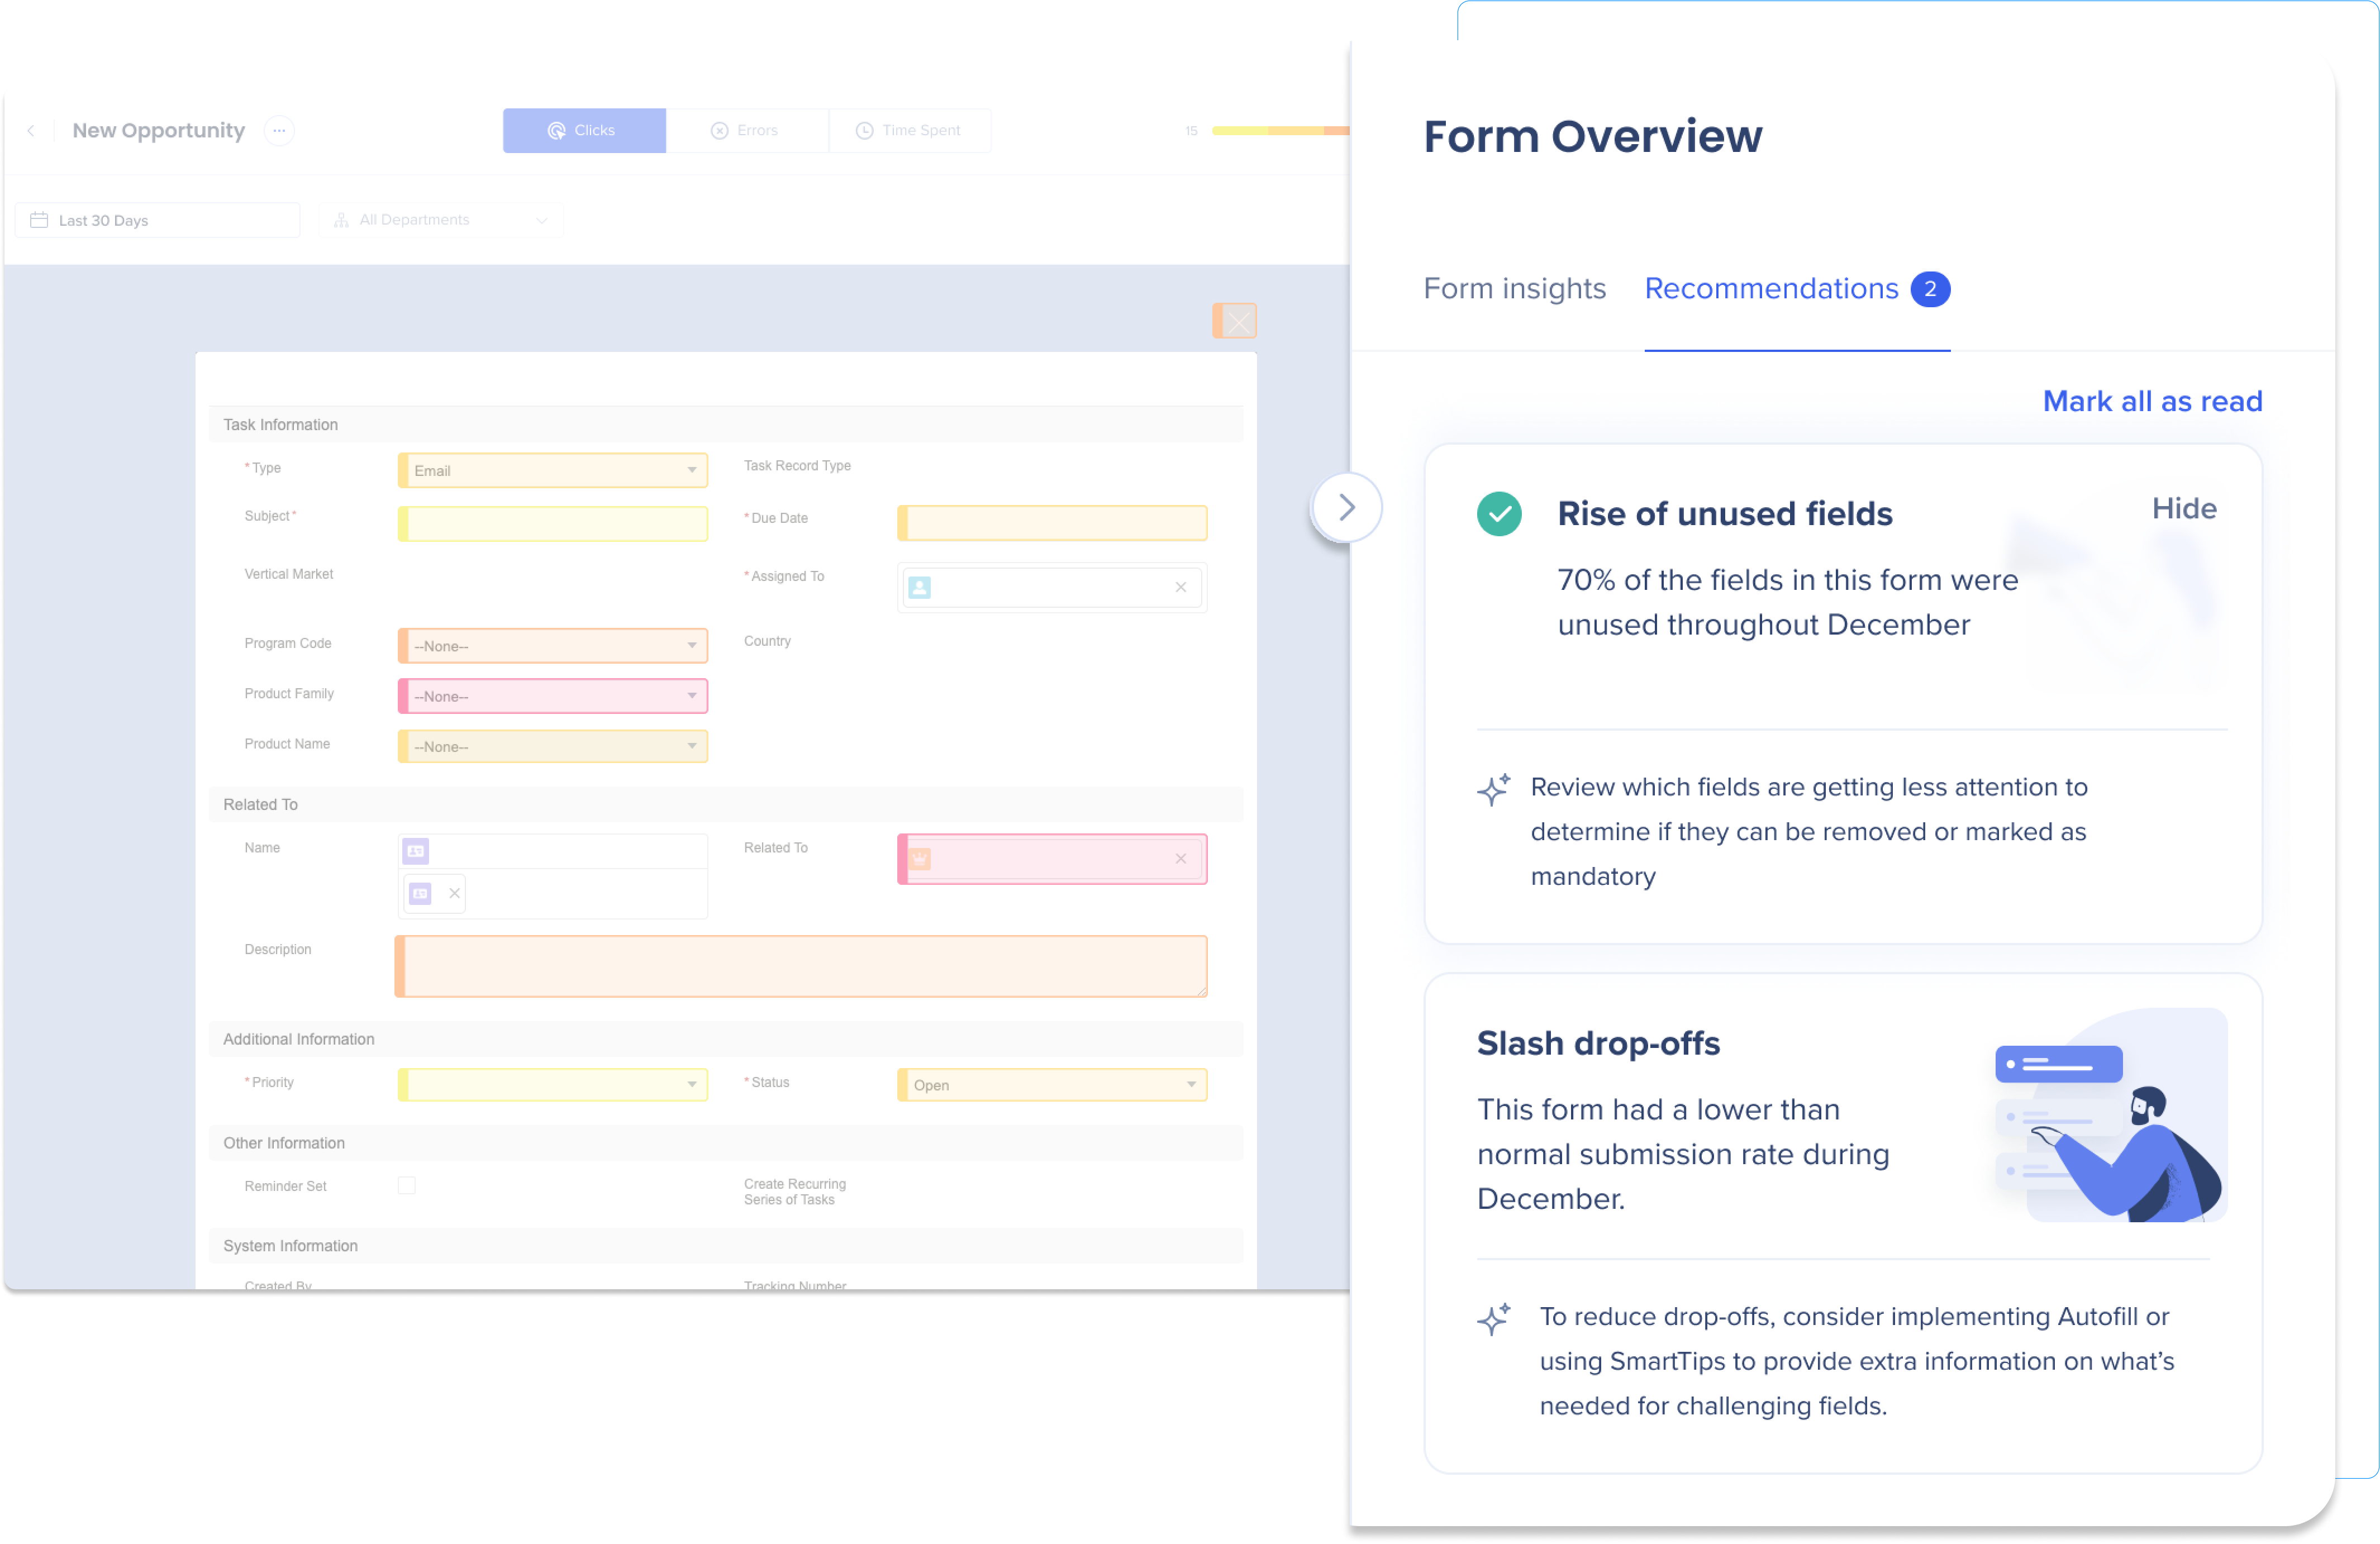
Similar to the recommendations widget on the Overview Dashboard, the form's recommendation tab shows the recommendations unique to this form. You can mark recommendations as read to remove them from this panel.
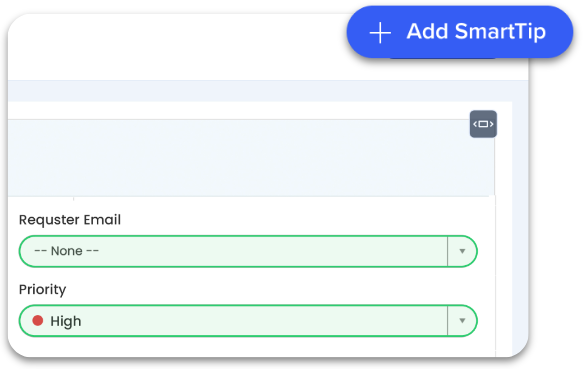
Add a SmartTip directly from UII
Enhance employee experience and streamline form interactions by adding SmartTips directly from UII. SmartTips can be captured and generated within the UII Console, eliminating the need to access the Editor. This way, you can create content based on real-time data, addressing actual friction points within forms.
Not a builder? Here's a tip
Add the SmartTip and leave it as a draft. This way, the builder knows where you want the SmartTip and what you want it to say, and they can publish it.
You now have the option to copy the original URL from when the form was initially captured.
To copy the form URL to your clipboard, open the menu located beside the form name and select the Copy Form URL option.
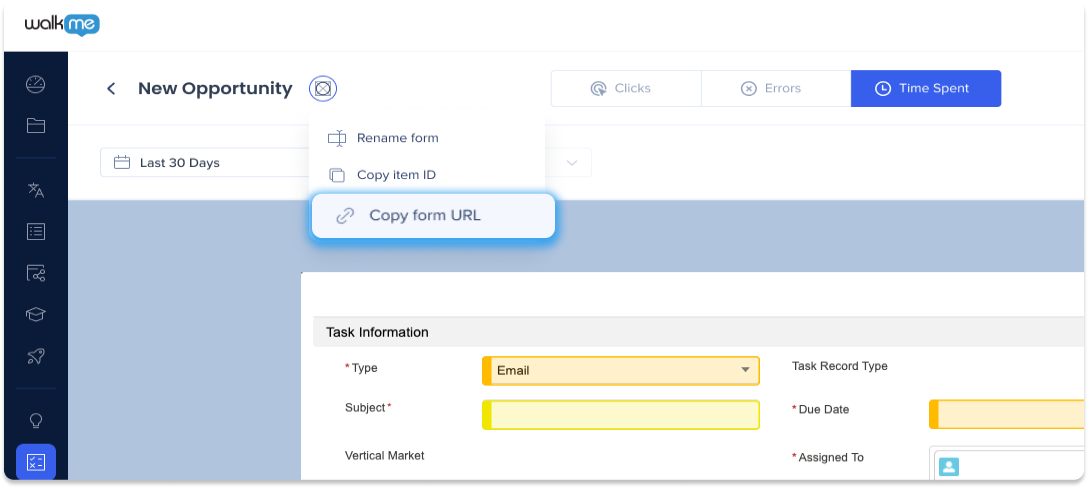
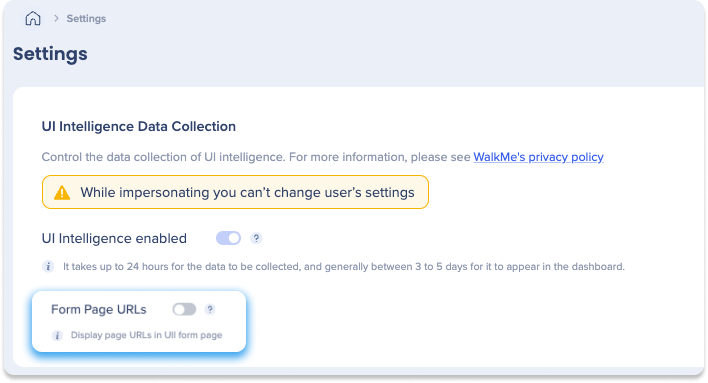
Enable Copy Form URL:
To use copy form URL, you must enable it in the UI Intelligence Settings tab in the Console:
- Click the UI Intelligence tab from the Console sidebar
- Select the Settings tab
- Click the Form Page URLs toggle to enable