Brief Overview
The Events page in the WalkMe Console is a centralized workspace for managing, visualizing, and analyzing Tracked Events and Engaged Elements. It lets you review all events in one place, explore trends over time, and create visualizations to understand user behavior across your application using the Management and Visualization tabs.
Access
You can access the Events page from the Insights app in the WalkMe Console.
Select the link for your data center:
Event Types
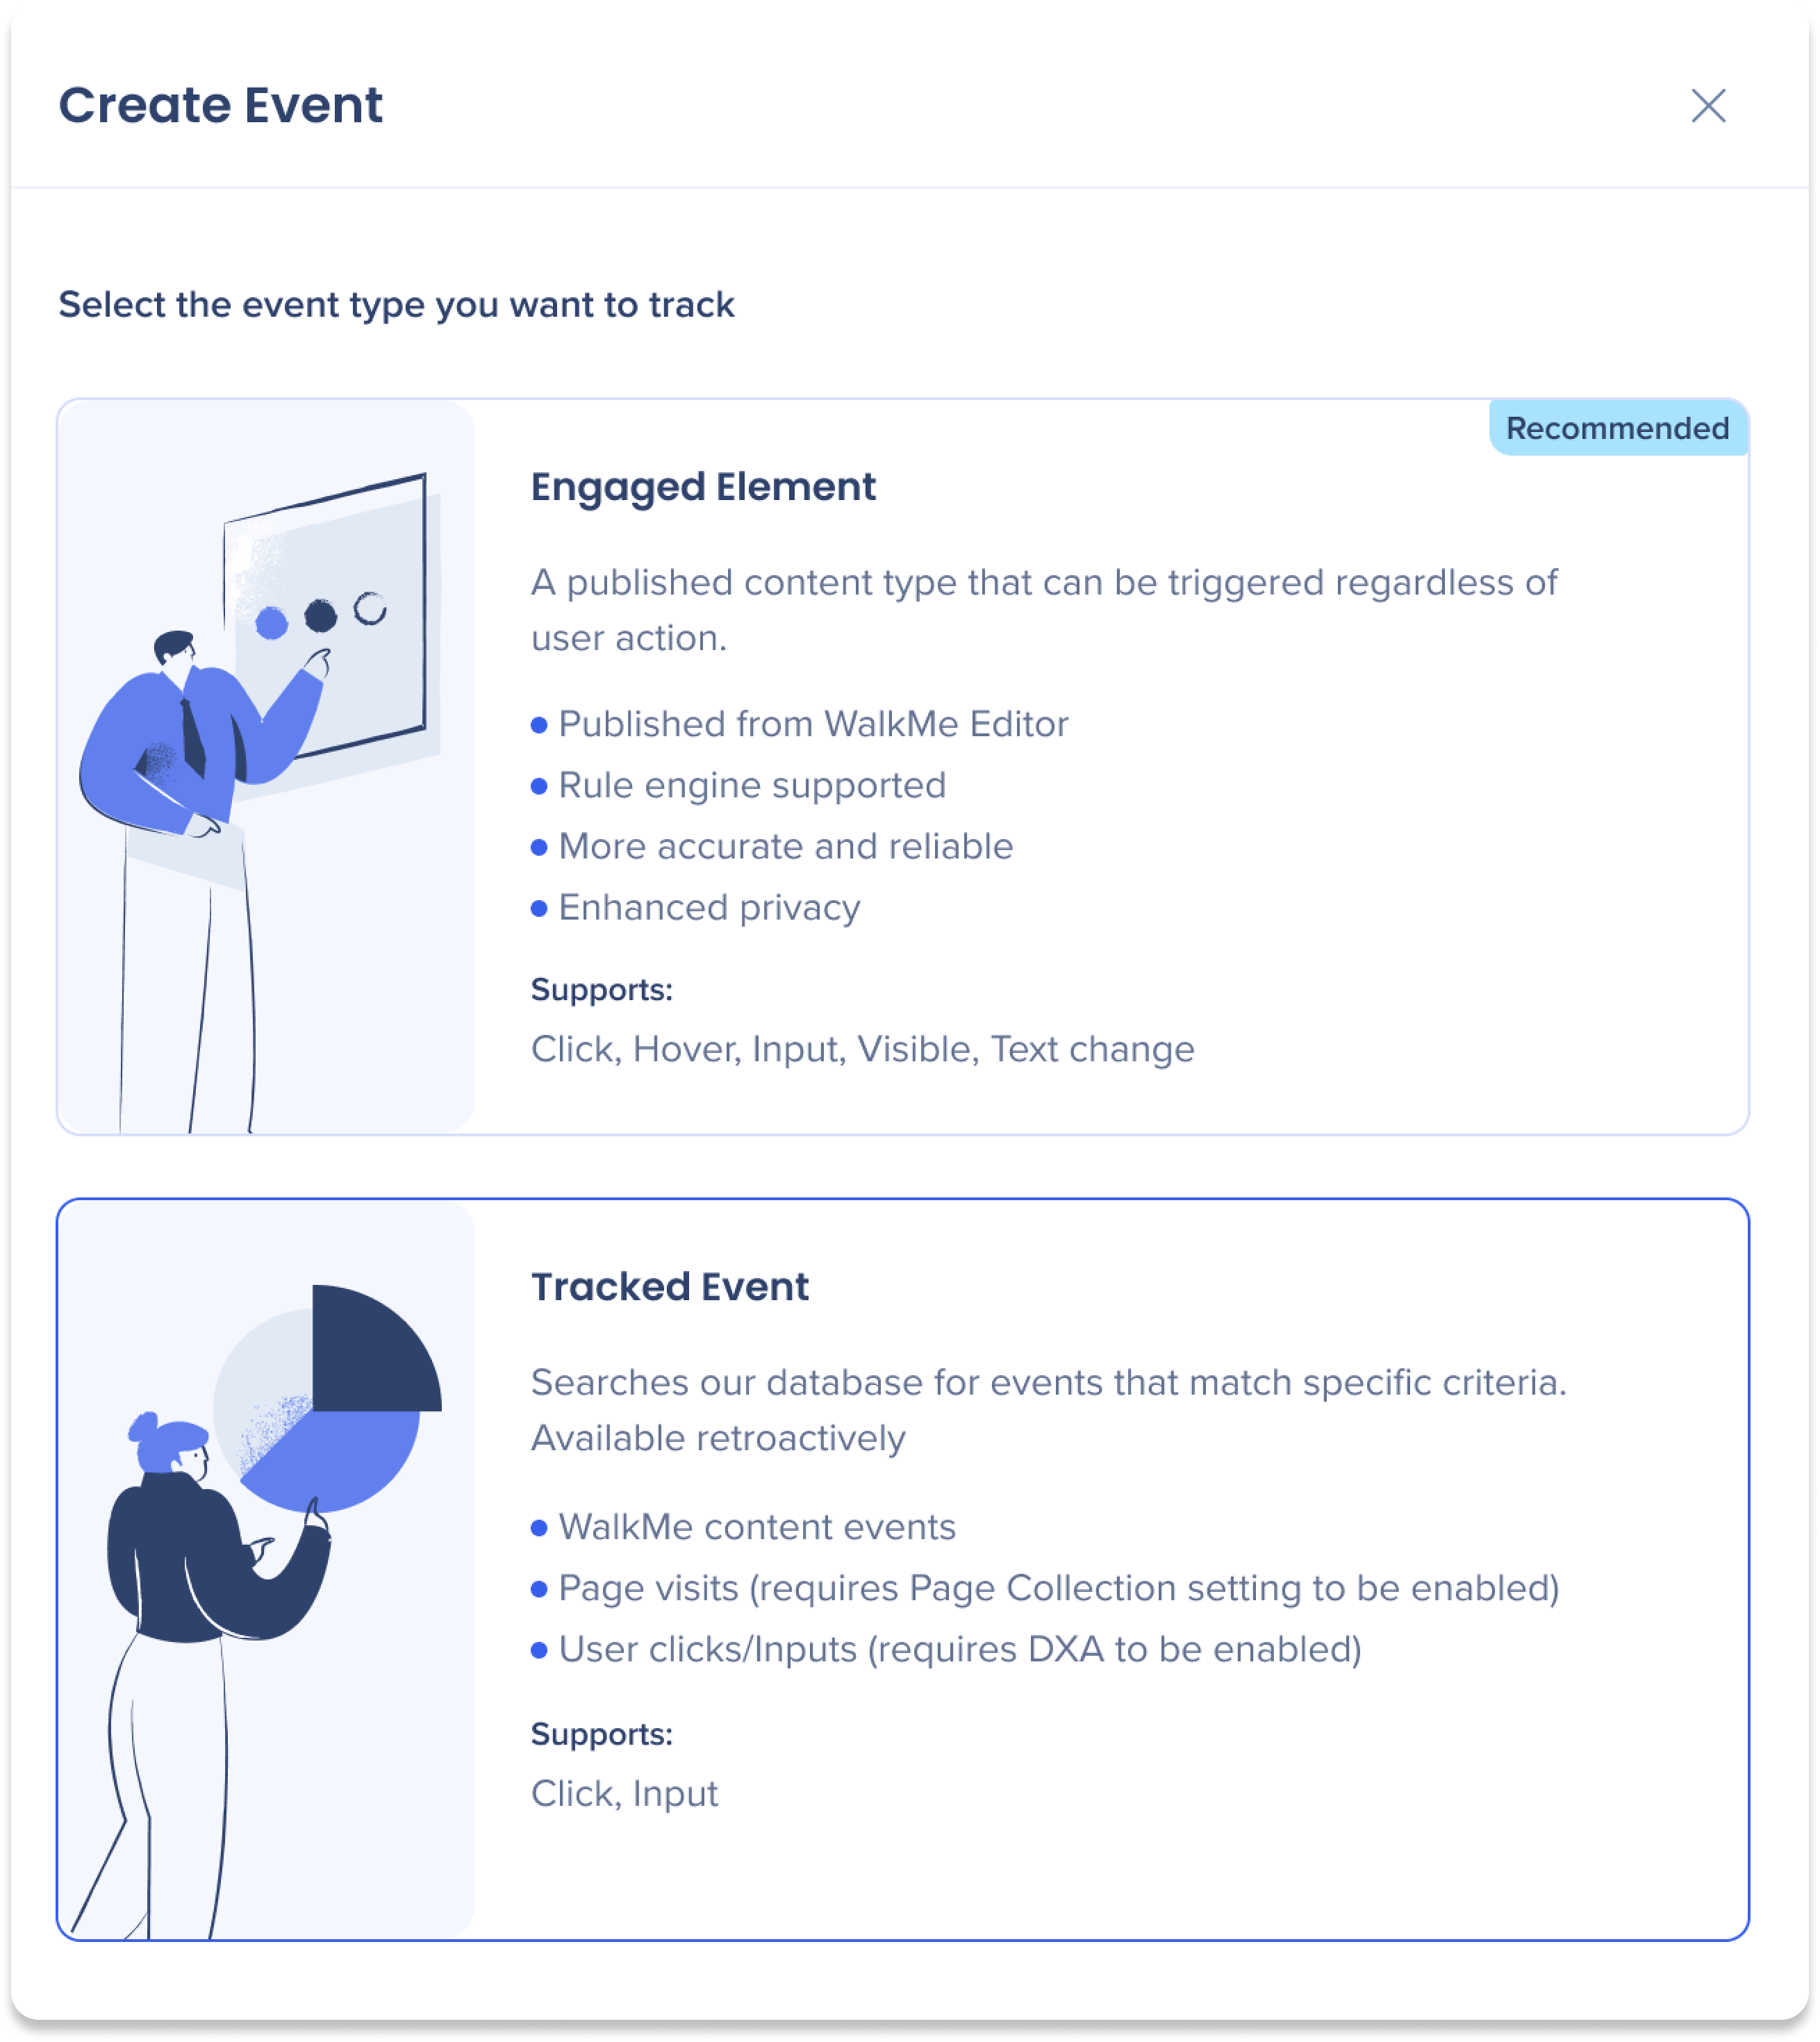
The Events page supports two event types. Use the descriptions below to choose the right option for your use case.
Engaged Elements
Editor-based interaction tracking designed for accurate, privacy-conscious insights.
Key characteristics
- Created by capturing elements in the WalkMe Editor
- Published from the WalkMe Editor
- Supports the rule engine for precise targeting
- Provides more accurate and reliable tracking
- Offers enhanced privacy compared to DXA-based tracking
- Supports interactions such as Click, Hover, Input, Visible, and Text change
About Insights Engaged Elements
Tracked Events
Event-based tracking for measuring end-to-end processes and business outcomes.
Key characteristics
- Created through manual setup or capturing
- Supports interactions with WalkMe content
- Supports Click and Input interactions (requires DXA)
- Supports Page visits (requires page selection to be enabled)
About Insights Tracked Events
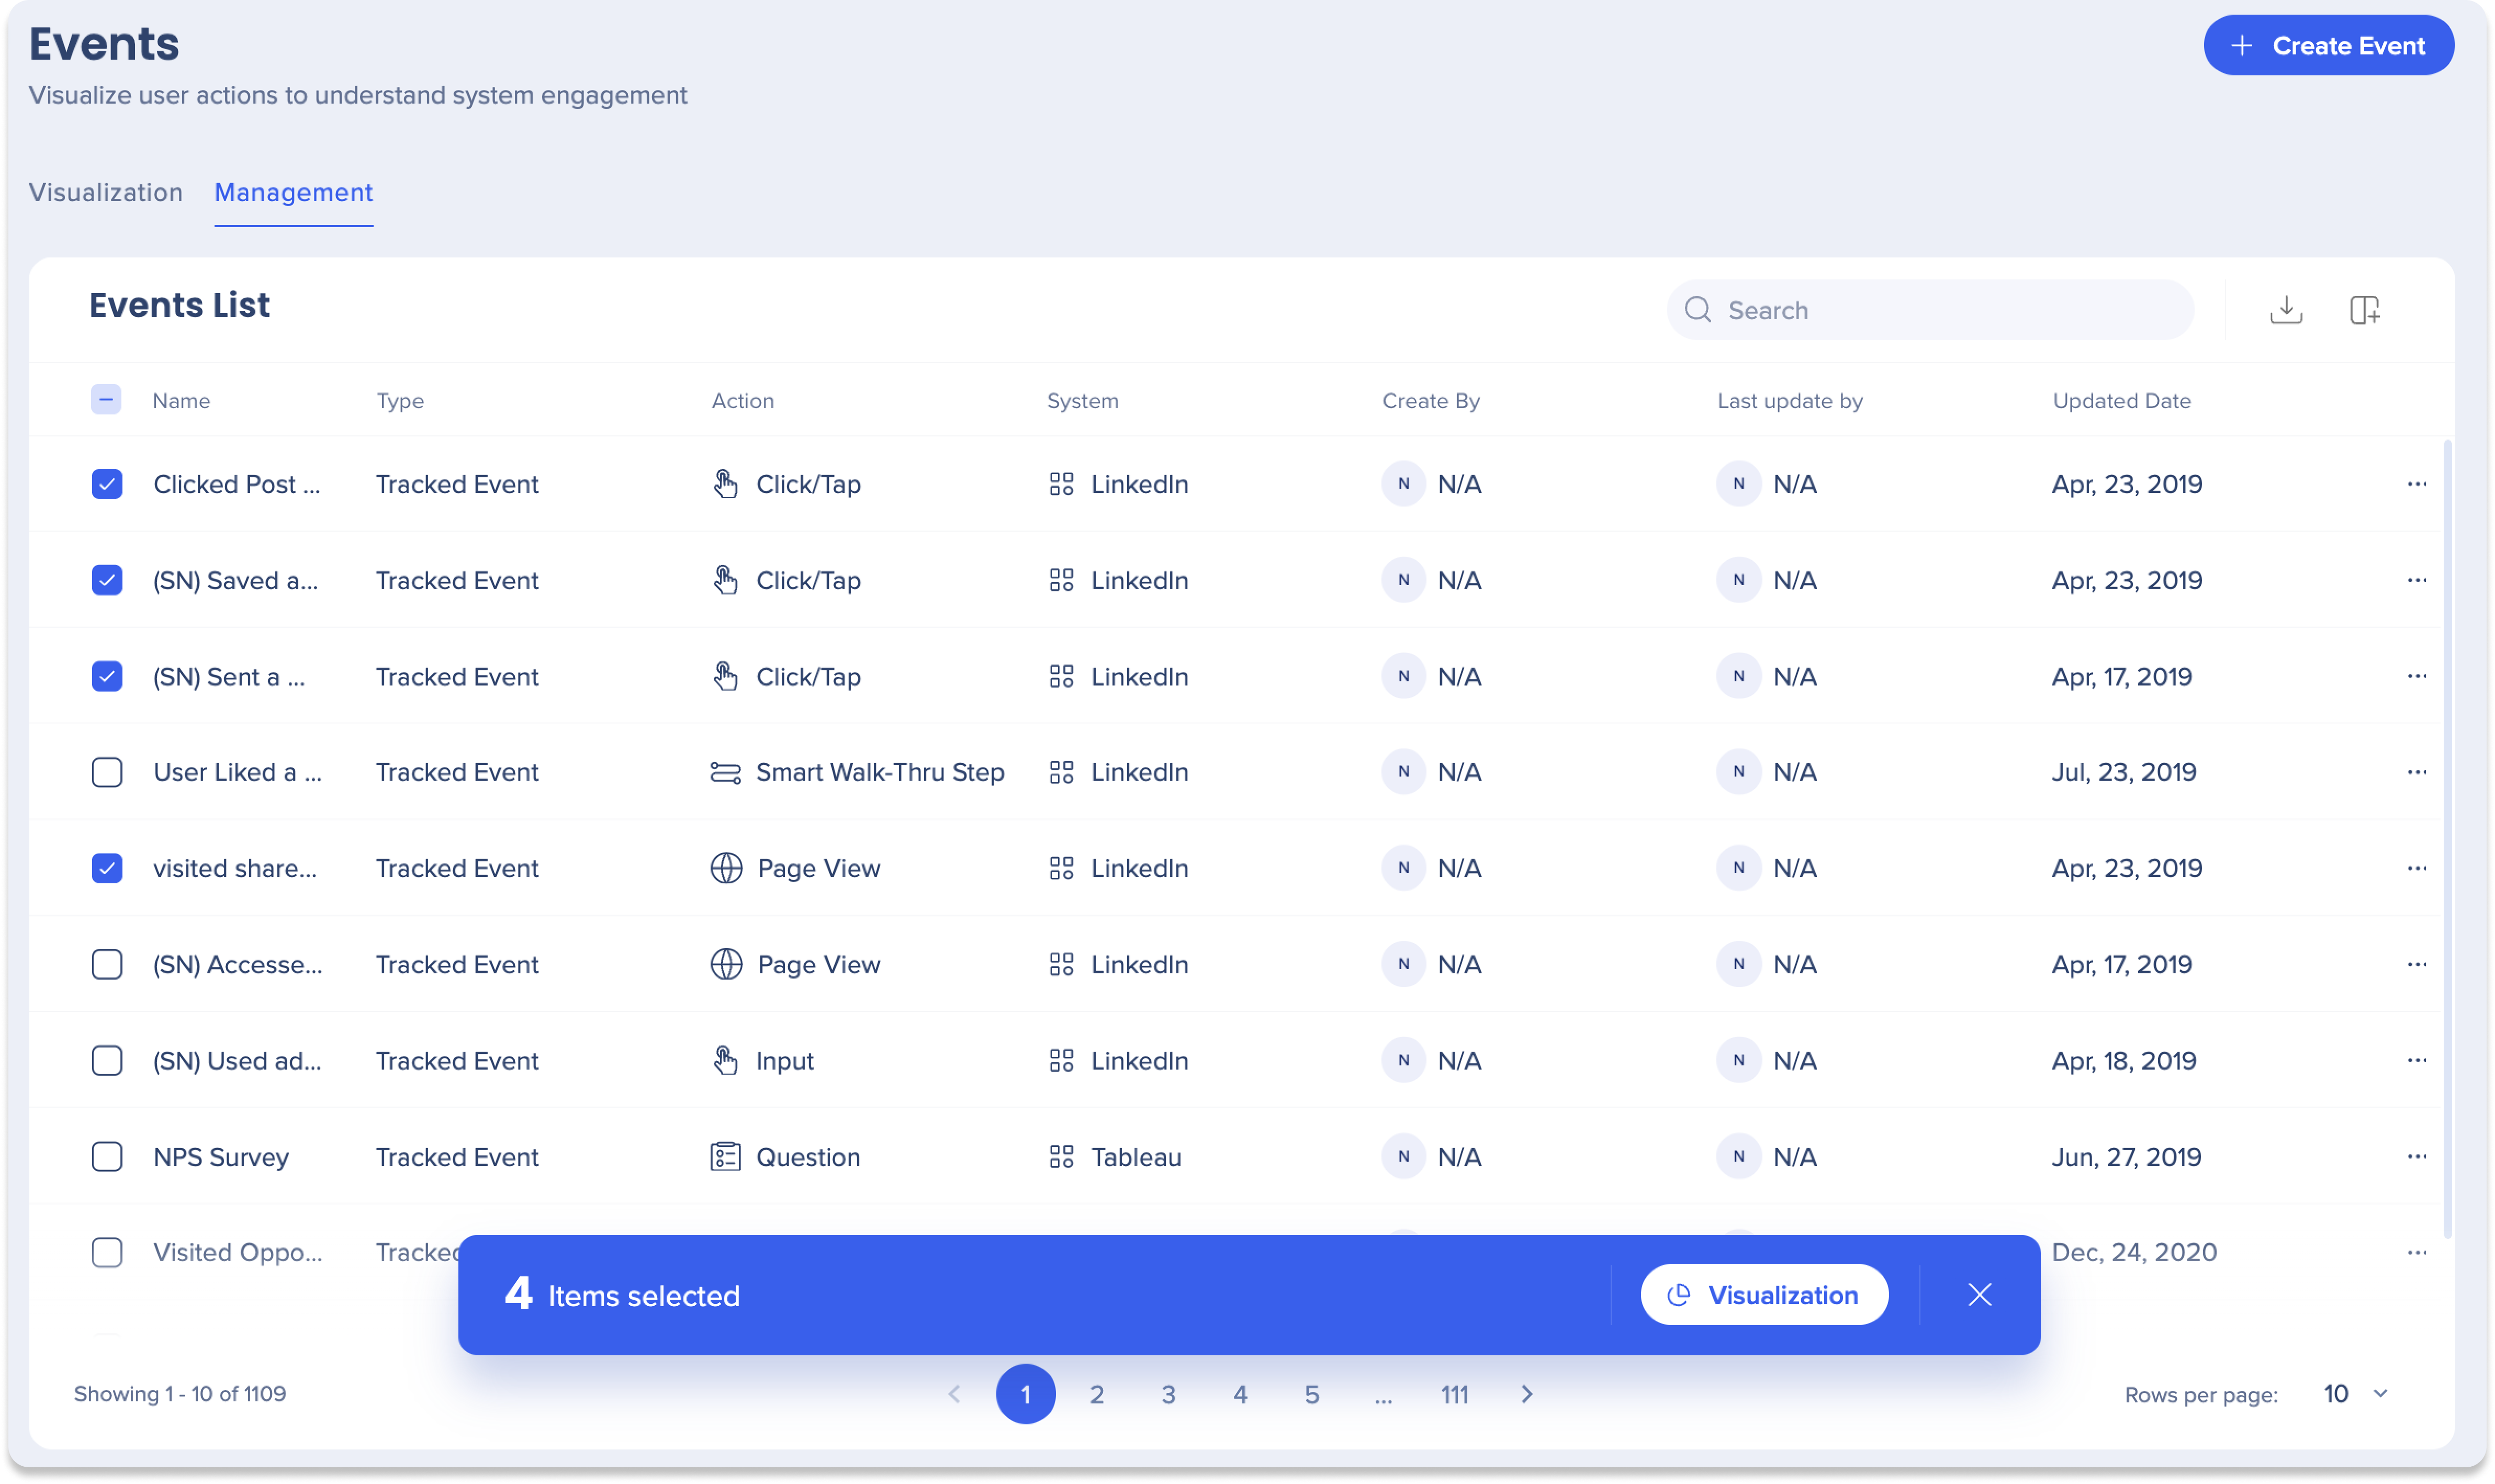
Event Management
Use the Management tab to view and manage all Tracked Events and Engaged Elements in your organization.
From this tab, you can:
- Search for specific events or associated data
- Export the Events list to a CSV or XLSX file
- Manage columns to control which fields appear in the table
- Edit, duplicate, or delete individual events
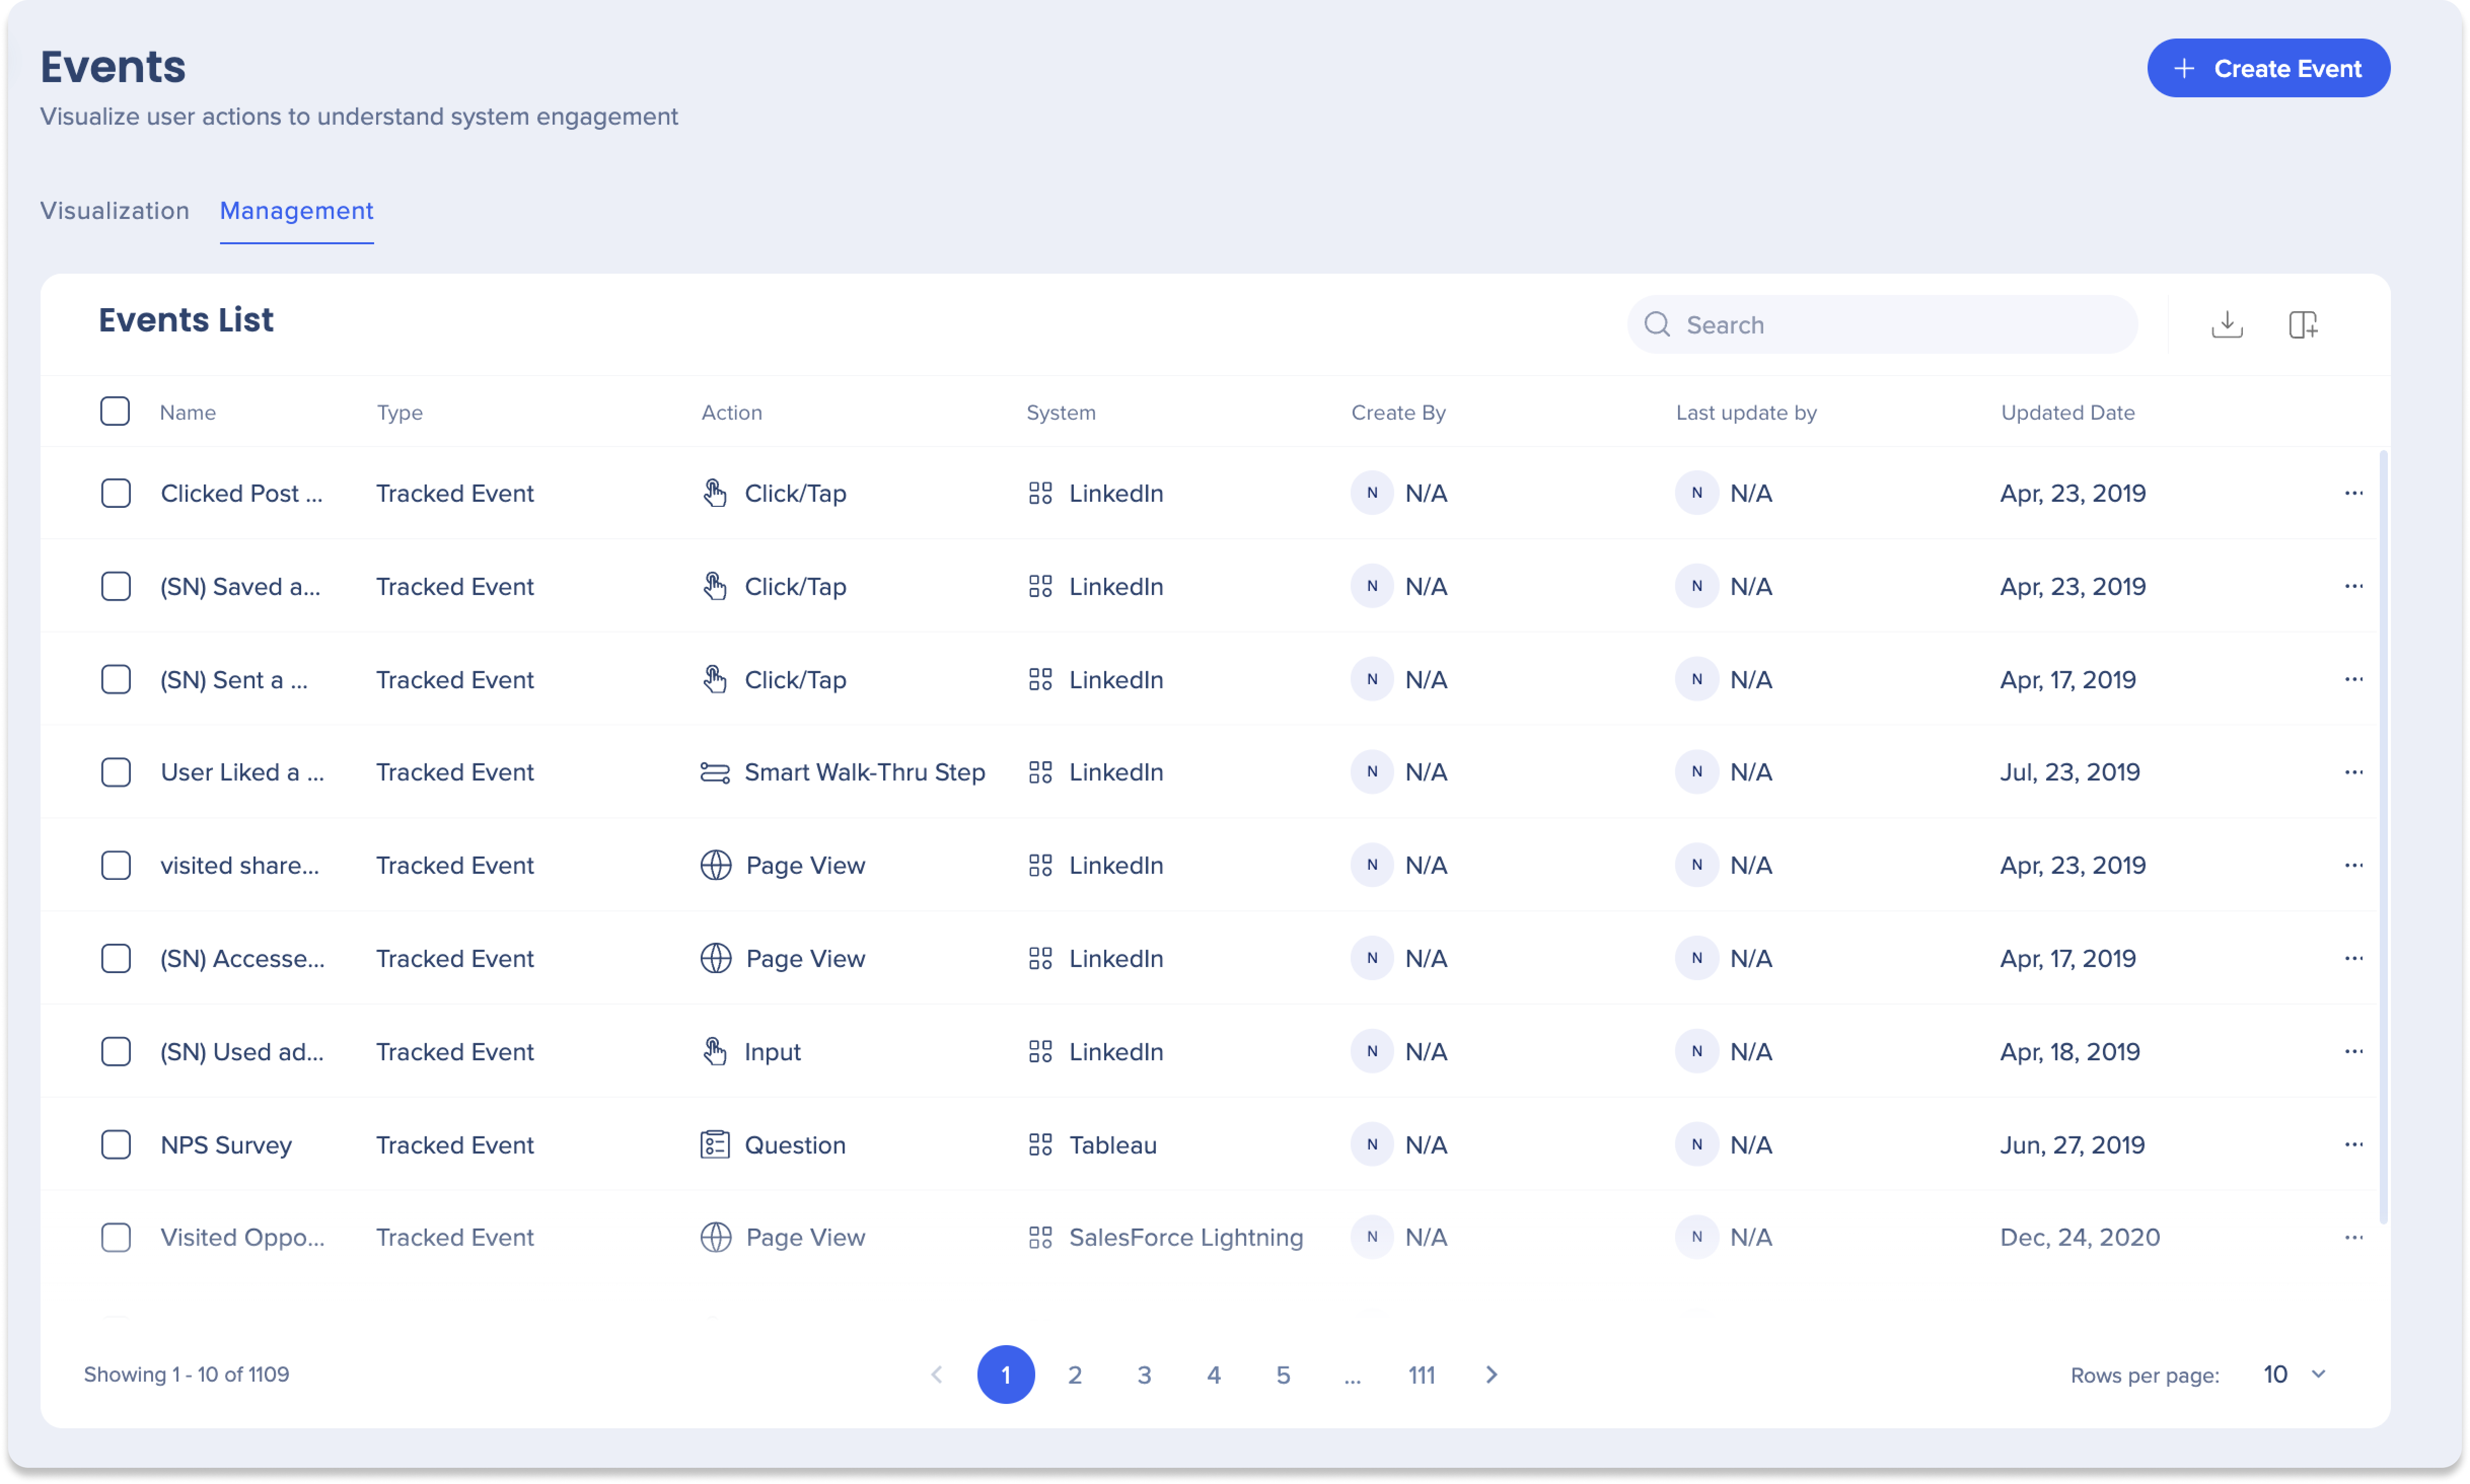
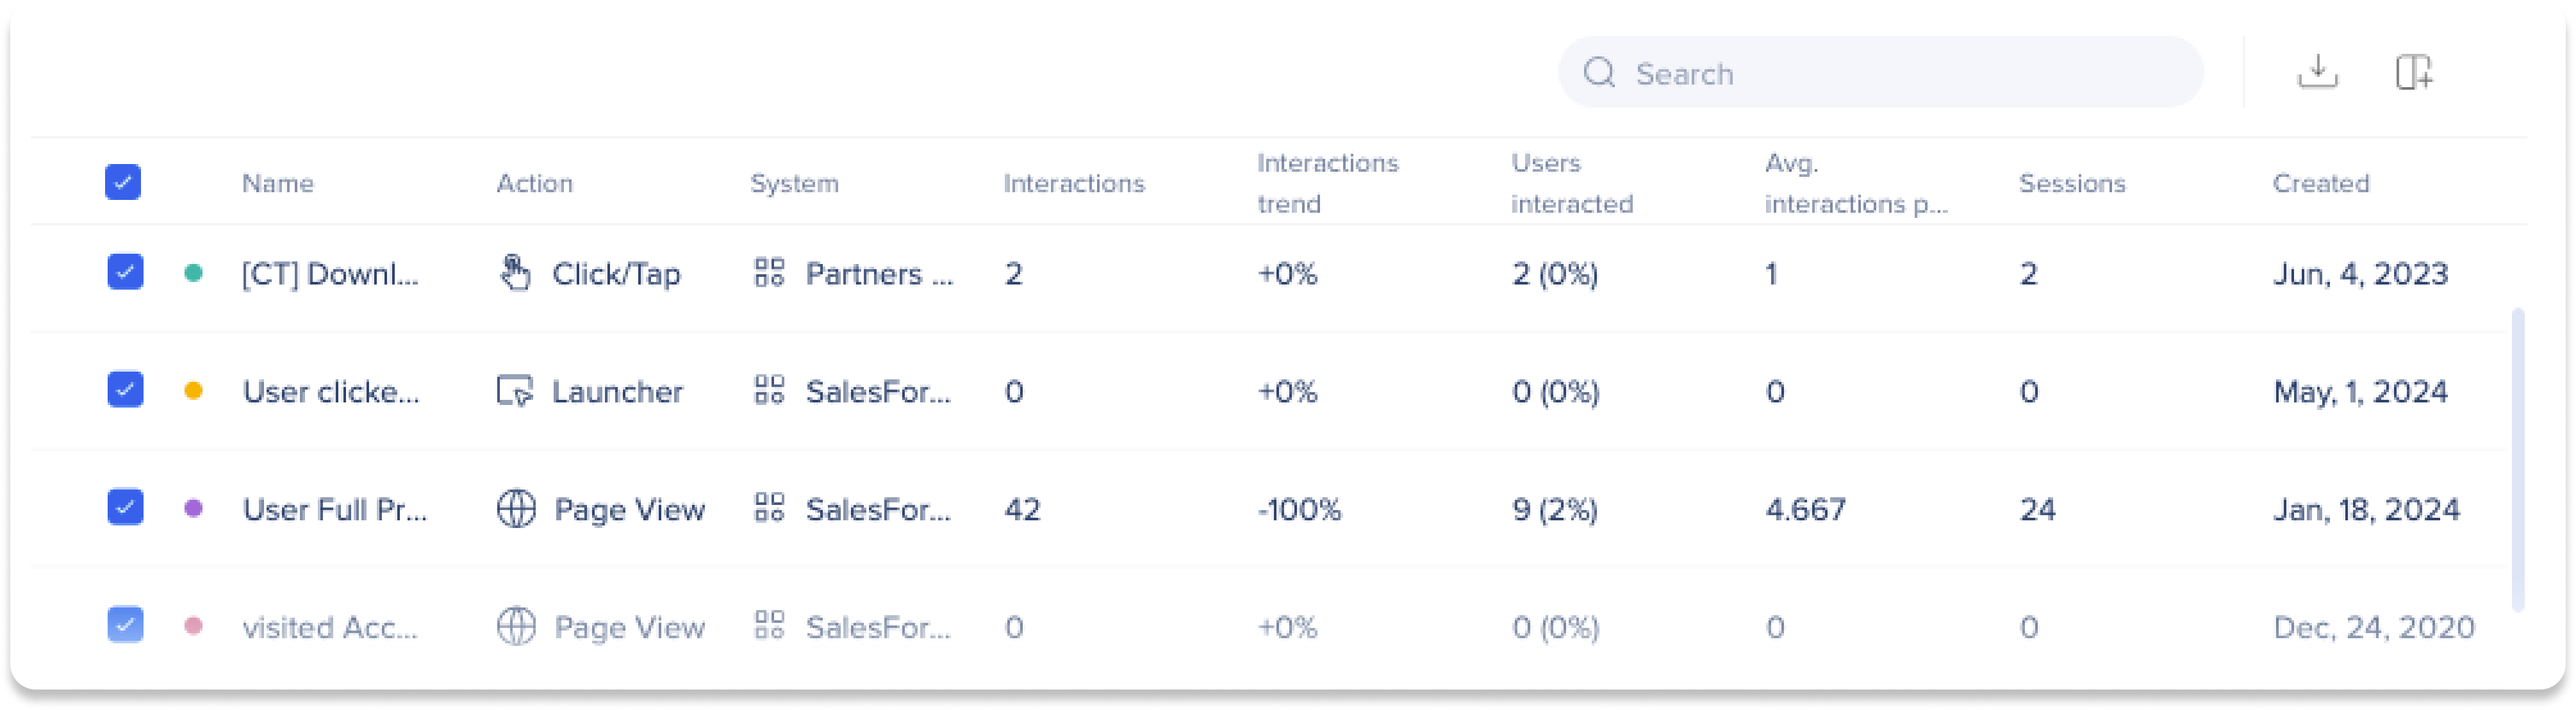
Events List
The Events list displays all events with the following details:
- Name: Event name
- Type: Engaged Element or Tracked Event
- Action: Tracked interaction
- System: System where the event is tracked
- Created by: Event creator
- Last updated by: Last editor
- Updated date: Most recent update
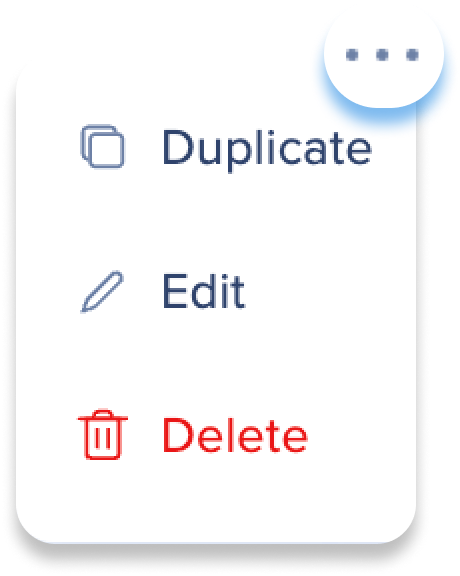
Use the Options menu to manage individual events:
- Duplicate: Make a copy of an event
- Edit: Make changes to an event
- Delete: Remove an event from the list
Add to visualization
Select one or more events and choose Visualization to add them to the Visualization tab's graph and table.
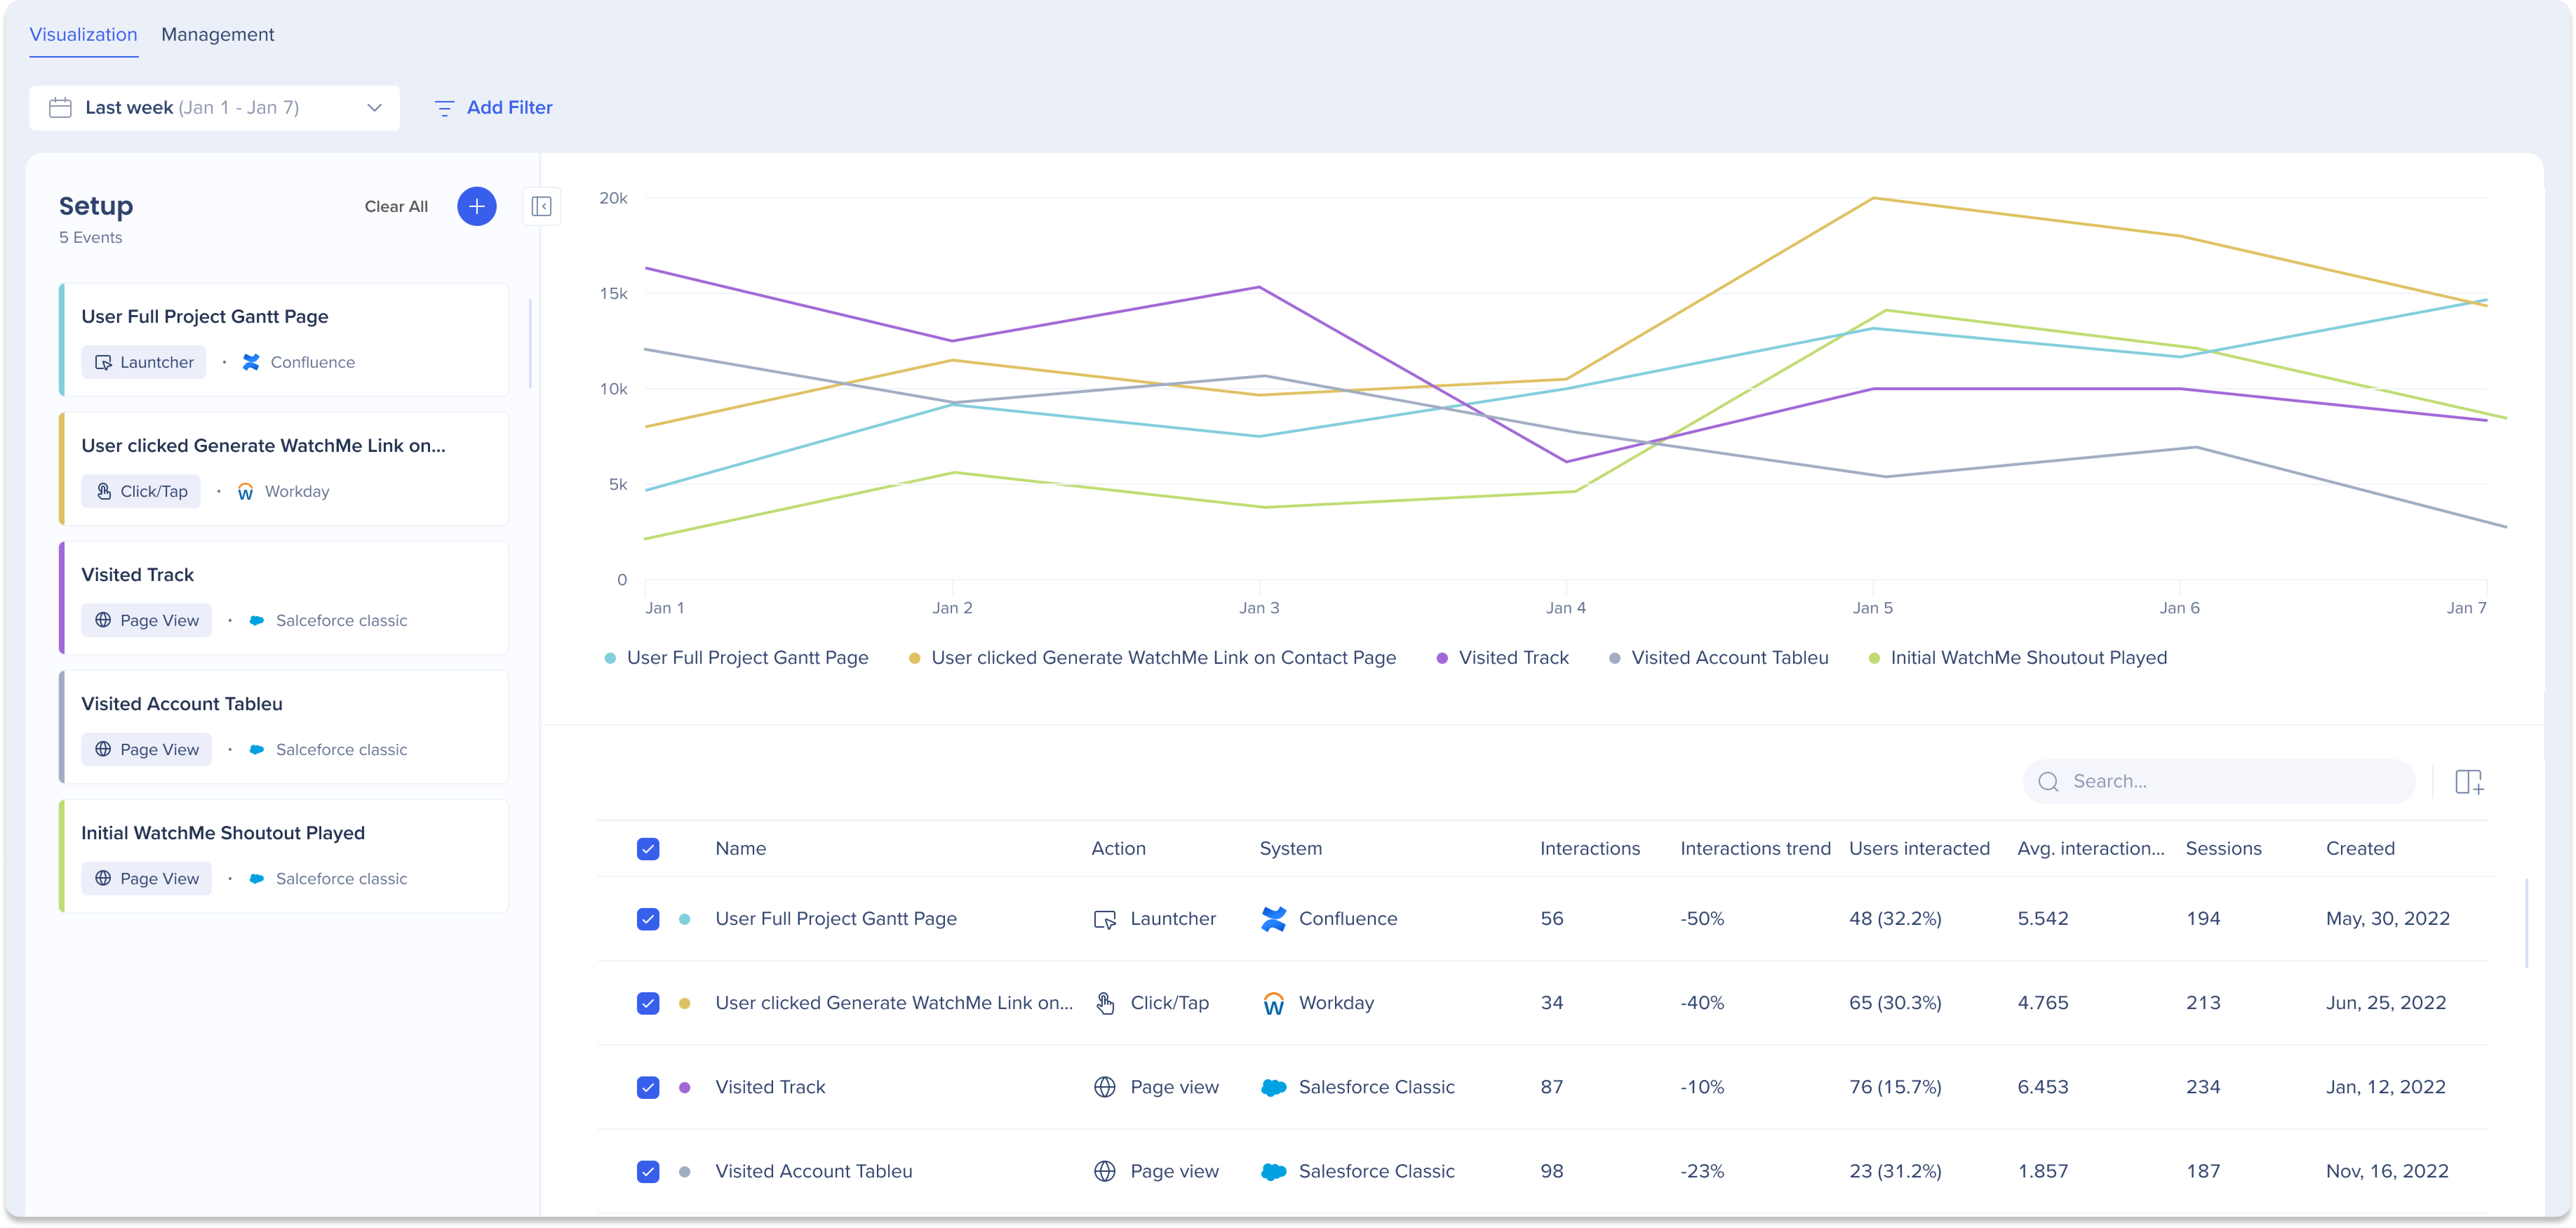
Event Visualization
Use the Visualization tab to analyze up to 20 events at a time using a line graph and data table.
From this tab, you can:
- Add events to the visualization
- Filter events by type, system, or action
- Adjust the date range to analyze trends over time
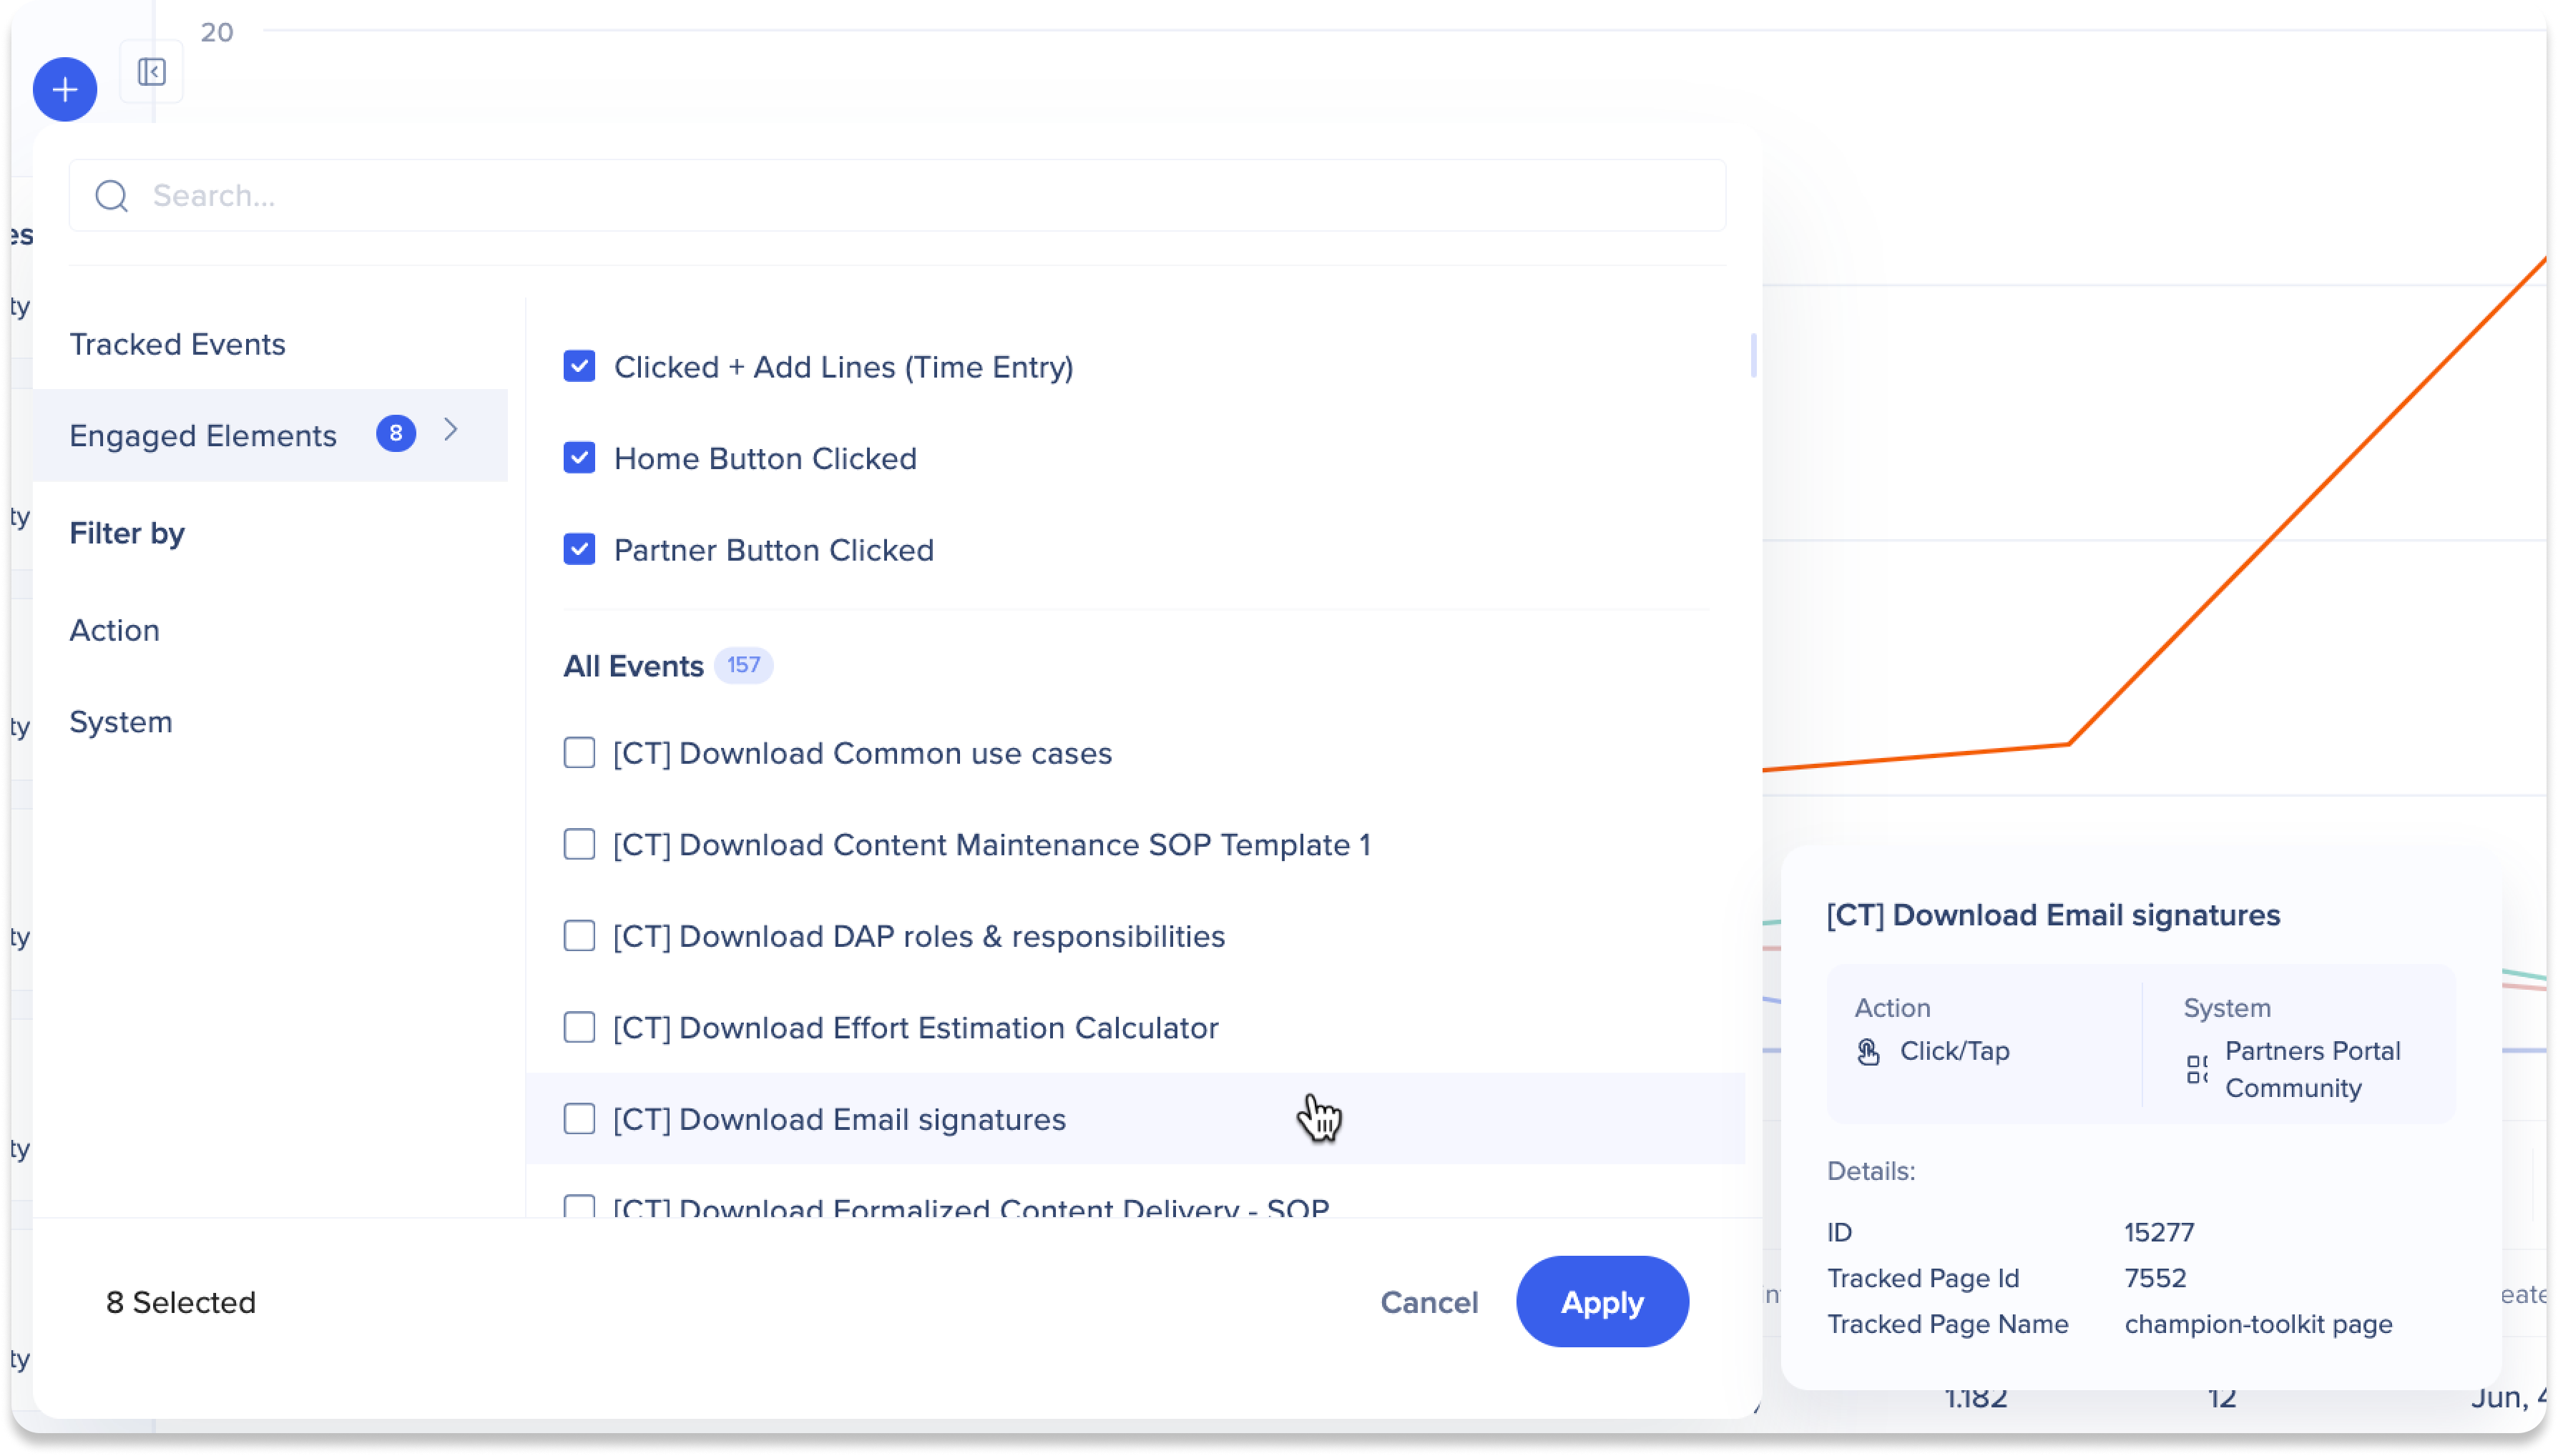
Add events to a visualization
-
Select Create 
-
Choose either Tracked Events or Engaged Elements
-
Select the events you want to add to analyze
-
Select Apply
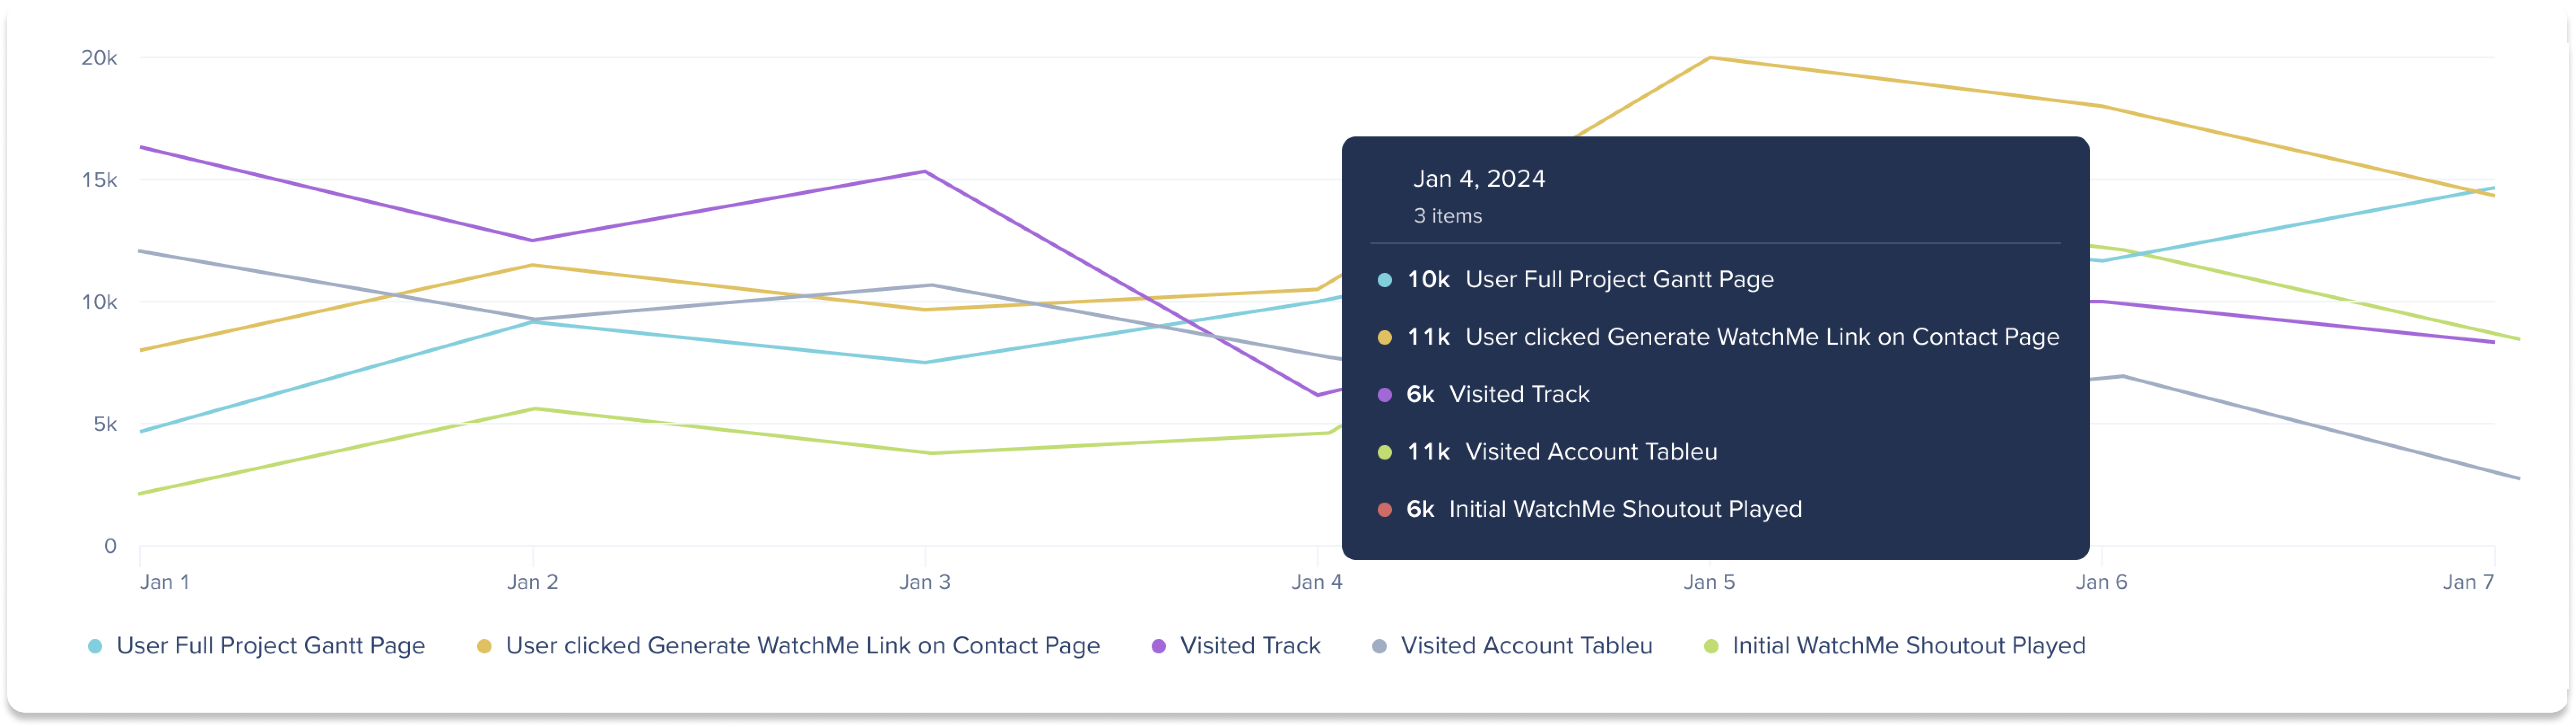
Line graph
The line graph provides a visual comparison of event trends:
- Each color represents a different event
- The X-axis shows the selected date range
- The Y-axis shows the selected metric
Hover over the graph or an event to view additional details.
Data table
The data table provides detailed metrics for each event in the visualization, including:
- Name: The name of the created event
- Action: The tracked action associated with the event
- System: The system on which the event was created
- Interactions: The number of times the event occurred
- Interactions trend: The ratio between end date and start date
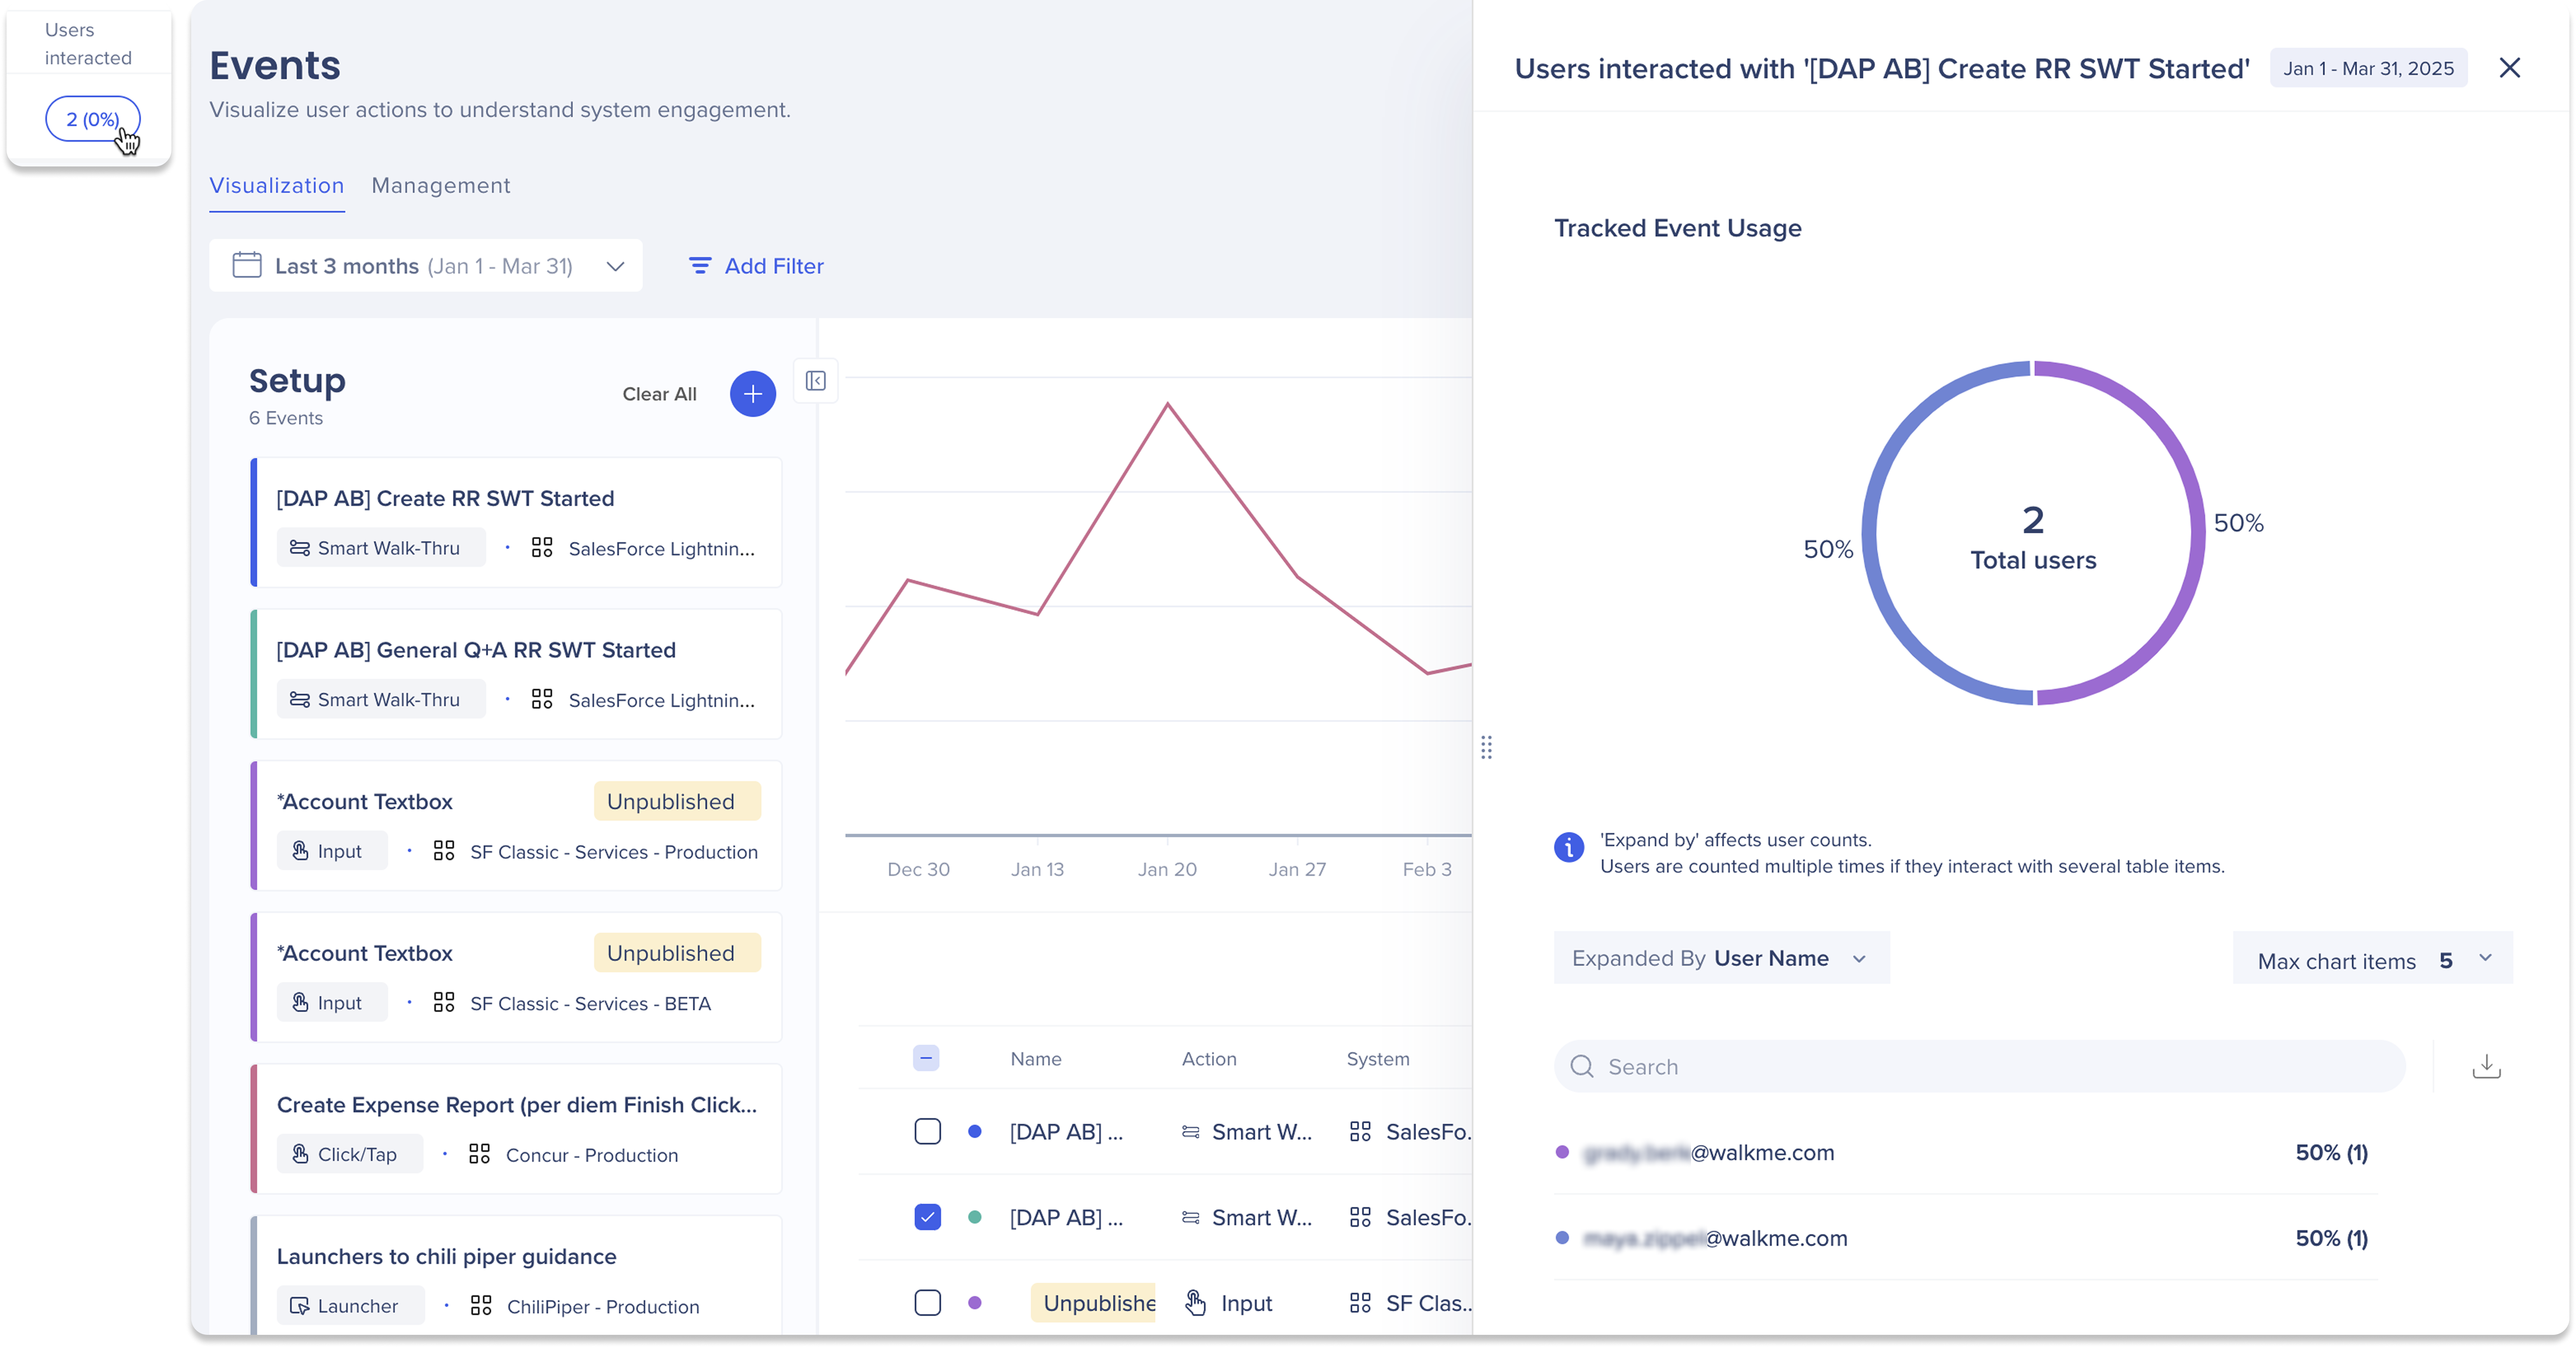
- Users interacted: The total number of unique users who interacted with the event
- The percentage is the total number of interacted unique users (in the selected time/filter range) divided by total active users (in the selected time/filter range)
- Avg. Interactions per user: The average interactions per unique user
- Sessions: The total number of sessions
- Created: Date the event was created
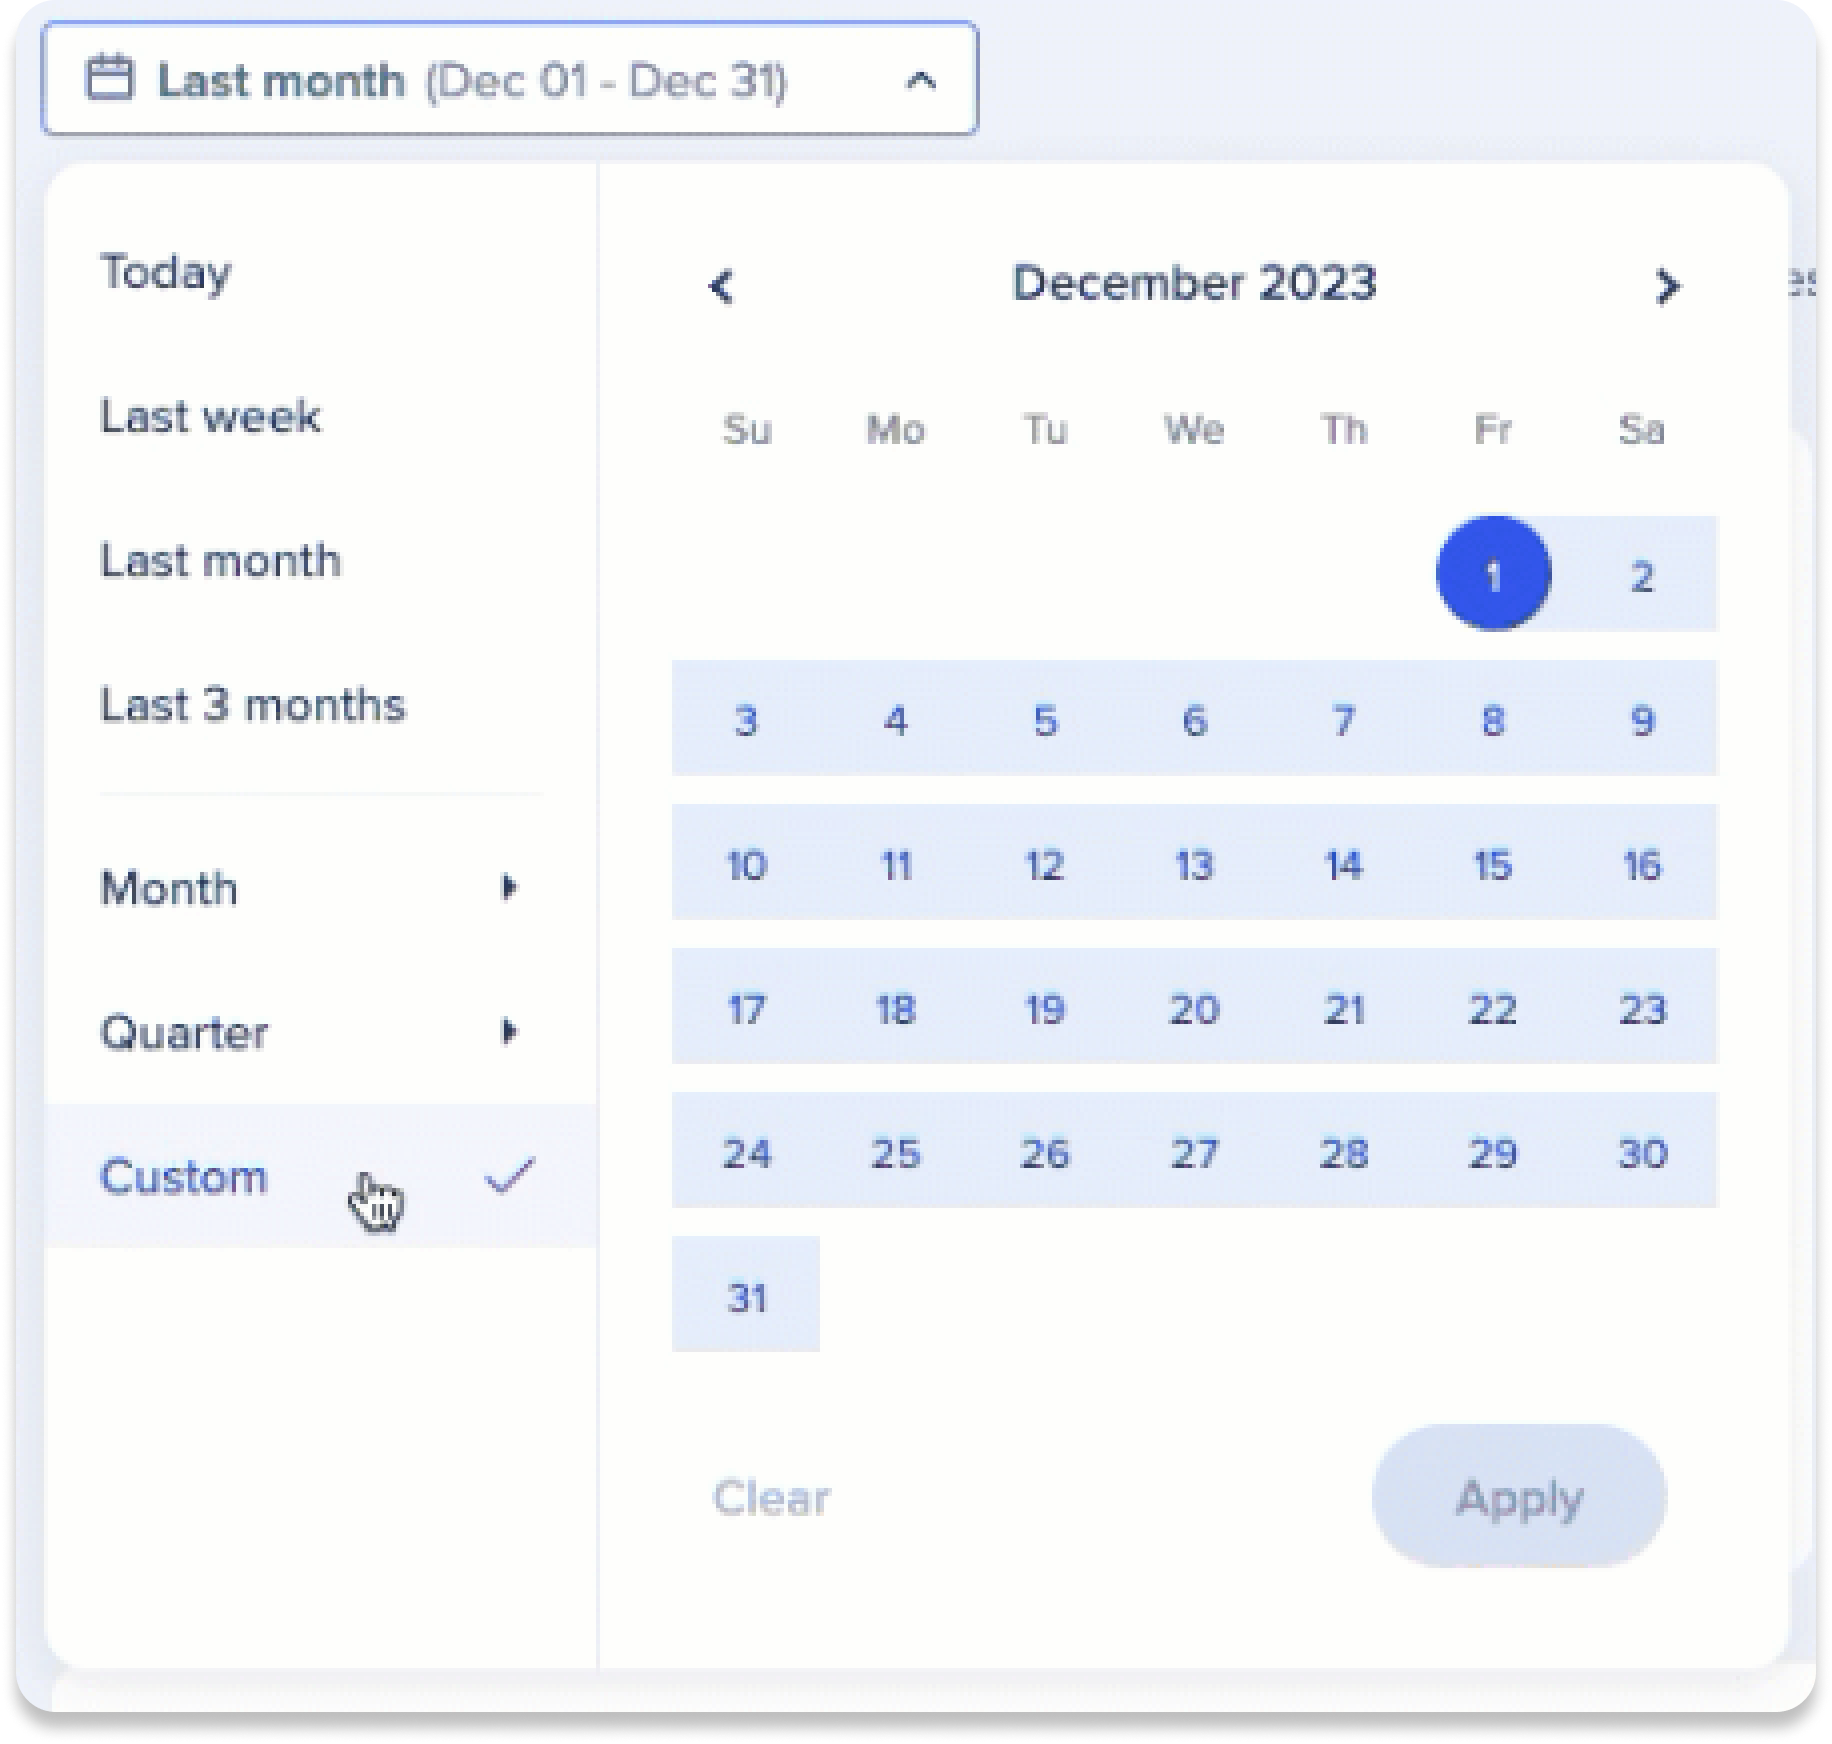
Date ranges & filters
Date range selector
Use the date range selector to view event data over a specific time period, including predefined ranges or a custom date range.
Available date options...
-
Today: This filter shows data from the current day
-
Last week: This filter shows data from the previous week (mon-sun)
-
Last month: This filter shows data for the previous month
-
Last three months: This filter shows data for the last three months
-
Month: This filter shows data from the selected month and year
-
Quarter: This filter shows data from the selected quarter and year
-
Custom: This filter allows you to select a custom date range to view data
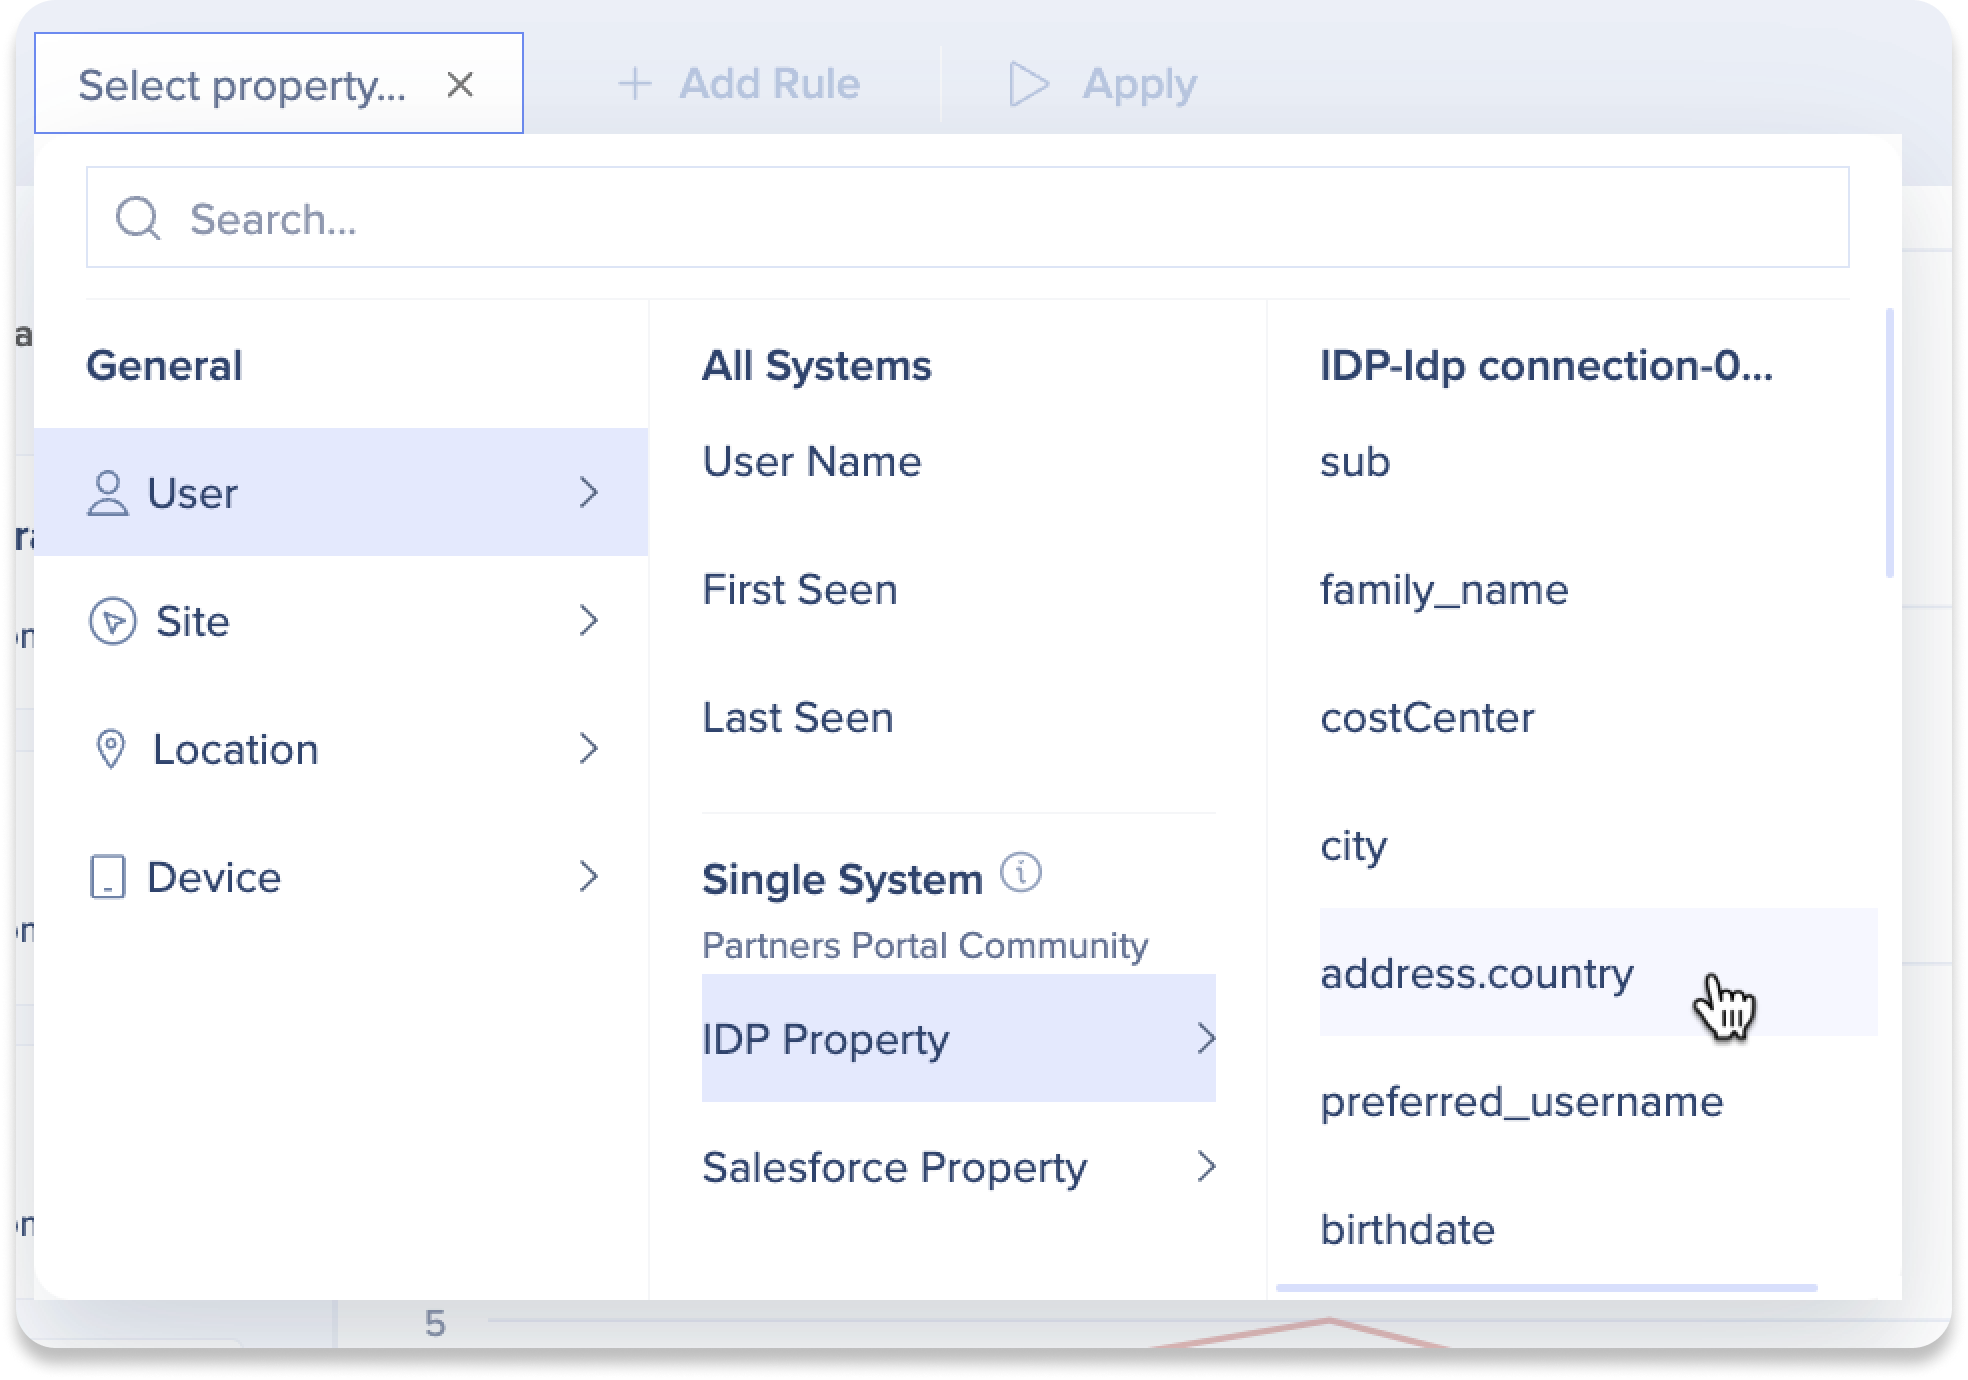
Filters
Use filters to narrow the dataset and focus on specific events, systems, actions, or user segments.
Data Filtering
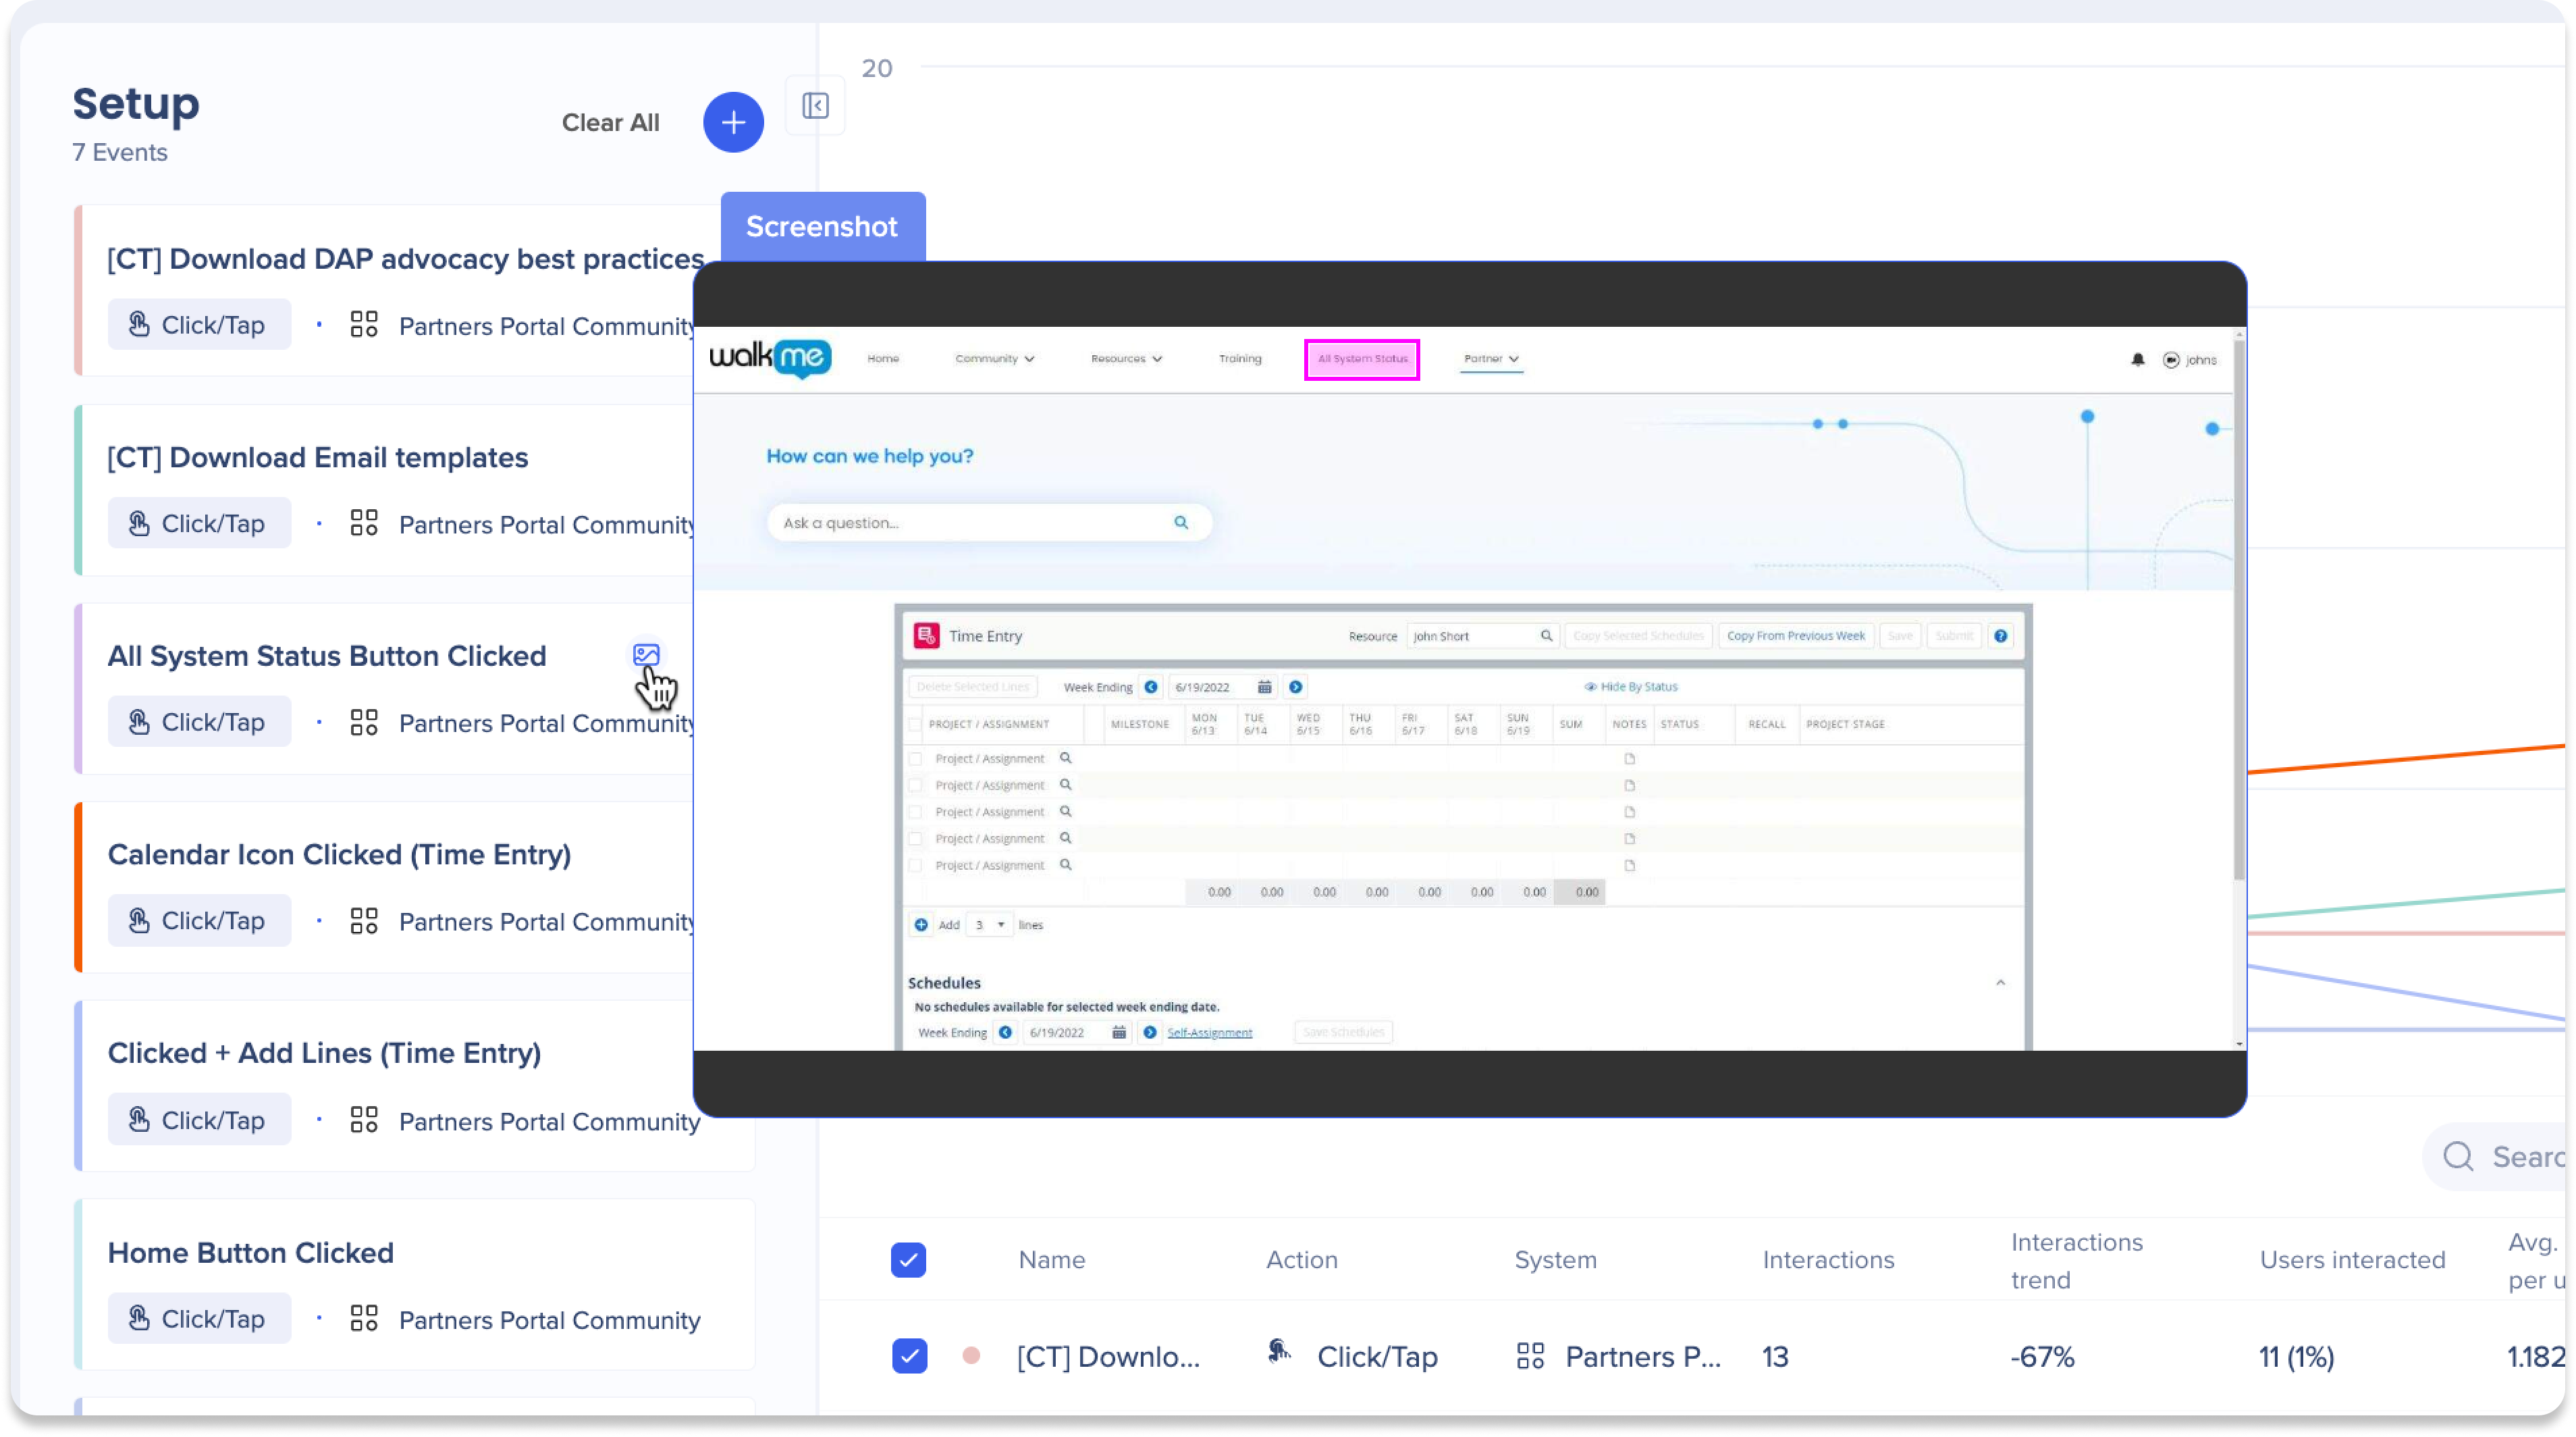
View screenshots of engaged elements
Screenshots are available only for Engaged Elements and help you identify captured elements directly from the Events page.
- Hover over an event in the Setup side panel
- Hover over the screenshot icon

- The element will be highlighted in pink
Users list
Select the user count under Users interacted to view a list of users who interacted with the event and explore related attributes.
How to Create Events
Choose the article below based on the type of event you want to create:
Create Engaged Elements
Learn how to capture on-screen elements in the WalkMe Editor to track user interactions accurately and securely.
How to Create Engaged Elements
Create Tracked Events
Learn how to create Tracked Events using manual setup or capture to measure key user actions, process completion, and page visits.
How to Create Tracked Events
Technical Notes
Prerequisites
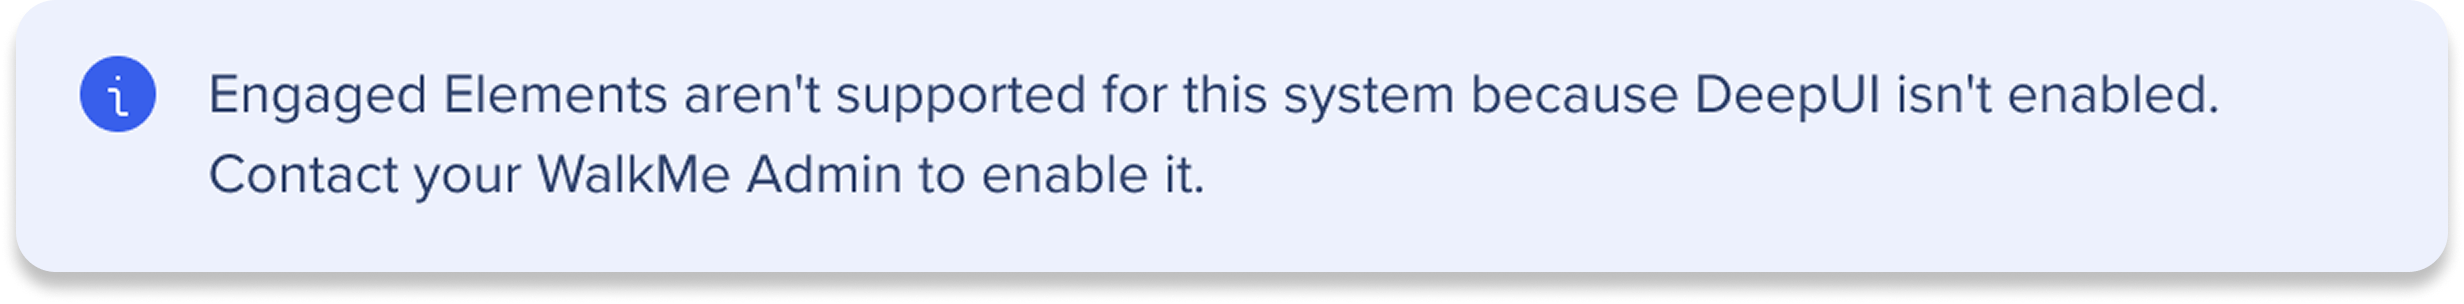
- DeepUI is required for Engaged Elements
- Admin approval may be required
- Users must have access to the relevant system
Visualization limits
- A maximum of 20 events can be visualized at one time
- The Contains operator can only be used in User Name and Integration Properties filters and may impact performance on large datasets
- Use integration filters only when events match the same system
Capture and support
- Latest editor extension required for Tracked Event capture
- Screenshots are supported only for Engaged Elements
- Insights officially supports Chrome
- Desktop and mobile systems are not supported
- Mobile web data is not supported
- Action Bot, Quiz and TeachMe are not supported
- Created by and Updated by columns are not supported for Tracked Events


