Set up your system so Insights can track accurate, user-level data from day one. This foundation determines the quality of every report, funnel, or dashboard you'll build later. UUID is set up by users with Admin permissions when they configure their system before WalkMe content is published. It is configured per system, not per account.
Step 1: Select how you will identify users (UUID)
The UUID (Unique User Identifier) tells WalkMe who is doing what-it's the foundation of all user-level analytics in WalkMe Insights, ensuring every click, play, and goal completion is tied back to a real user. Without a UUID, WalkMe assigns a new ID each time a user enters the system, creating duplicates in Insights and breaking Onboarding and Goal continuity.
For example:
- Without a UUID: A Smart Walk-Thru shows 100 plays, but Insights can't tell whether this represents 100 unique users or repeated plays by the same few users. There's no visibility into who completed the Smart Walk-Thru or who dropped off. Each time a user enters the system-even if they're returning-they're assigned a new ID since there's no method to track unique users. This leads to inflated metrics and inaccurate Insights data.
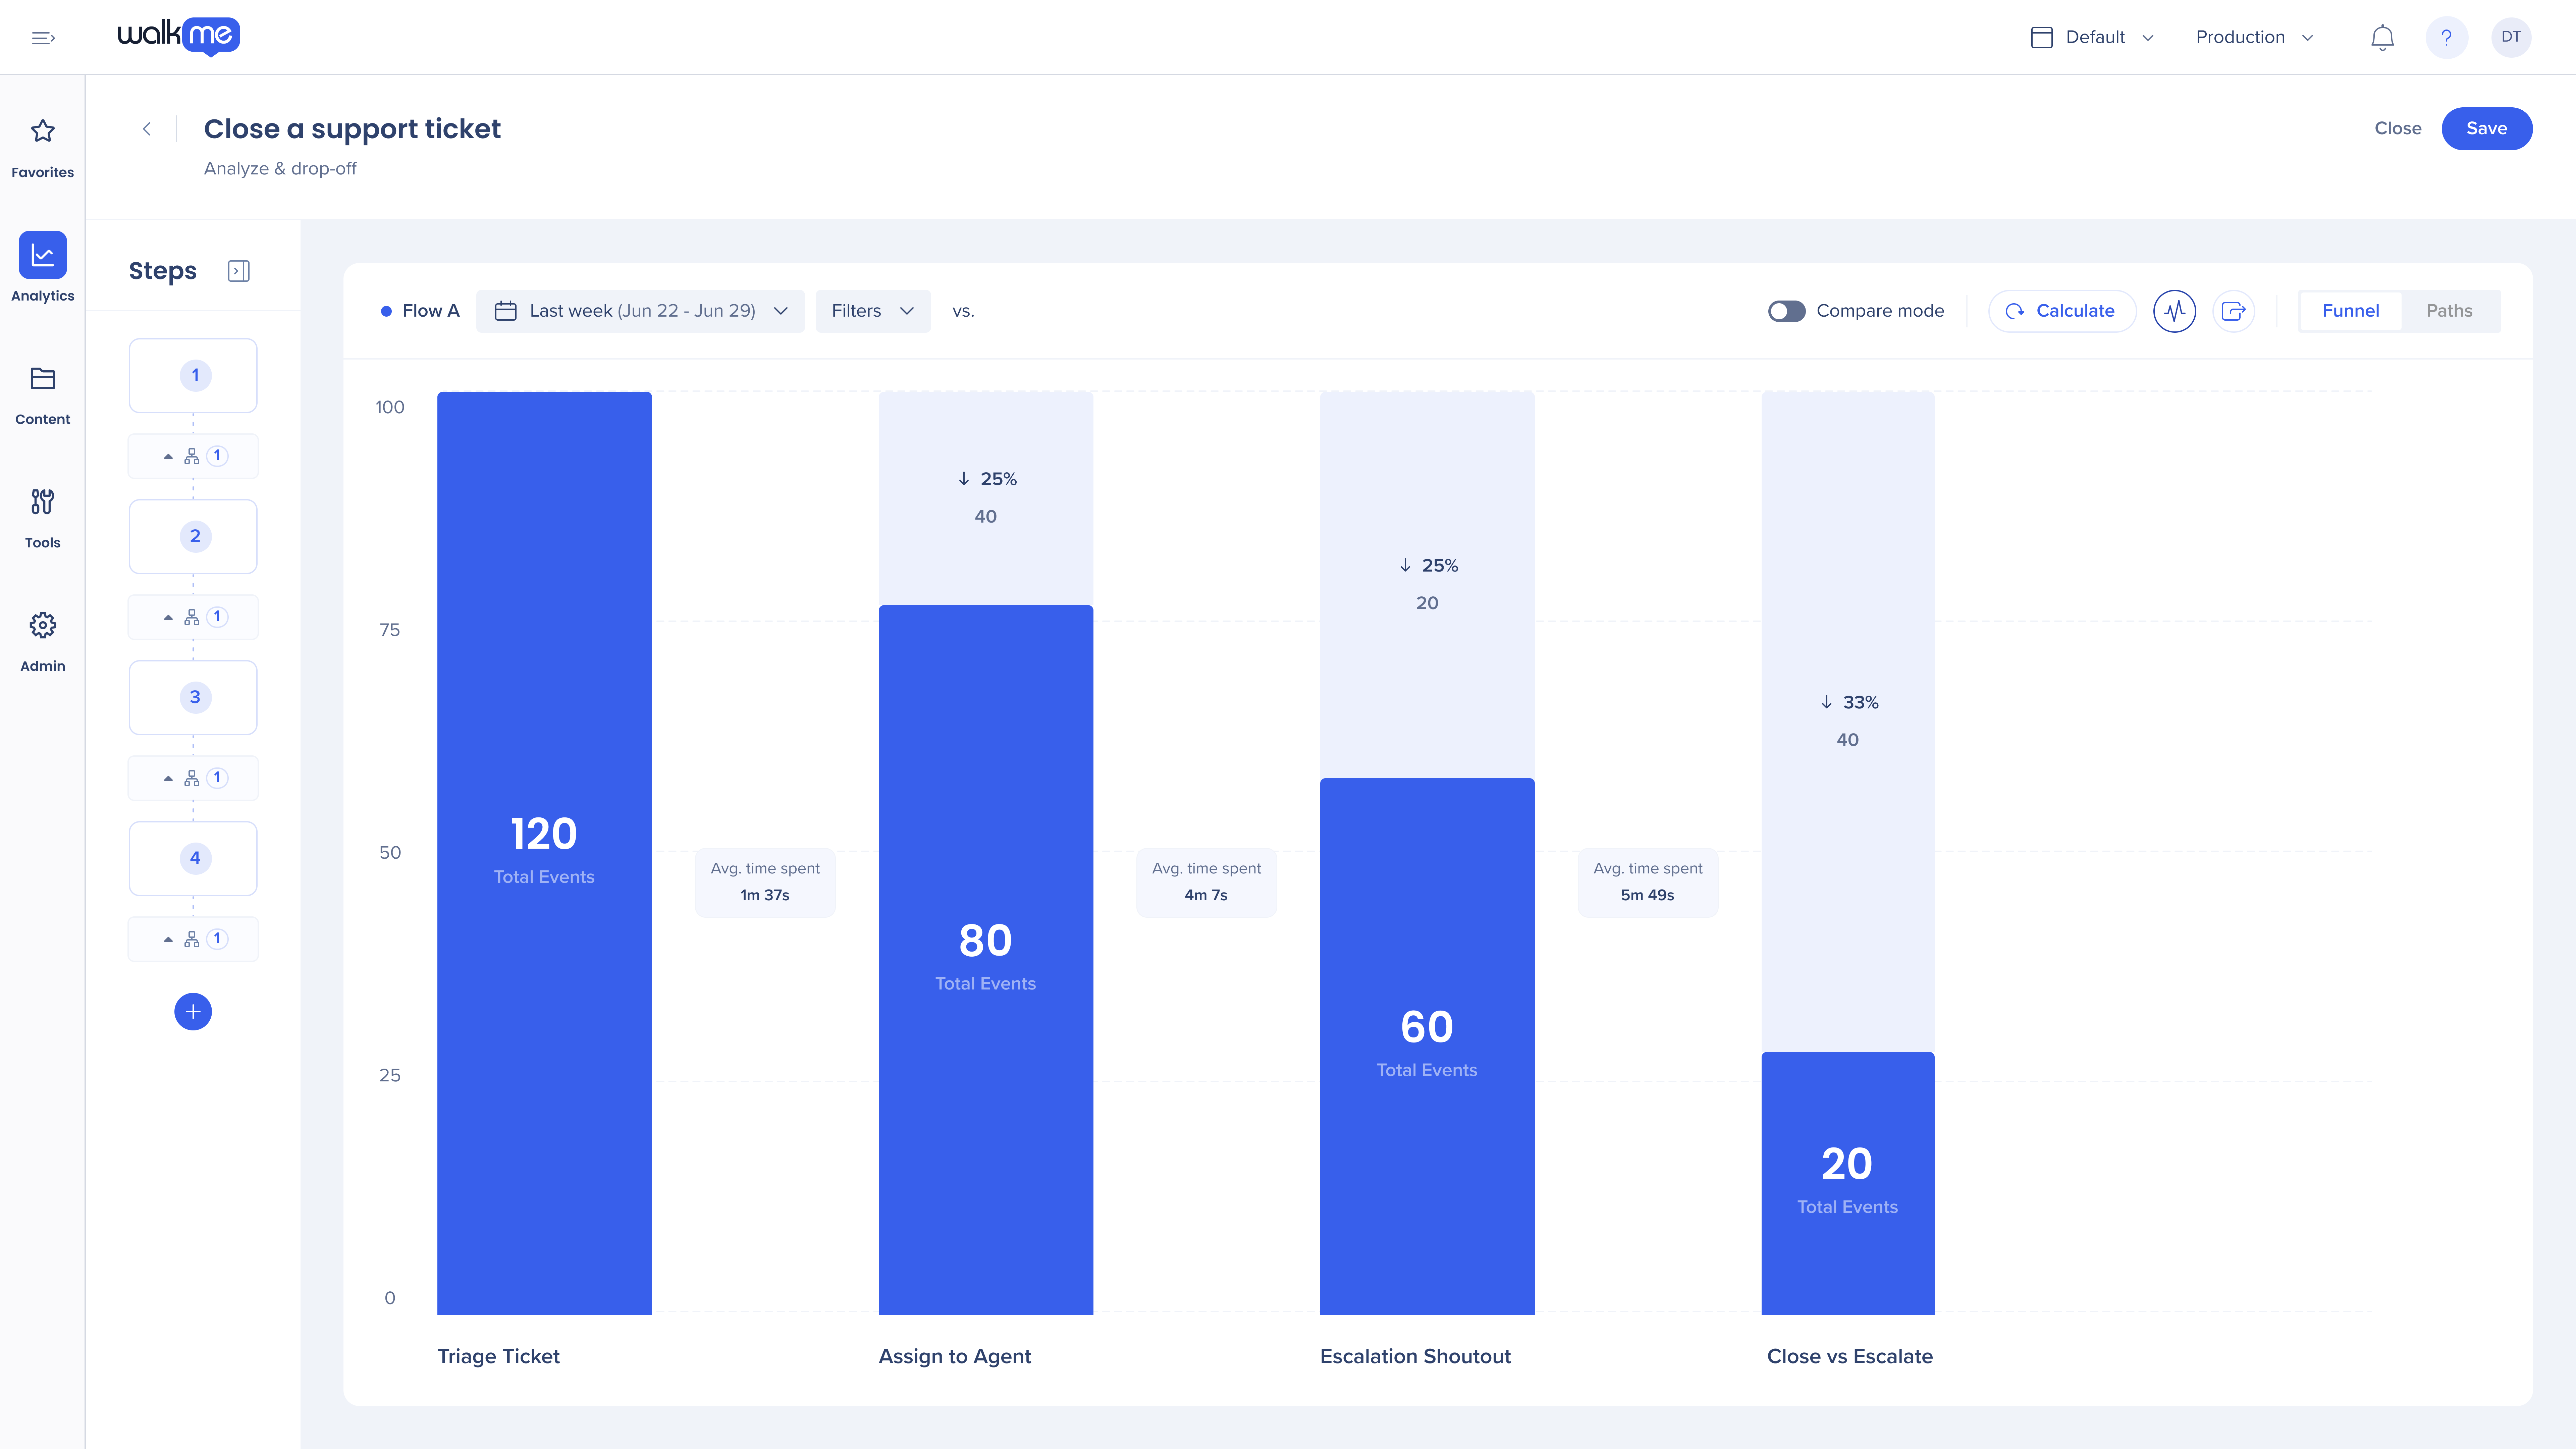
- With a UUID: Insights shows 75 unique users started the Walk-Thru; 45 completed it and 30 dropped off. You can see which users did not finish and exactly where they dropped off in the Smart Walk-Thru.
It's a recommended best practice to choose one consistent UUID method across all your environments. While several options are available, we recommend using an IDP integration for internal applications and a variable for customer-facing applications for the most accurate, persistent user tracking. If your organization requires an additional layer of security, you can request to have your UUID hashed.
UUID Type
Best For
Why Use It
IDP (SSO Integration)
RECOMMENDED
Internal applications
Most reliable; identifies users via your identity provider (e.g., Okta, AzureAD).
Variable
RECOMMENDED
Customer-facing applications
Uses a variable (like window.userId) for accurate, persistent tracking.
WalkMe ID
NOT RECOMMENDED
Testing only
Quick setup for testing or sandbox environments. Not recommended for production - the ID is not persistent and resets when cookies are cleared or a new browser is used, recording one returning user as multiple new users which can skew Insights data.
- Choose a stable, consistent UUID method from day one (IDP for internal applications, variable for customer-facing sites).
- Validate UUIDs appear consistently in Insights user page (no duplicates).
- Publish after changing data settings.
DO NOT
- Leave UUID blank or rely on WalkMe ID this will reset with every cleared cookie or new browser.
- Change your UUID configuration after deploying content unless you are upgrading to a more reliable method (IDP or variable). Changing UUIDS breaks historical continuity and resets user-level analytics.
Here are a few additional resources to help you set up your UUID: Unique user settings, IDP, Variables, UUID hashing, Roles & permissions.
Step 2: Choose how much data to collect (DXA Level)
WalkMe collects data at three different levels, each offering a deeper view into how users interact with your application and your WalkMe guidance. Together, these levels help you move from simply counting interactions to truly understanding user behavior, identifying friction, and measuring impact. DXA (Digital Experience Analytics) determines how much user-behavior data WalkMe collects beyond WalkMe engagement analytics. Different DXA levels offer different levels of visibility into how users interact with your website or application.
Data Collection Level
What It Tracks
Use It When You Want To...
How To Enable:
Engagement Analytics (Default)
WalkMe content interactions only
Measure how users engage with WalkMe content (plays, completions, steps, and goals.
Enabled by default.
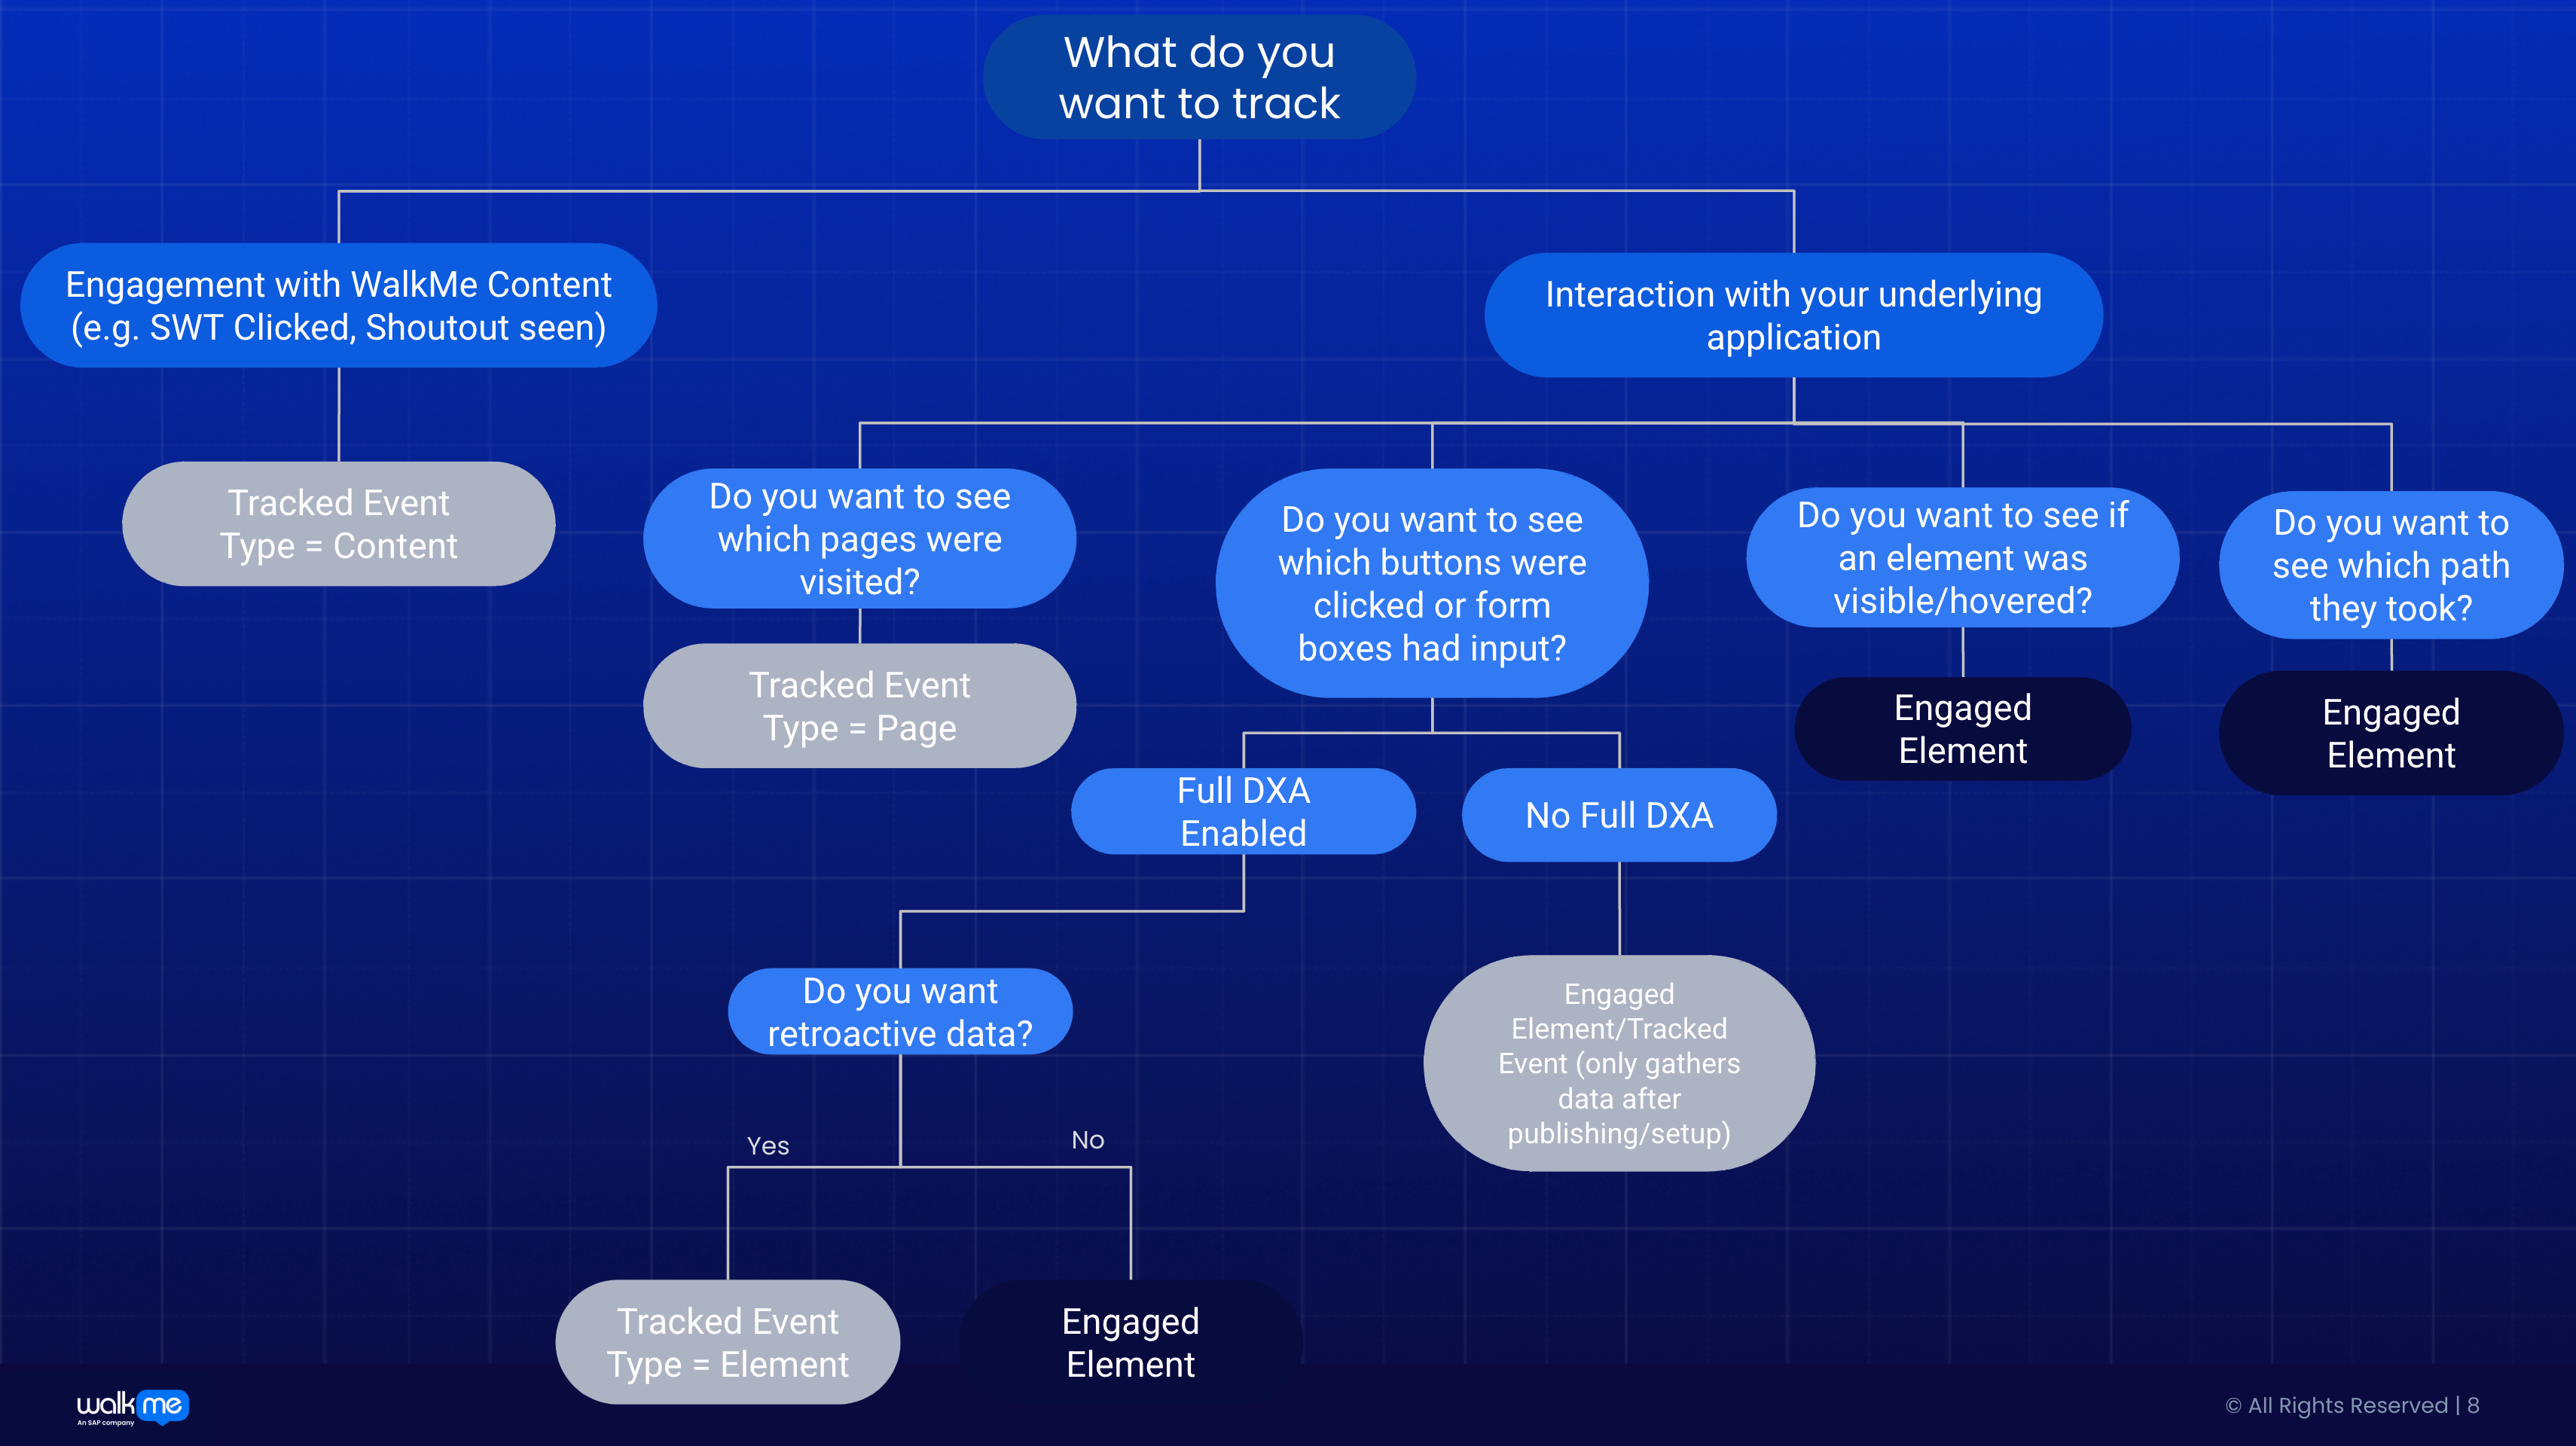
Targeted DXA
Tracked Events you define, plus sampled behavioral data (1 out of ~100 interactions) that helps validate whether relevant user actions are occurring
Focus on key interactions in your application that you define with a Tracked Event (button clicks, field inputs, or page visits) while minimizing data collection.
Ideal when you want control, privacy, and precision as it only collects data that you define through a Tracked Event.
Enabled directly by WalkMe Admins in the Admin Center under Data Settings.
Full DXA
Retroactive user interactions
Full DXA captures every click and input from the moment it's enabled, allowing you to define Tracked Events at any time to access historical data retroactively-up to 12 months back or from when Full DXA was activated, whichever is more recent.
Important note: Full DXA provides extensive raw data, which can be complex and resource-intensive to analyze.
Most customers do not need this level of detail; we recommend Full DXA only for customers with advanced analytics needs and the capacity to handle large datasets.
Full DXA cannot be switched on by Admins - it must be enabled by WalkMe upon request. DXA is enabled per system, not per account.
How to enable: Contact your Account Team with the names of the systems that require Full DXA.
Session Playback
Recreations of real user sessions
Complement your analytics data to recreate how users experienced your application-providing a complete, visual understanding of their interactions.
It's helpful if you need to: Validate behavior patterns observed in Digital Experience Analytics (DXA), Support QA and troubleshooting with visual reproductions of user sessions
Session Playback is an opt-in capability available only to customers who have purchased the WalkMe for Customers package.
How to enable: Check with your Account Team to confirm whether your contract includes WalkMe for Customers.
Governance and censorship controls:
DXA includes governance controls that allow administrators to define what interaction data may be collected. If needed, use Censorship and Privacy settings to restrict the collection of specific elements on your site to align with your organization's security and compliance requirements.
You'll know you're ready to move on when:
- UUID and DXA are configured and validated in the Admin Center.
- You can confirm that data is flowing into Insights (via a simple Tracked Event test).
- Your team understands how much user behavior you're collecting and why.
Here are a few additional resources to help you set up your data collection level: Digital Experience Analytics (DXA), WalkMe Events Settings, Session Playback.