Brief Overview
WalkMe Reports is a central hub in the WalkMe Console where you can conveniently review, export, and subscribe to reports. Whether you're monitoring multi-system usage at the account level or tracking single-system usage, reports provide the comprehensive insights you need to optimize your user experience.
Filter reports by environment (like production, test, or custom), subscribe to receive them by email at set intervals, and customize them by role or timeframe.

Use Cases
- Analyze your Insights data in a raw format or using external tools
- Share Insights reports with people who don't have access to Insights
- Schedule periodic updates on your KPIs without having to search and filter in Insights manually
Access
Access reports in the console:
- Open the WalkMe Console
- Go to the Analytics category
- Select Reports
How It Works
The Reports app has two pages:
Report Gallery
The Report Gallery page in the Insights Console displays a list of all the available reports in your account that you can export and subscribe to.
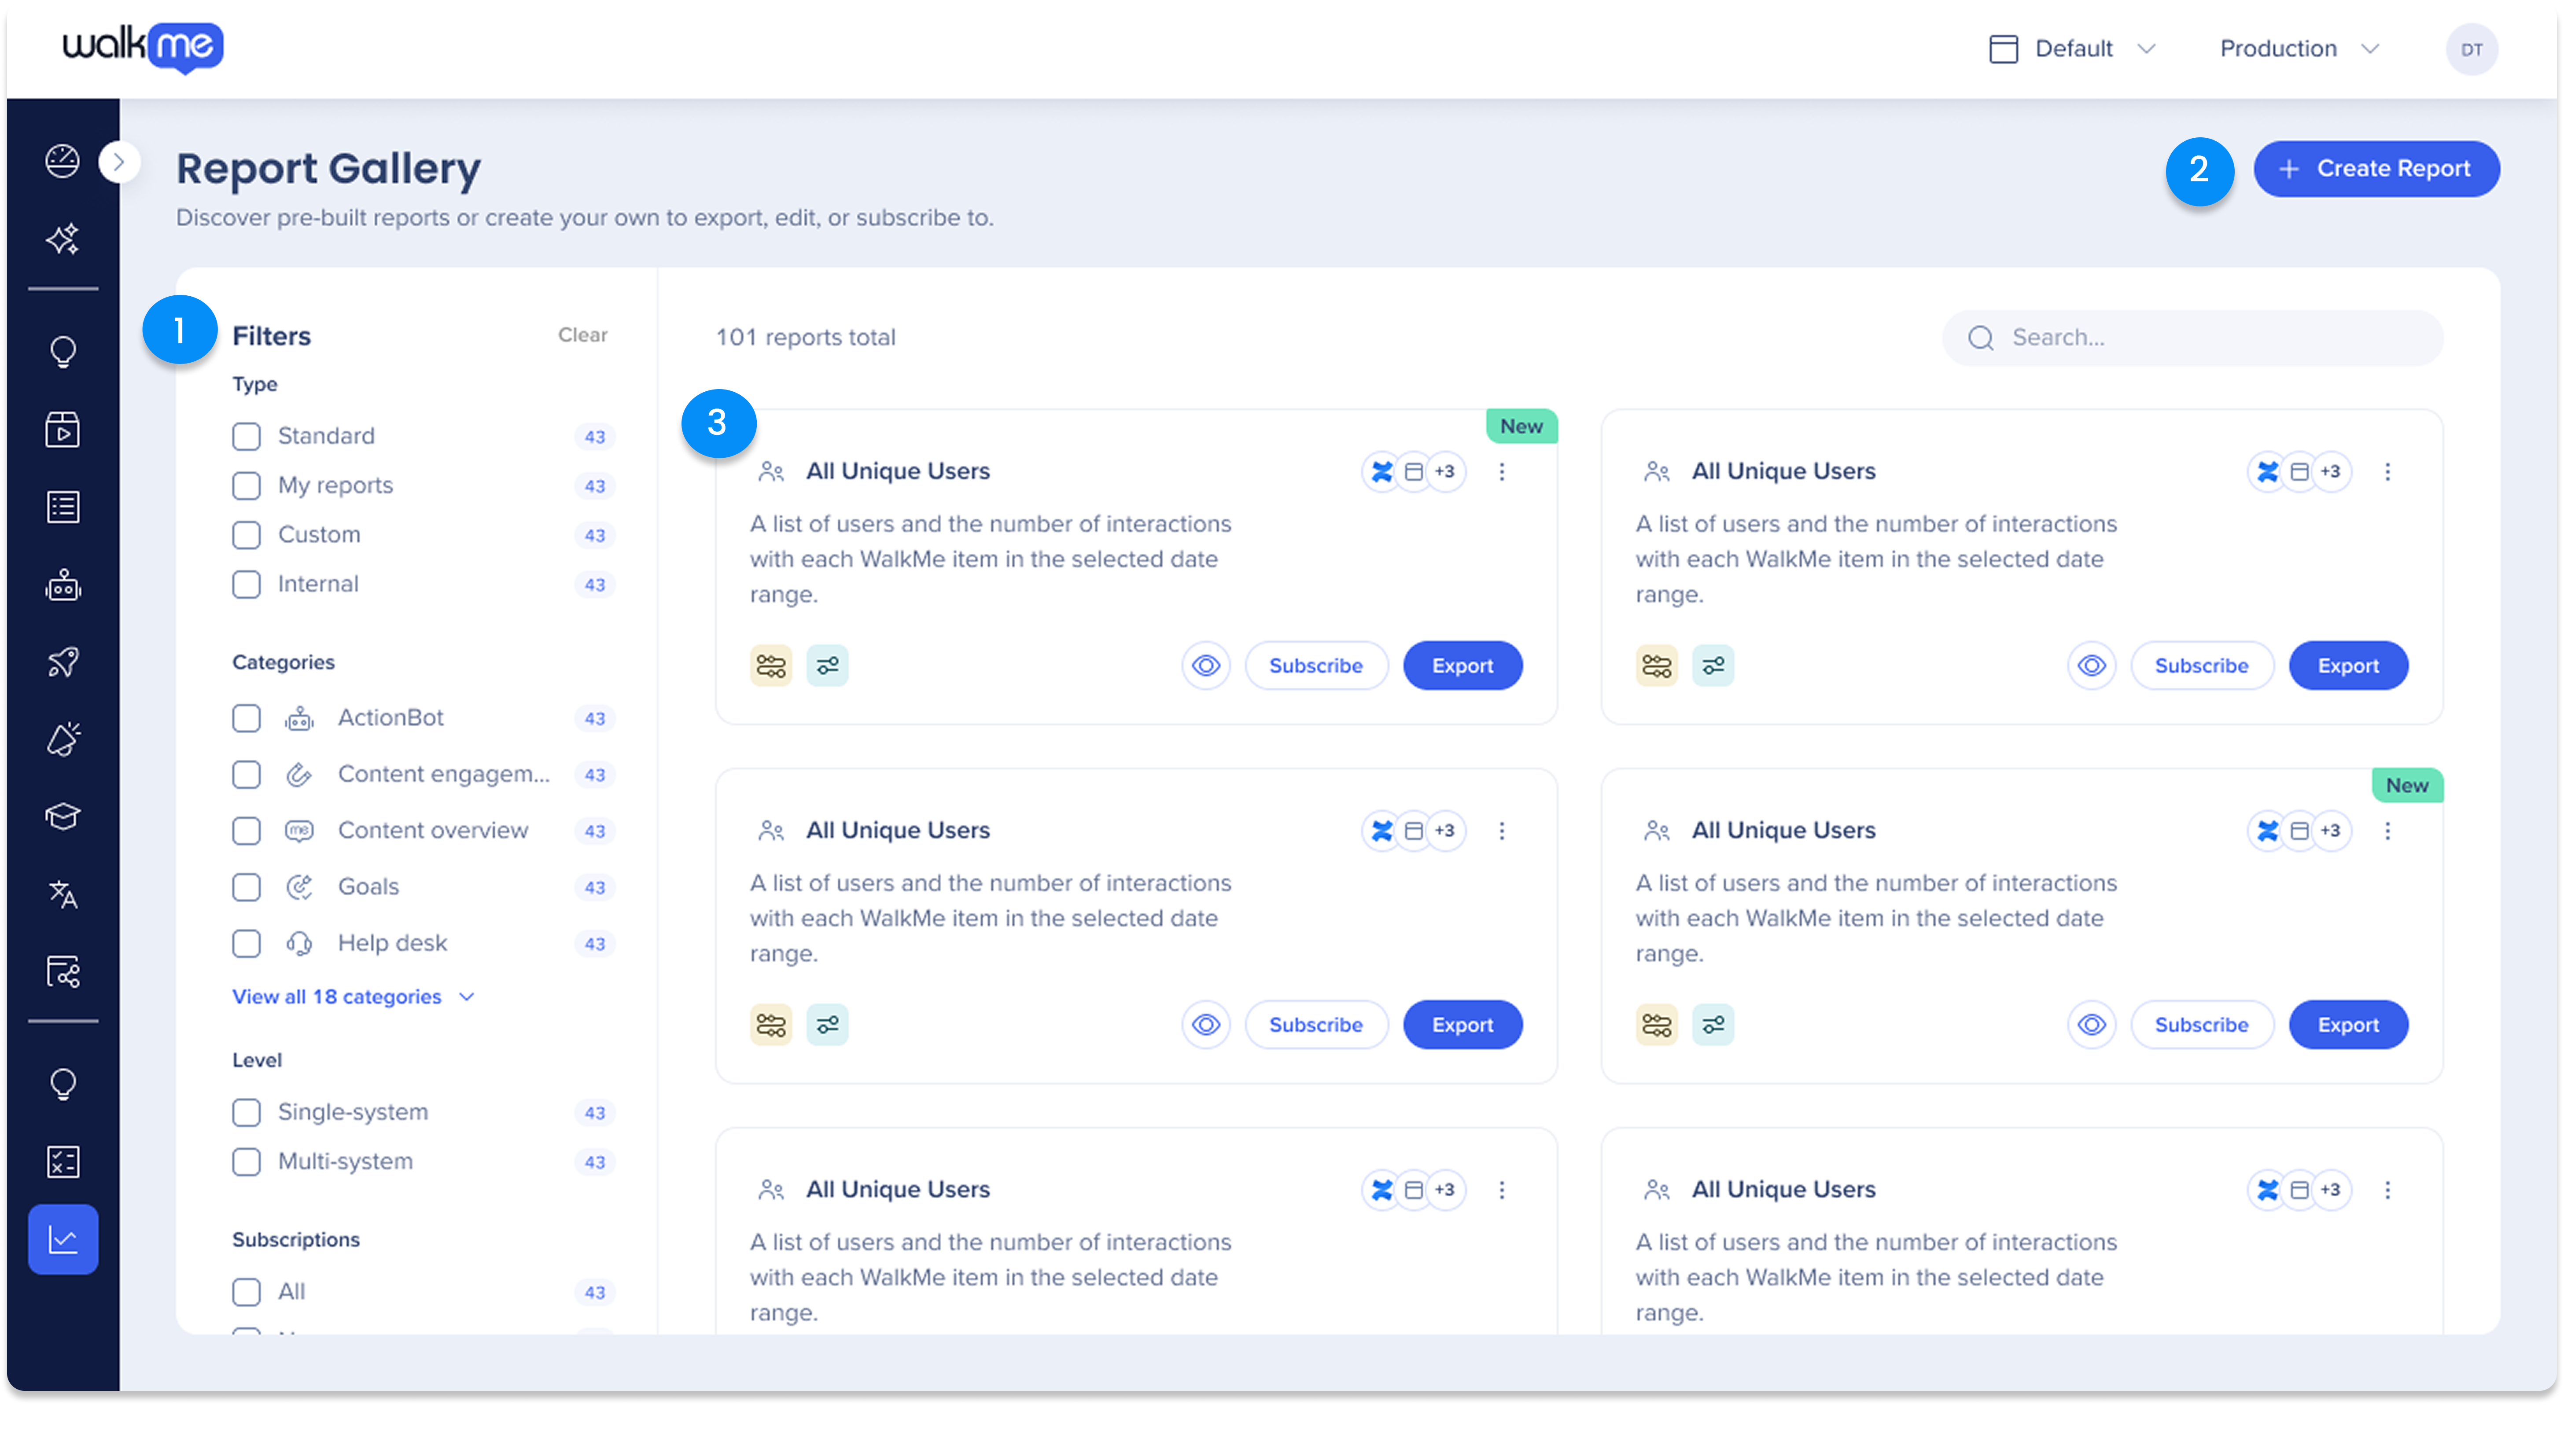
1. Filters
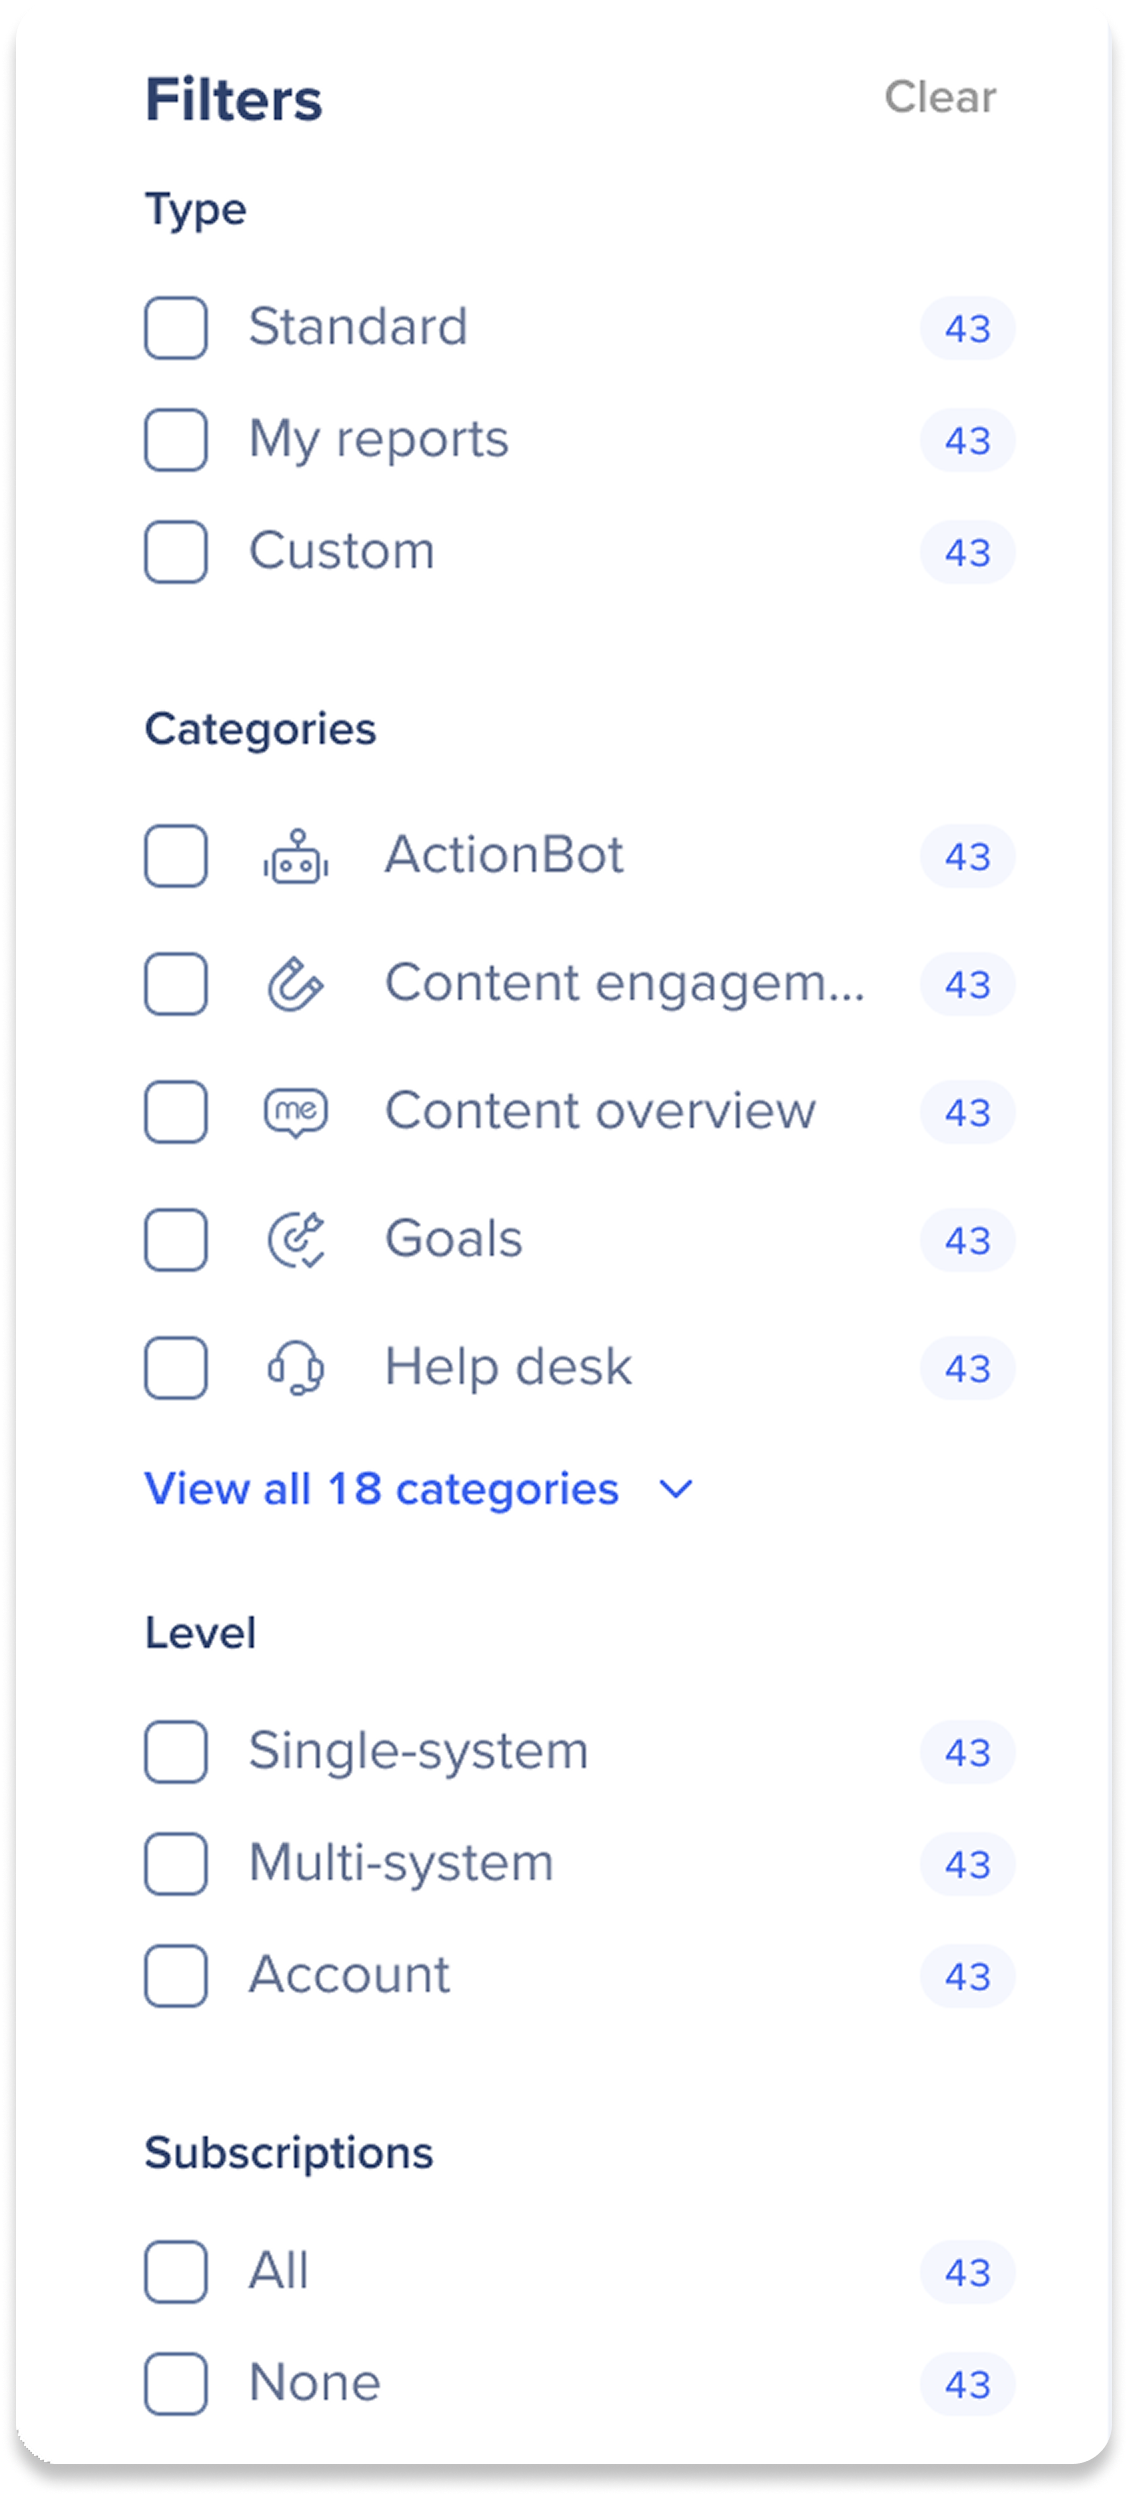
Access a specific set of reports in the gallery.
Type
-
Standard: A list of all of the available pre-built reports
-
My reports: A list of reports that the user made in the Report Builder
-
Custom: A list of reports built specifically for your needs by our R&D team
Categories
Level
Subscriptions
2. Report Builder
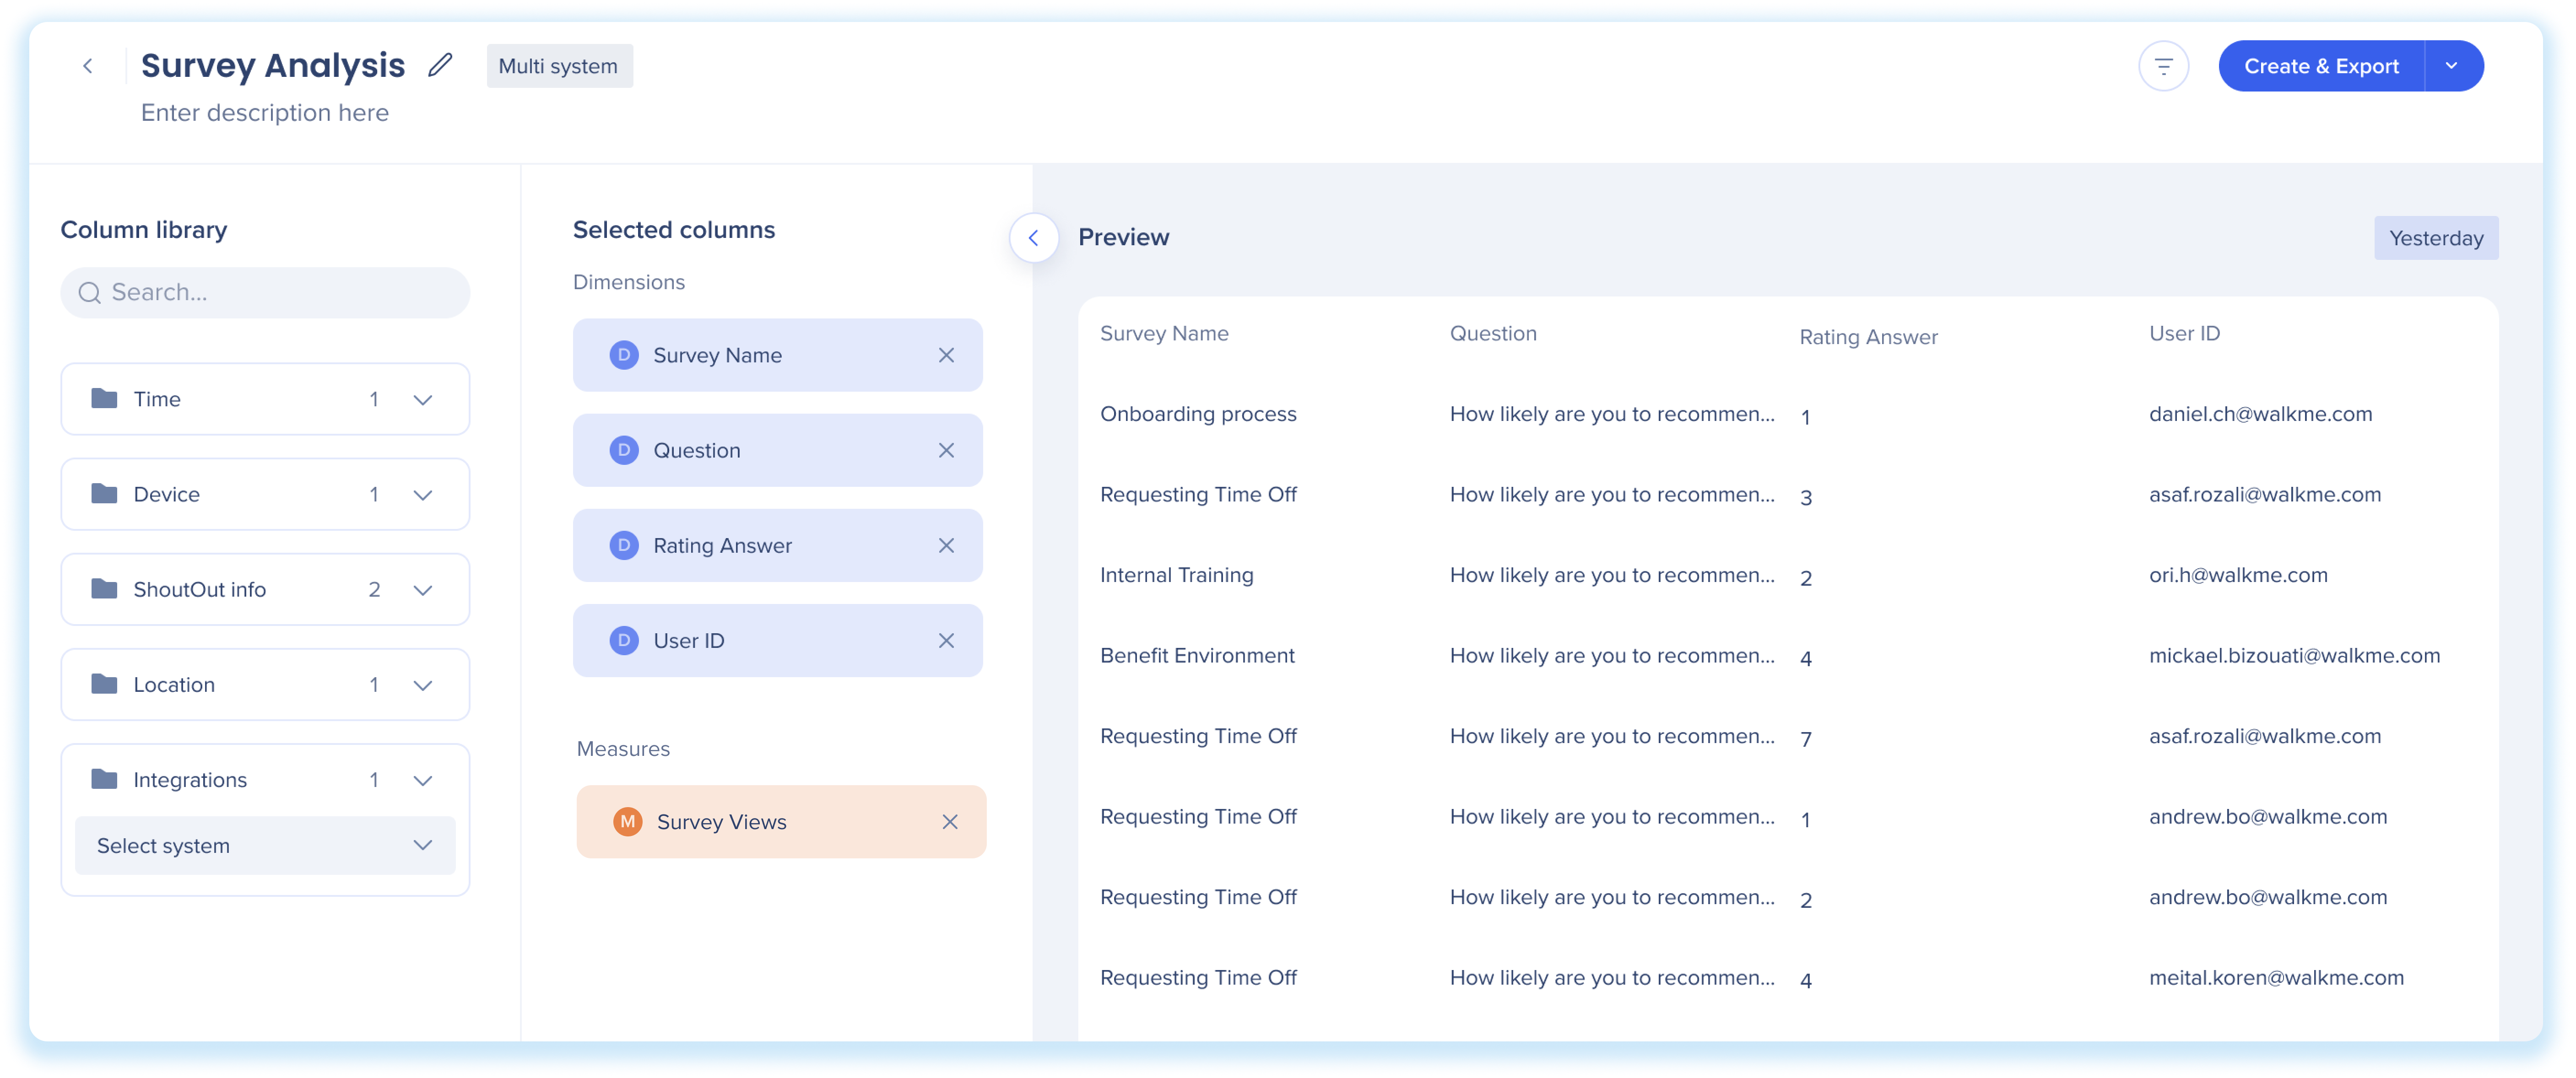
The Report Builder guides you through the process to create your own customized reports, beginning with choosing a template that best suits your needs, and then offering additional columns and filters for data enhancement.
Once the report is created it can be used in WalkMe just as any other report: it can be exported and subscribed to.
About Insights Report Builder
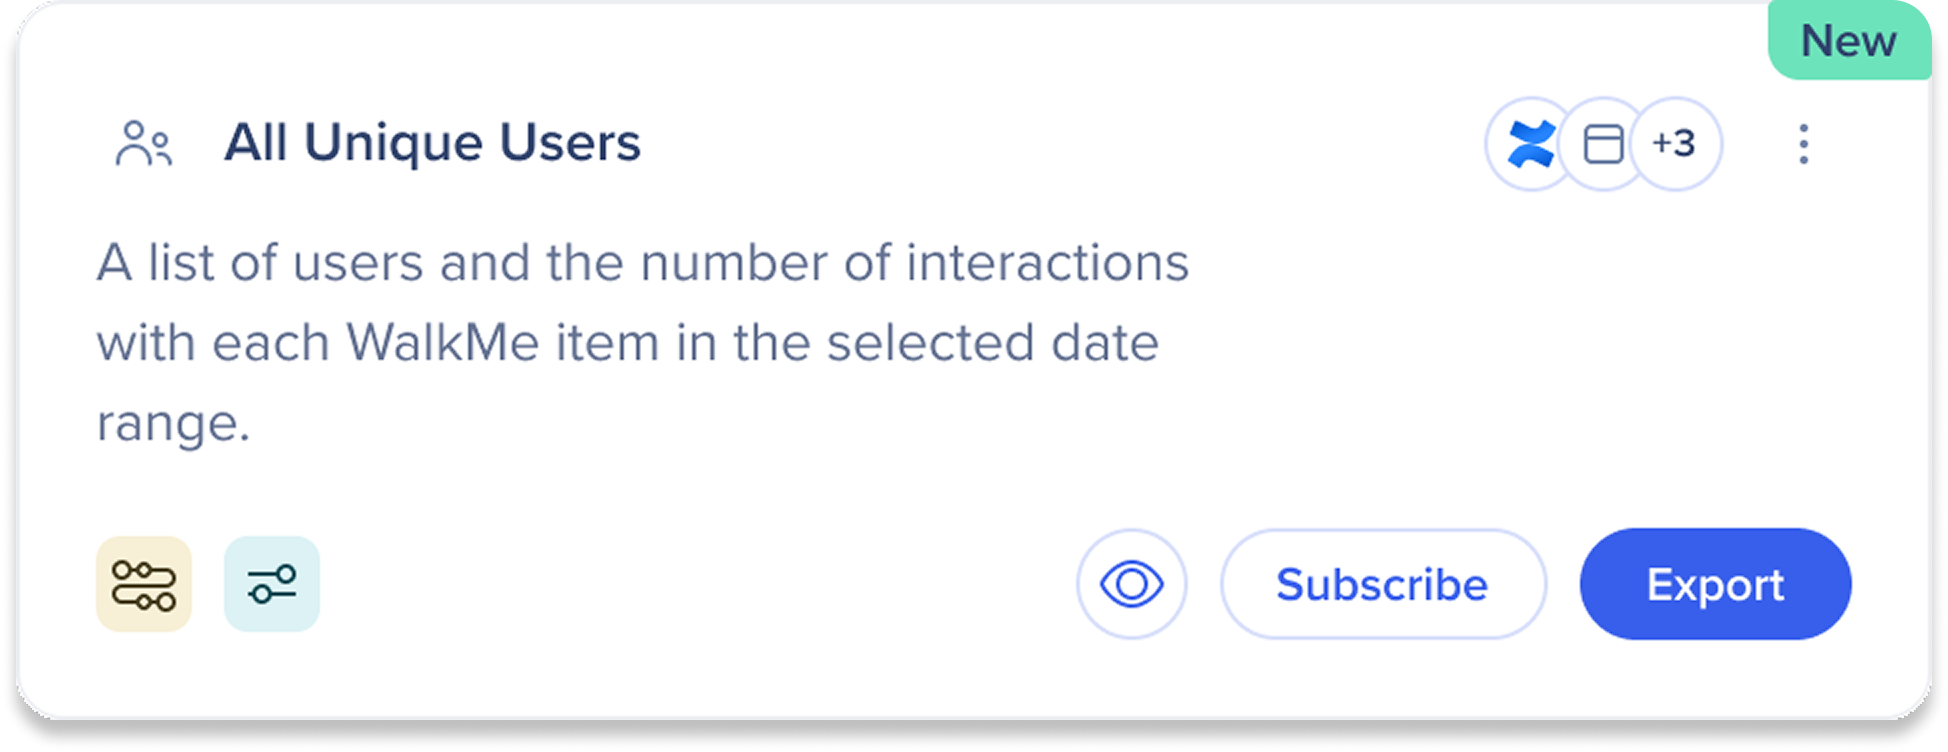
3. Report tiles
Read report descriptions and take necessary actions.
Tile buttons
-
Subscribe: Adds the report to the Subscriptions list and creates a subscription with a specific date range and frequency
-
Export: Adds the report to the Generated Reports list where it can be downloaded
Preview
The preview shows a sample of the data so you can check that the report's content looks right. Note that the preview is for understanding the report, not for testing.
Sample data is from the previous day. If unavailable, it shows data from the last week. The date tag in the upper-right corner shows the timeframe as "Yesterday" or "Last Week" and can't be changed.
The preview includes the Systems and Environment dropdowns.
Note
If you create a report in the Report Builder for a specific system and then preview it using a different system in the Reports Gallery, the report will be empty due to the system-specific filter.

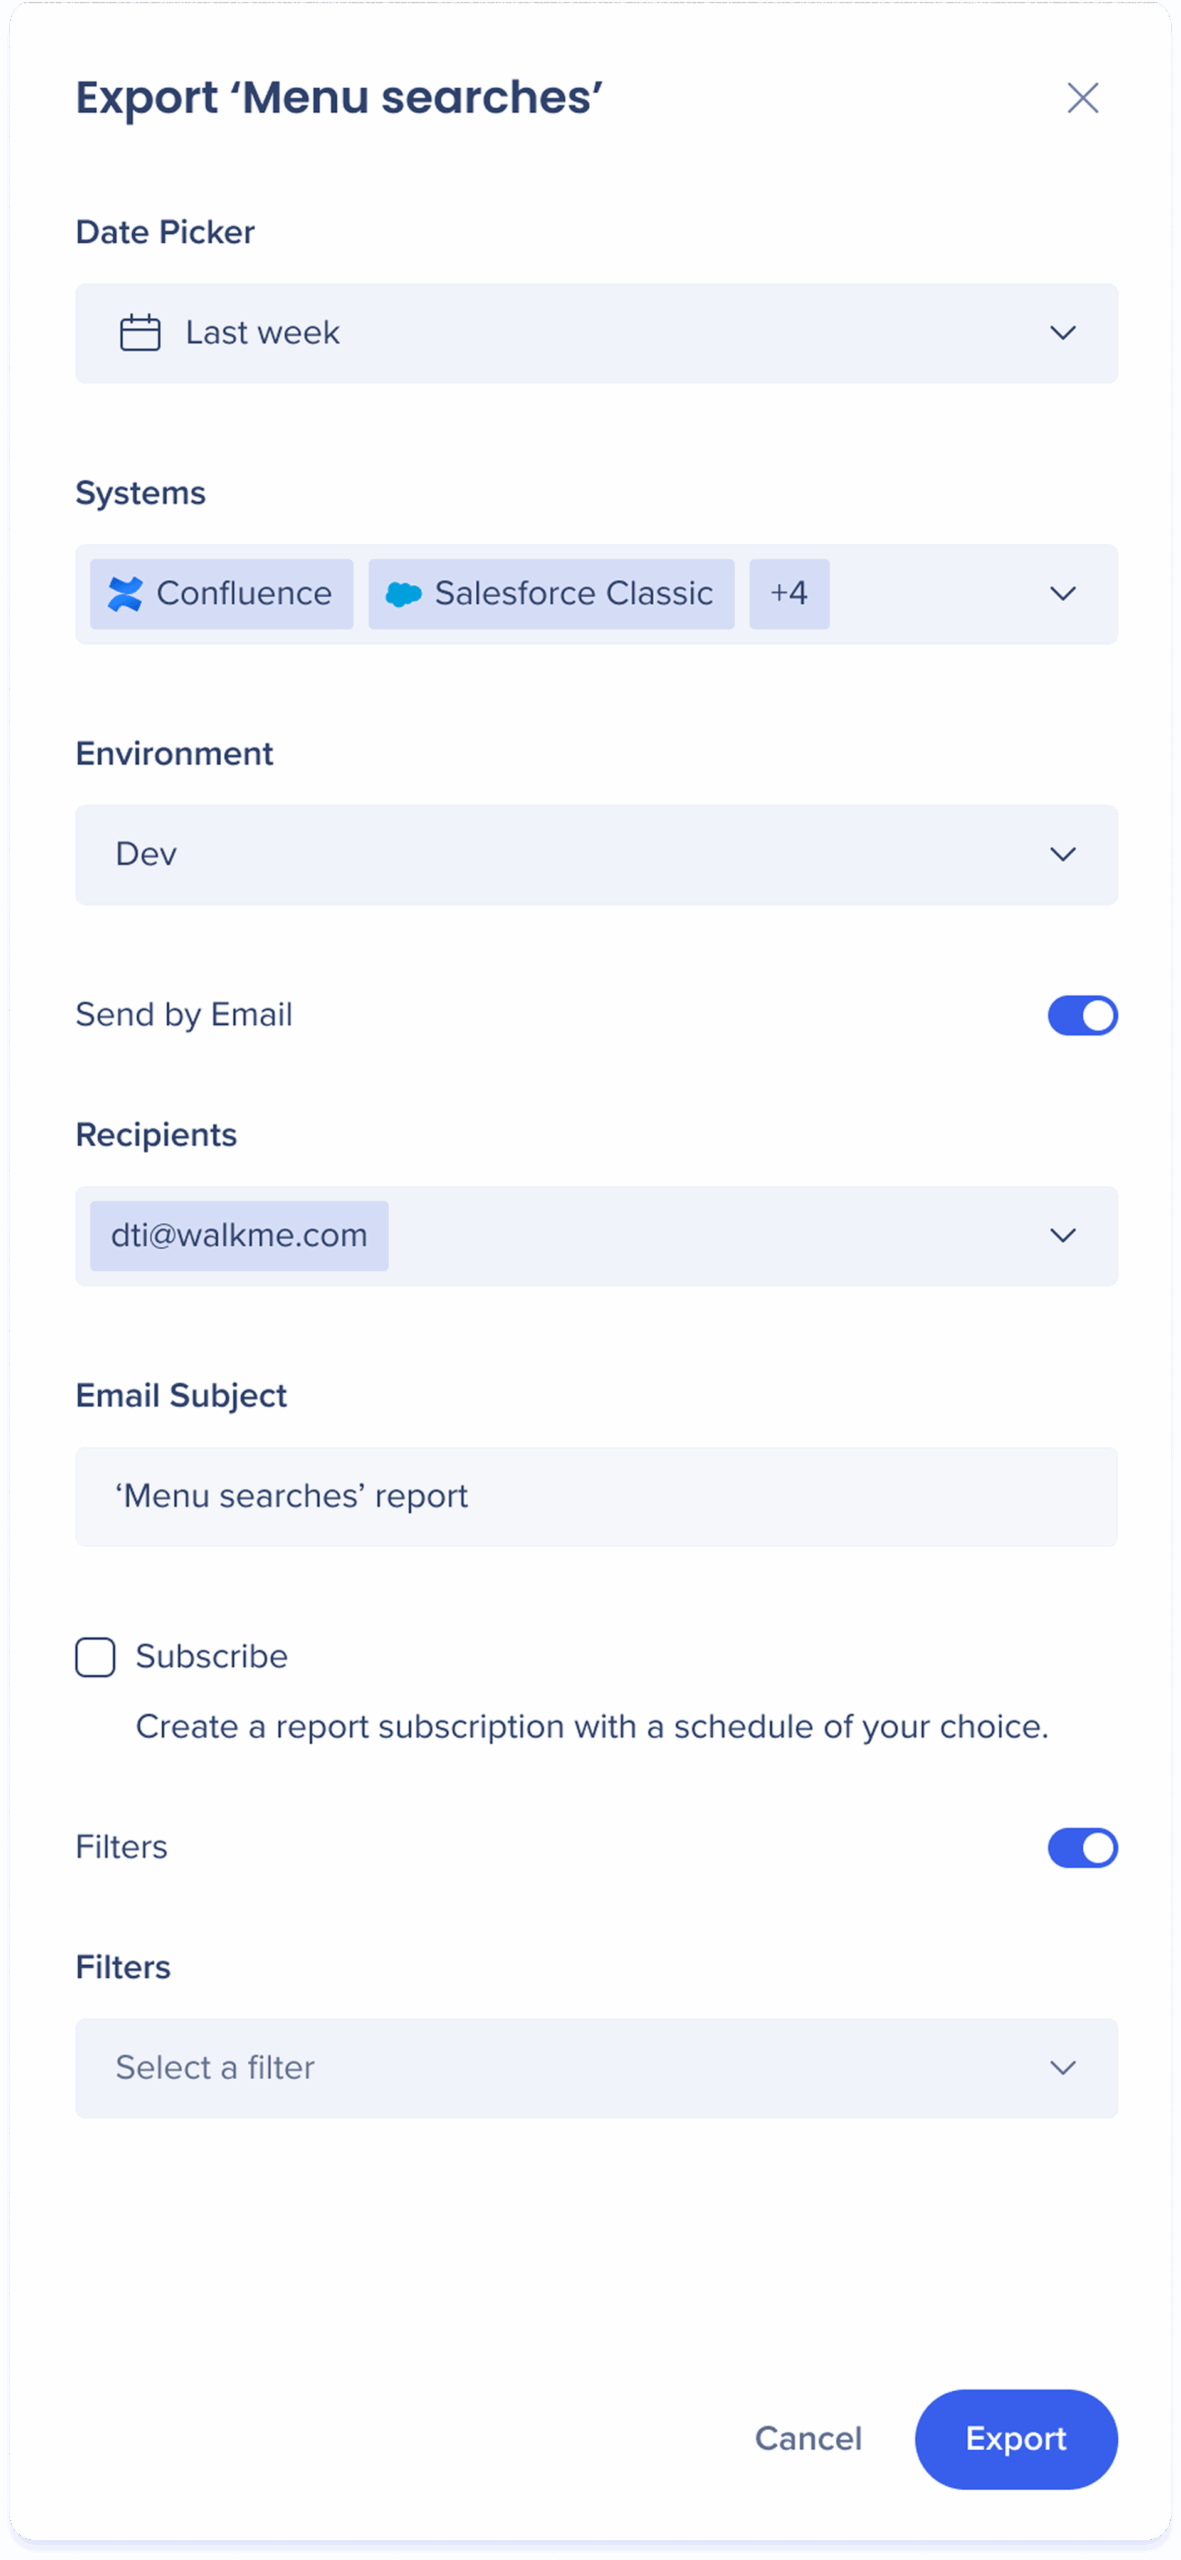
Export
-
Click Export on the report you'd like to export
-
Select the date range of the report data from the Date picker dropdown
3. Select the systems that the data will be pulled from
4. Select the environment that the data will be pulled from
5. Optional: Click the Send by Email toggle to send the report to a list of recipients
-
- Enter the emails of the recipients under the Recipient(s) field
- Type a custom email subject in the Email Subject field
- Tick Subscribe if you'd like to both export and create a report subscription
- Click Export & Subscribe
6. Optional: Turn on the Filters toggle to apply saved filters
7. Click Export
The report will be generated and added to the Generated reports tab under Reports & Subscriptions. From there, the report can be download.
Subscribe
-
Click Subscribe
-
Select the date range of the report data from the Date picker dropdown
-
Select the frequency of how often the report will be sent to recipients
-
Select the system(s) that the data will be pulled from
-
Select the environment that the data will be pulled from
-
Enter the emails of the recipients under the Recipient(s) field
Limitation
The email address list is limited to 256 characters. For emails lists that are longer than this limit it is recommended to create an email distribution list and use it for reporting.
-
Type a custom email subject in the Email Subject field
- Optional: Turn on the Filters toggle to apply saved filters
-
Click Subscribe
The subscriptions will be added to the Manage subscriptions tab under Reports & Subscriptions.

Apply saved filters
Notes
-
You'll only see filters that match the system you selected
-
If the selected filter becomes invalid due to system change, an error message will appear
-
The selected filter will be applied to the exported file or scheduled report
-
The filter name appears in the export and subscription details for easy tracking
-
Saved filters are applied to each scheduled subscription delivery – the filter name appears in subscription and in the email subject line
-
If no filter is selected, the full dataset is included by default
Limitations
-
Filters must already be created in the console; you can't create or edit filters during export/subscribe flows
-
Classic filters are read-only in console and are overwritten if edited
-
Filters are not supported for multi-system reports
-
Filters are not applied to Preview mode
-
The User Survey Answers Pivot report is not available as a template in the Report Builder
Common reports
There are several pre-built reports available for immediate access in the Reports Gallery.
Insights Pre-Built Reports
Exports & Subscriptions
The Exports & Subscriptions page has two tabs: Generated Reports and Manage Subscriptions.
Generated Reports

The Generated Reports tab has a list of reports that have been exported from the Reports Gallery. The reports list is organized by columns:
-
Report Name: The name of the pre-built or custom report
-
Time Period: The date range chosen for the report data
-
Triggered by: How the report was generated
-
Systems: A list of systems included in the report
-
Environment: Which environment the report was exported to
-
Started: Time when the user clicked to export the report
-
Status: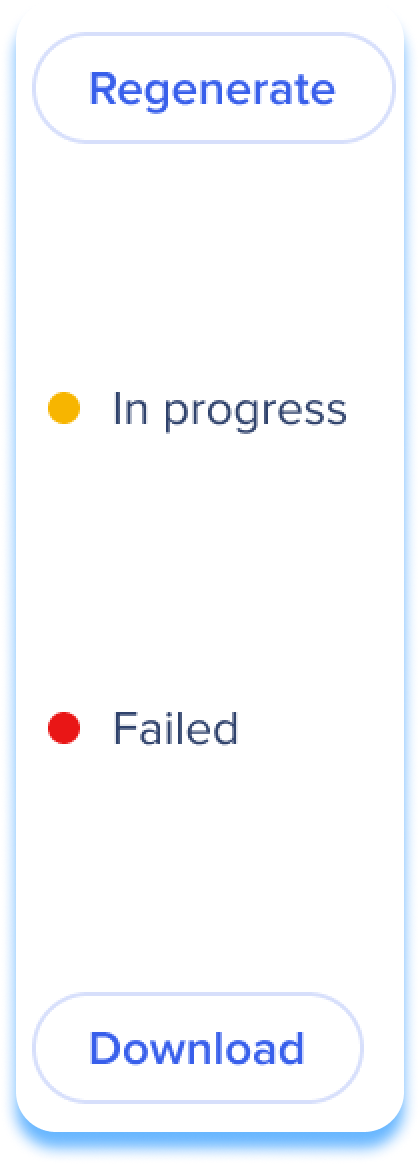
-
In progress: The status "In progress" indicates that the report is currently being processed
-
Download: Once the report generation is complete, a "Download" button will appear, allowing users to receive a copy of the report
-
Failed: If the report generation fails for any reason, the status will be displayed as "Failed"
-
Regenerate: After a report has been generated, the "Regenerate" button will appear, allowing users to generate the report again to view updated data
Manage Subscriptions

The Manage Subscriptions tab provides users with a list of implemented subscriptions in their organization. The list is organized by report name:
- The number next to the name indicates how many subscriptions there are per report
- Click on a subscription name to access columns containing important information and actions related to the subscription
Table columns:
-
System(s): A list of systems included in the report
-
Environment: Which environment the report was exported to
-
Subscription frequency:
-
Daily: Sent every day at the hour and timezone selected
-
Weekly: Sent weekly, on the day and hour and timezone selected
-
Monthly: Sent monthly, on the day of the month and the hour and timezone selected
-
Available for Last month, Last 3 months, Last 30 days, Last 90 days, and Last 365 days date ranges
-
Created by: User that created the subscription
-
Email recipient(s): List of people that the report was sent to by email
-
Status:
Actions menu
Click the Actions menu icon to view report actions.
Technical Notes
Limitations
-
The email address list is limited to 256 characters - For longer lists, create an email distribution list and use that instead
-
Report links expire after 7 days
-
A maximum of 15 recipients is allowed
-
Report data is only available for the past year - see Insights Data Collection for more information
- Reports created for a specific system can only be exported for that system
-
Editing capabilities for report subscriptions created in Insights Classic is limited
- Reports can be up to 100GB and must complete within 1 hour and 30 minutes to avoid failure
- Reports with no downloads for 14 months will be removed from Insights
- Reports doesn't support subscriptions or exports for desktop/mobile systems
- Saved filters aren't supported for WalkMe Menu for Desktop and WalkMe Menu for Mobile reports
Notes


