Brief Overview
The License Optimization Dashboard helps you identify inefficiencies and cost-saving opportunities across your software spending. Compare the license data you provide against actual usage to spot inefficiencies instantly and optimize how your organization spends on software.
WalkMe Discovery
How It Works
A license refers to a paid user account. A license type denotes specific user permissions, such as edit, view, or admin access.
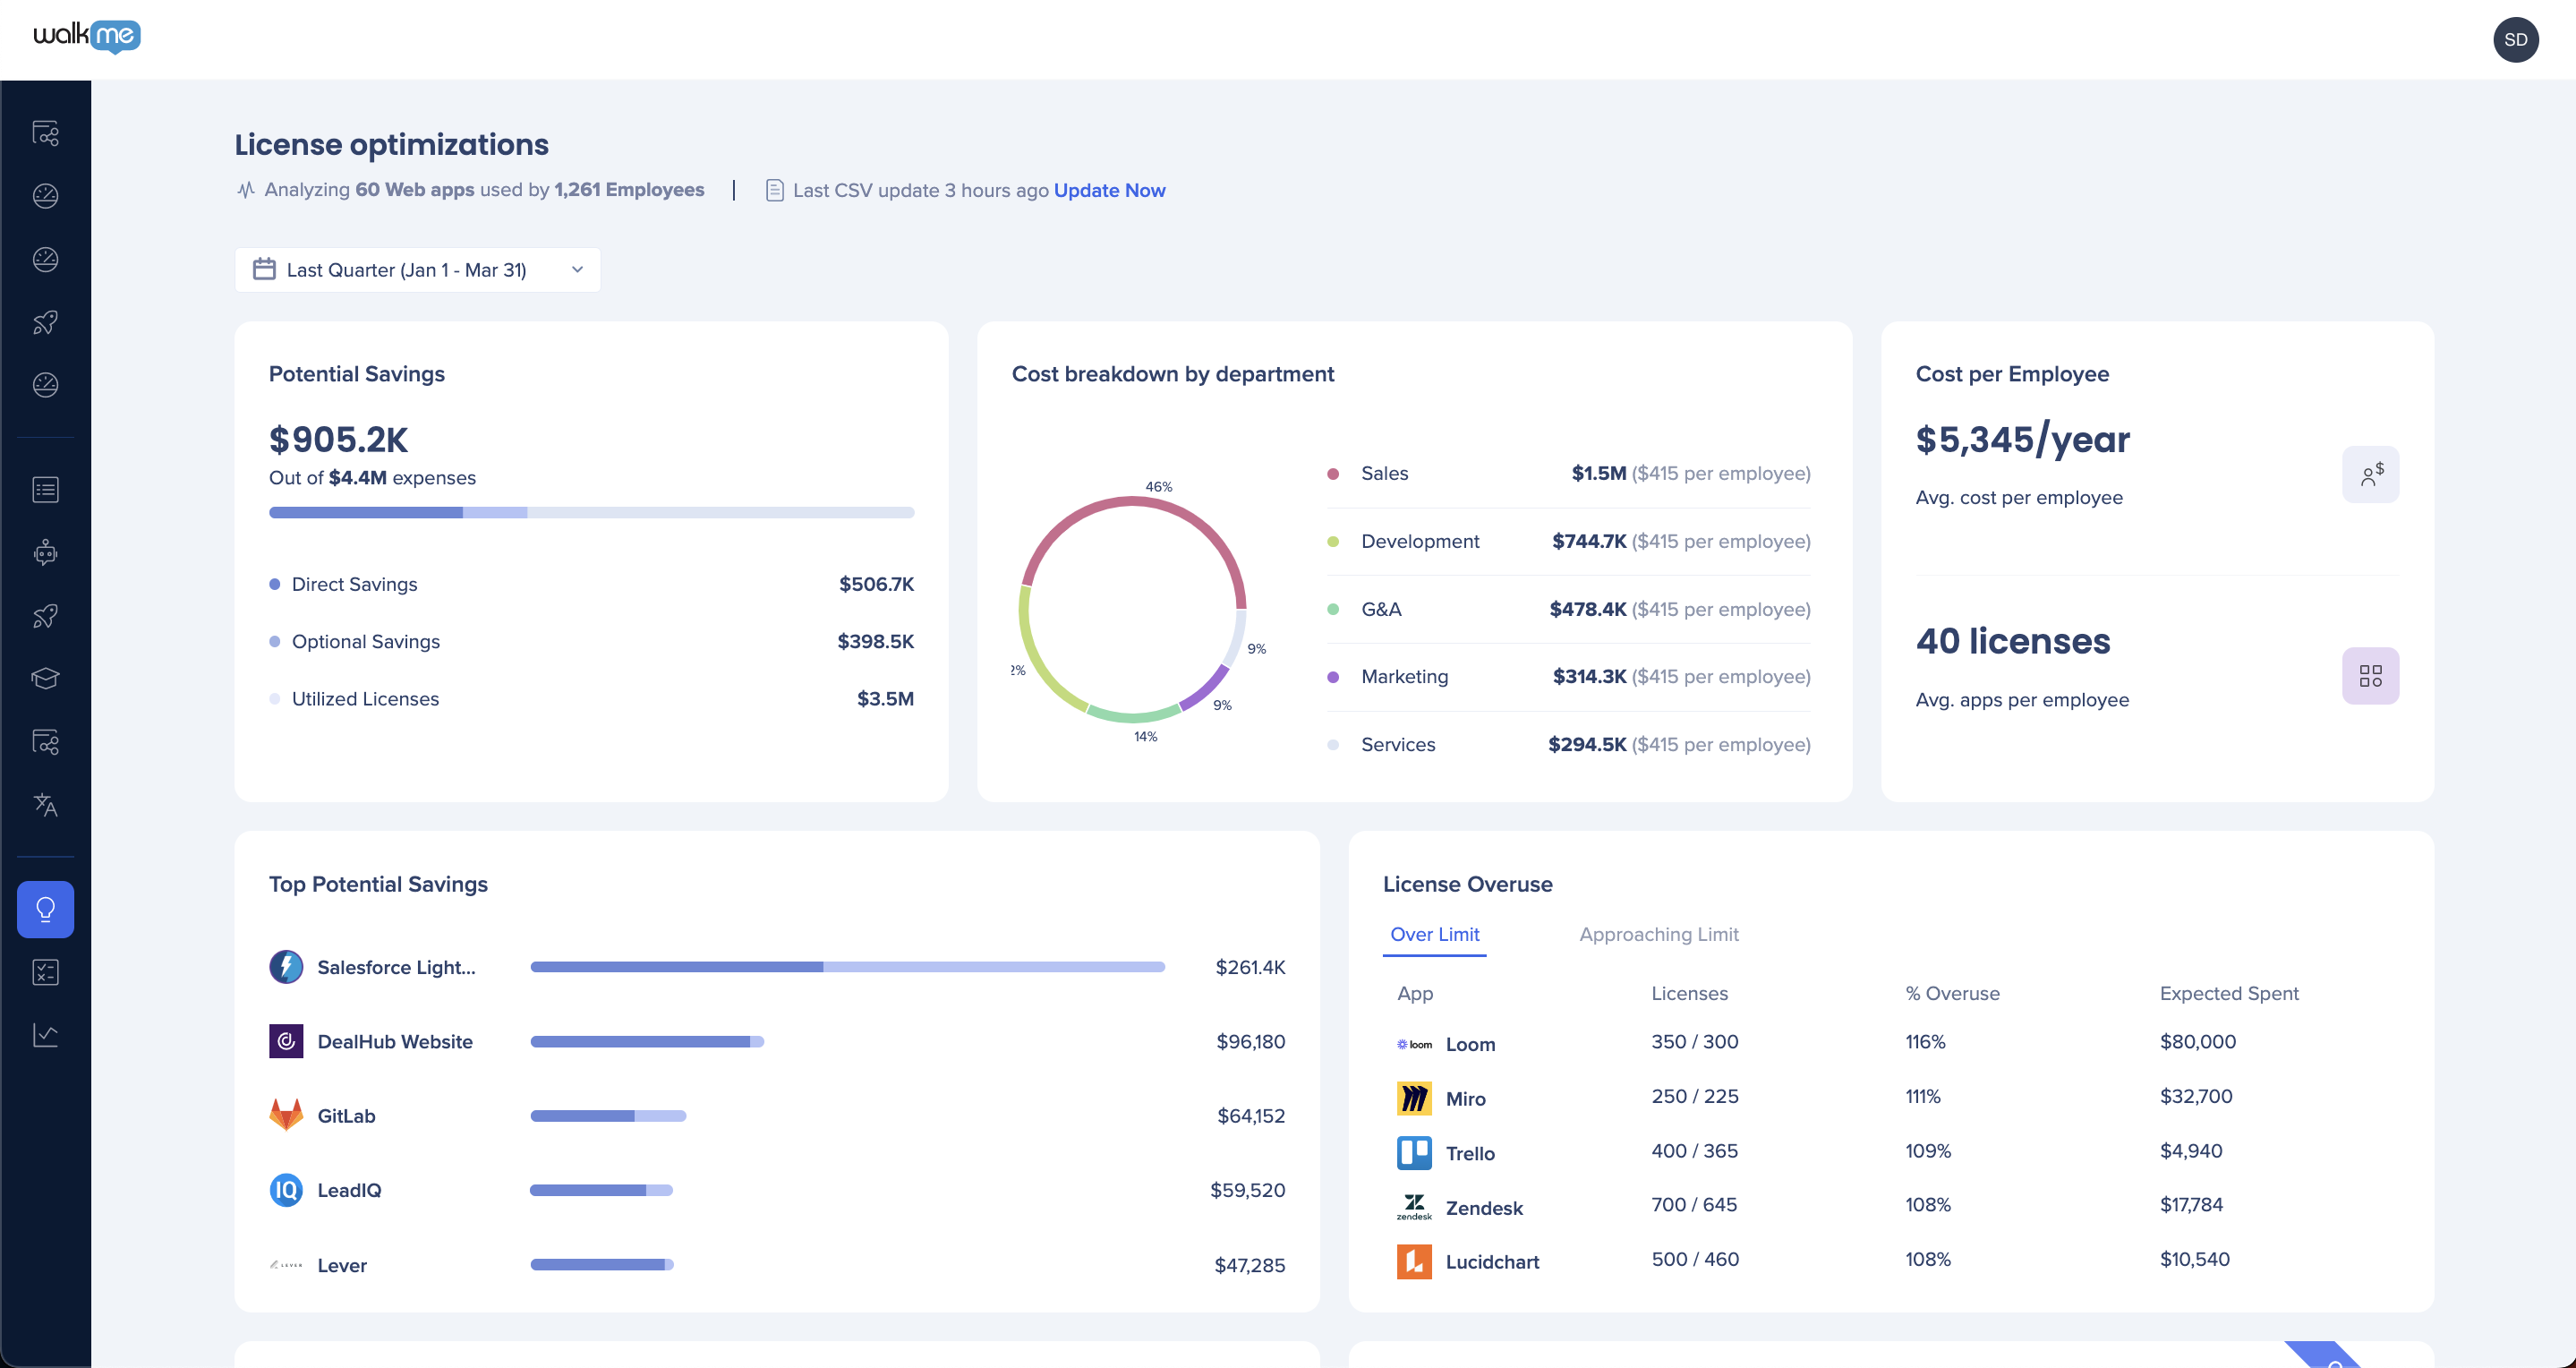
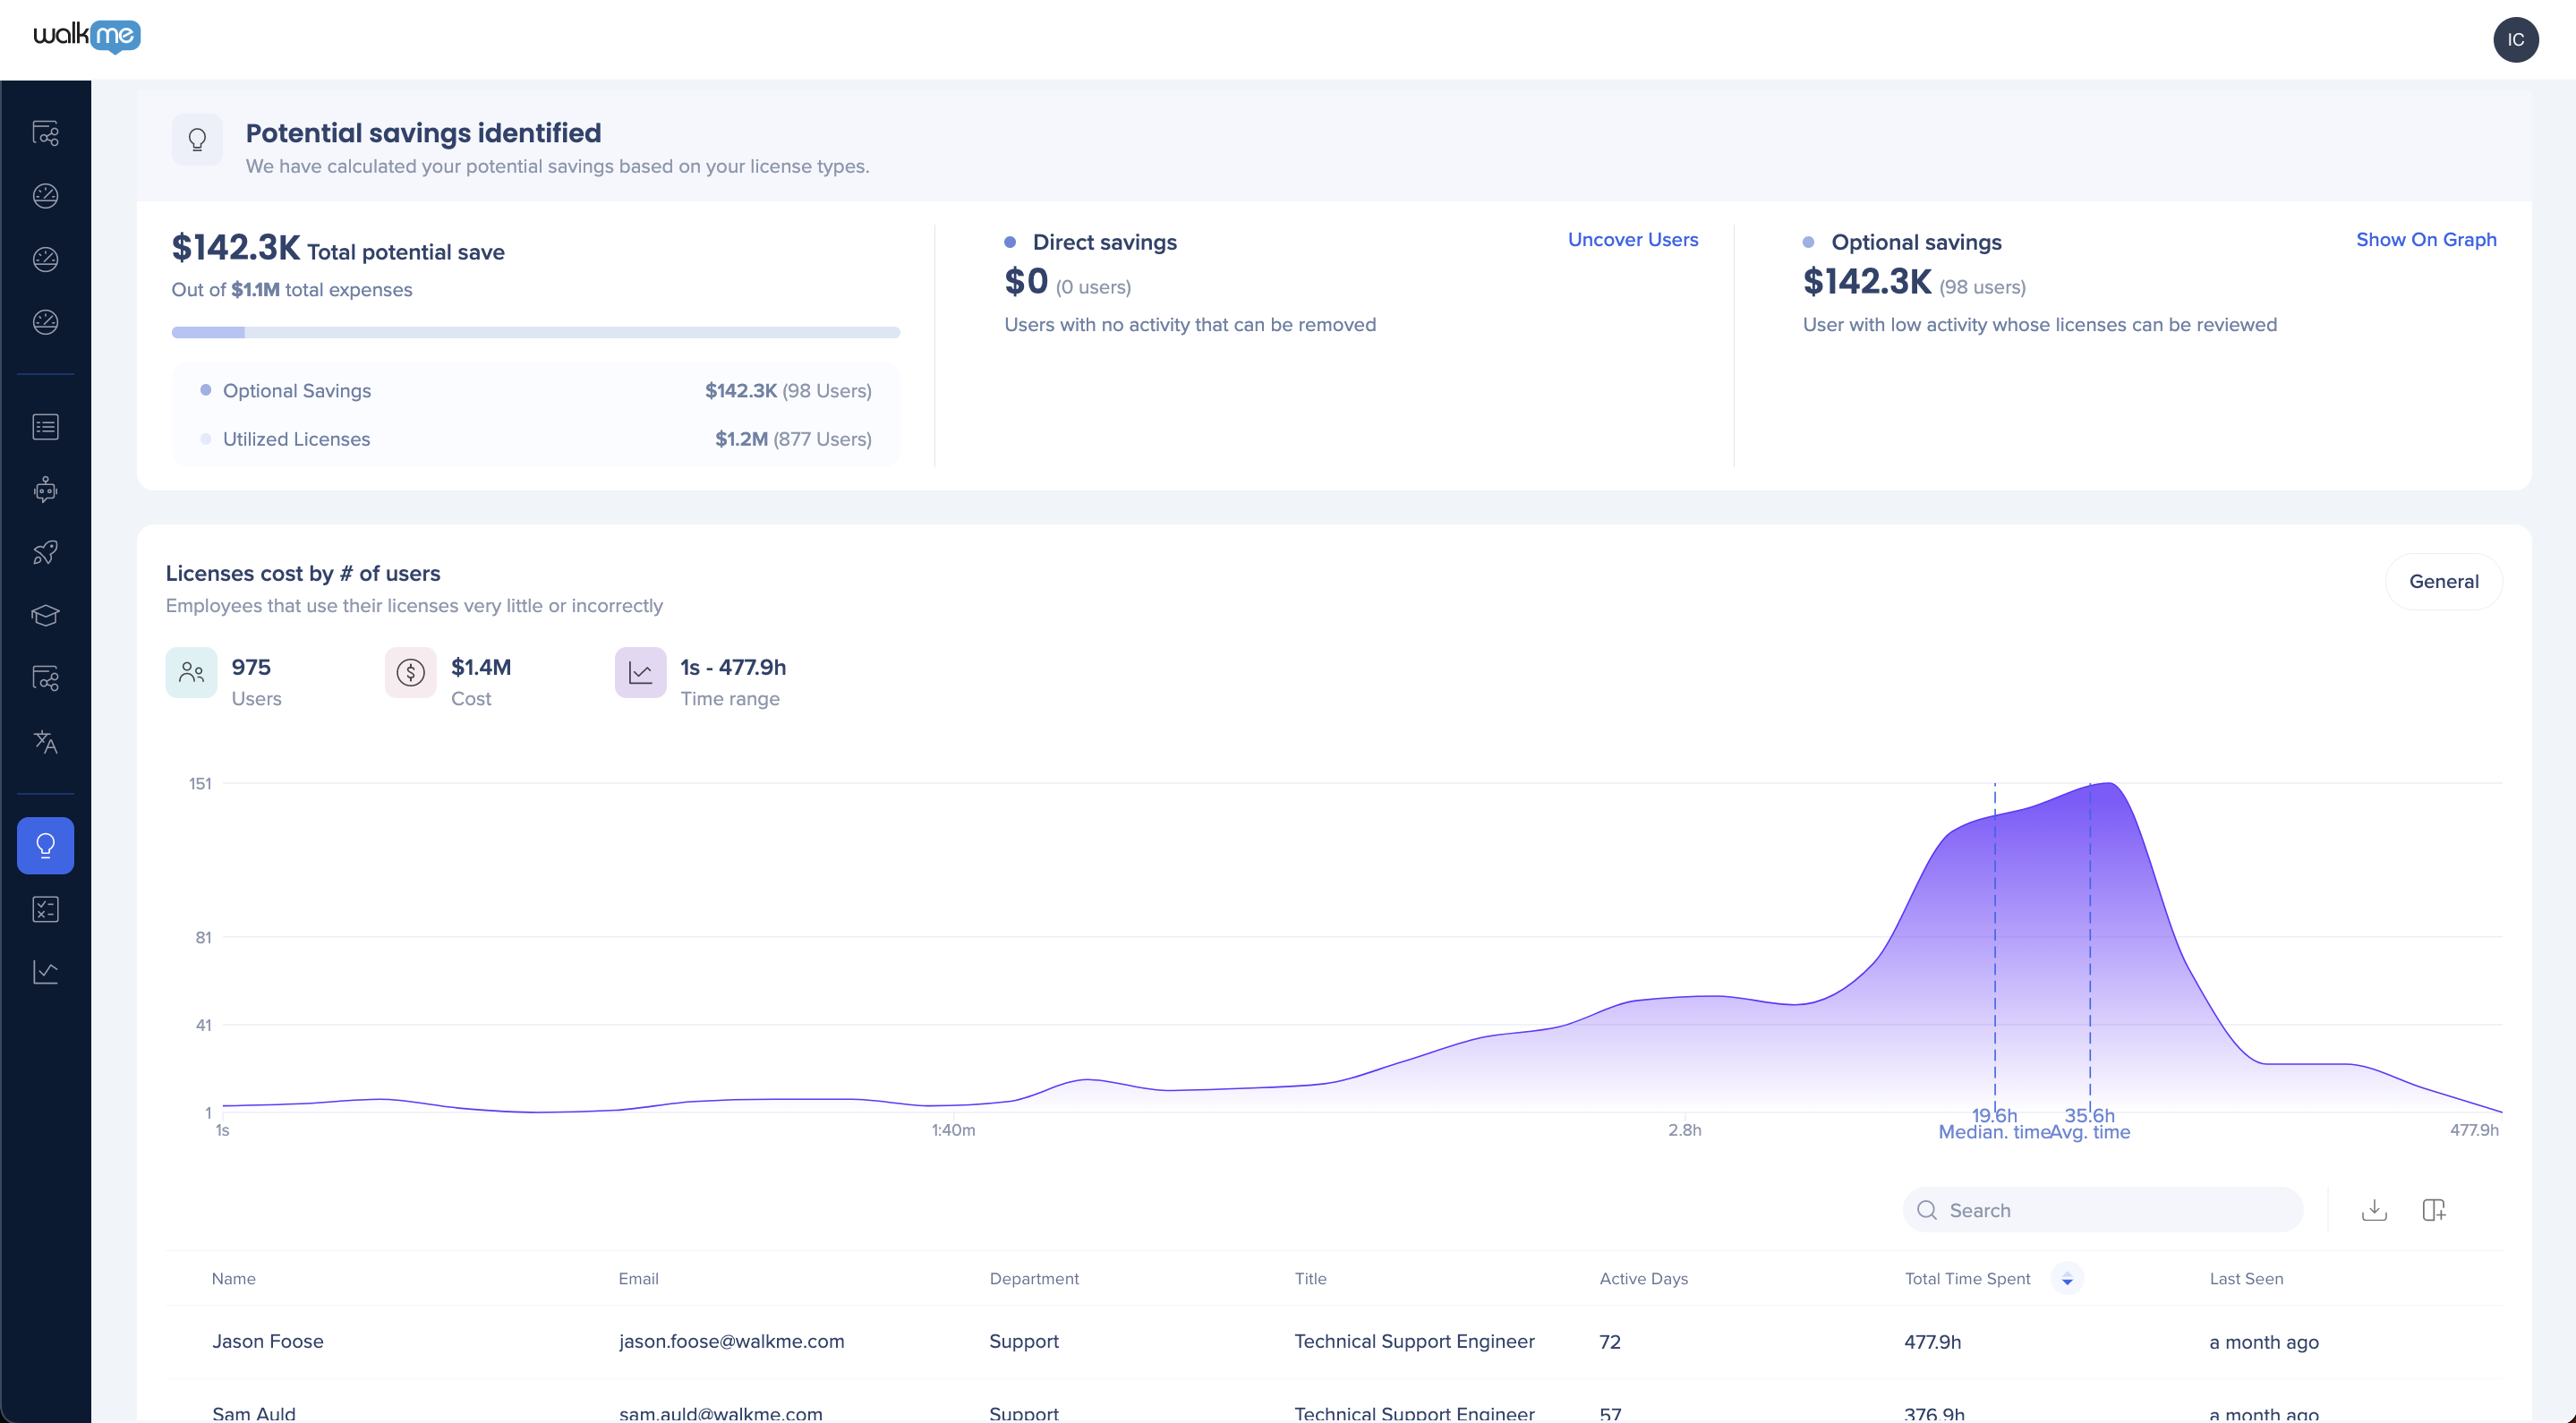
Total potential savings (licenses value)
Identify unused and underutilized licenses, and take action to cut costs and optimize your tech stack.
- Direct savings: Licenses that aren't used at all
- Optional savings: The lowest 10% of users based on total time spent
- Active usage licenses: Number of users actively using the application
Cost breakdown by department
Cost per department, based on the number and cost of licenses per department you provide.
- Requires IDP Integration or CSV upload
Cost per employee
Total cost of software licenses per user.
- Average cost per employee: Total cost for all licenses divided by the total number of users
- Average number licenses per employee: Total number of licenses divided by the total number of users
Apps with most potential savings
The top 5 apps with the highest license value and no or low usage.
Cost breakdown by category
Cost per category, based on the number and cost of licenses per category as indicated in your CSV.
All apps
A full view of every software application used in your organization, including:
- The app name, as defined in the WalkMe app library
- Total licenses, as provided in your CSV
- Contract renewal date and annual contract cost
- Utilization rate: The percentage of active users compared to total licenses
- Potential savings, based on underutilized licenses
- App category, as defined in the WalkMe app library
- App owner, as you've indicated
This widget gives you a full view of your software portfolio, so you can make informed decisions about license usage and allocation.
Measuring license usage
License usage compares the number of users visiting an app against the number of licenses your organization pays for.
User activity graph
This graph visualizes an app's popularity based on the number of users and time spent, alongside a list of active users and their activity level. Use it to identify potential cost savings and streamline your software usage.
How to Enter License Info in the UI
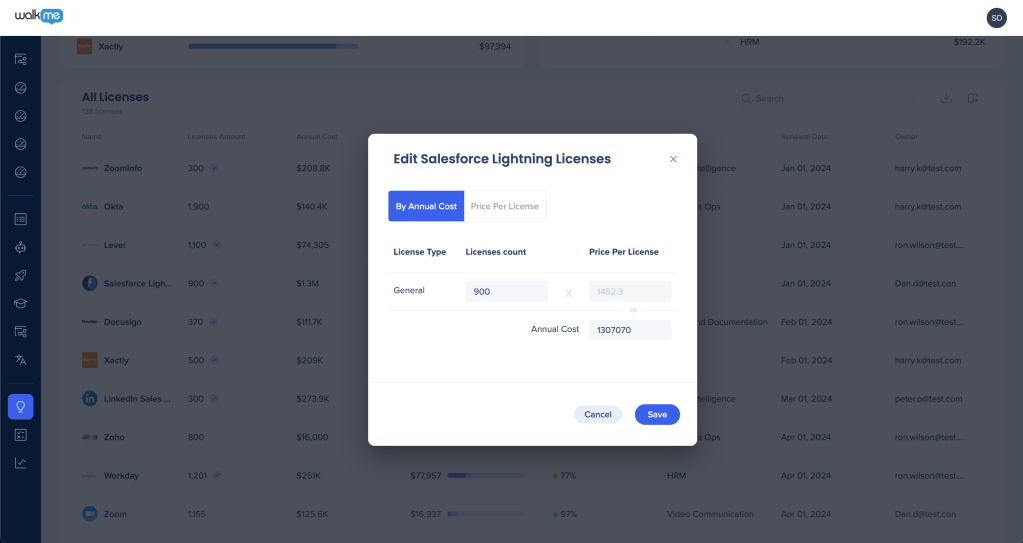
If you already have license information for a few apps and want to see utilization and potential savings right away, add the information directly in the table. You can edit license info or add it for more apps at any time.
How to Upload the License Dashboard CSV
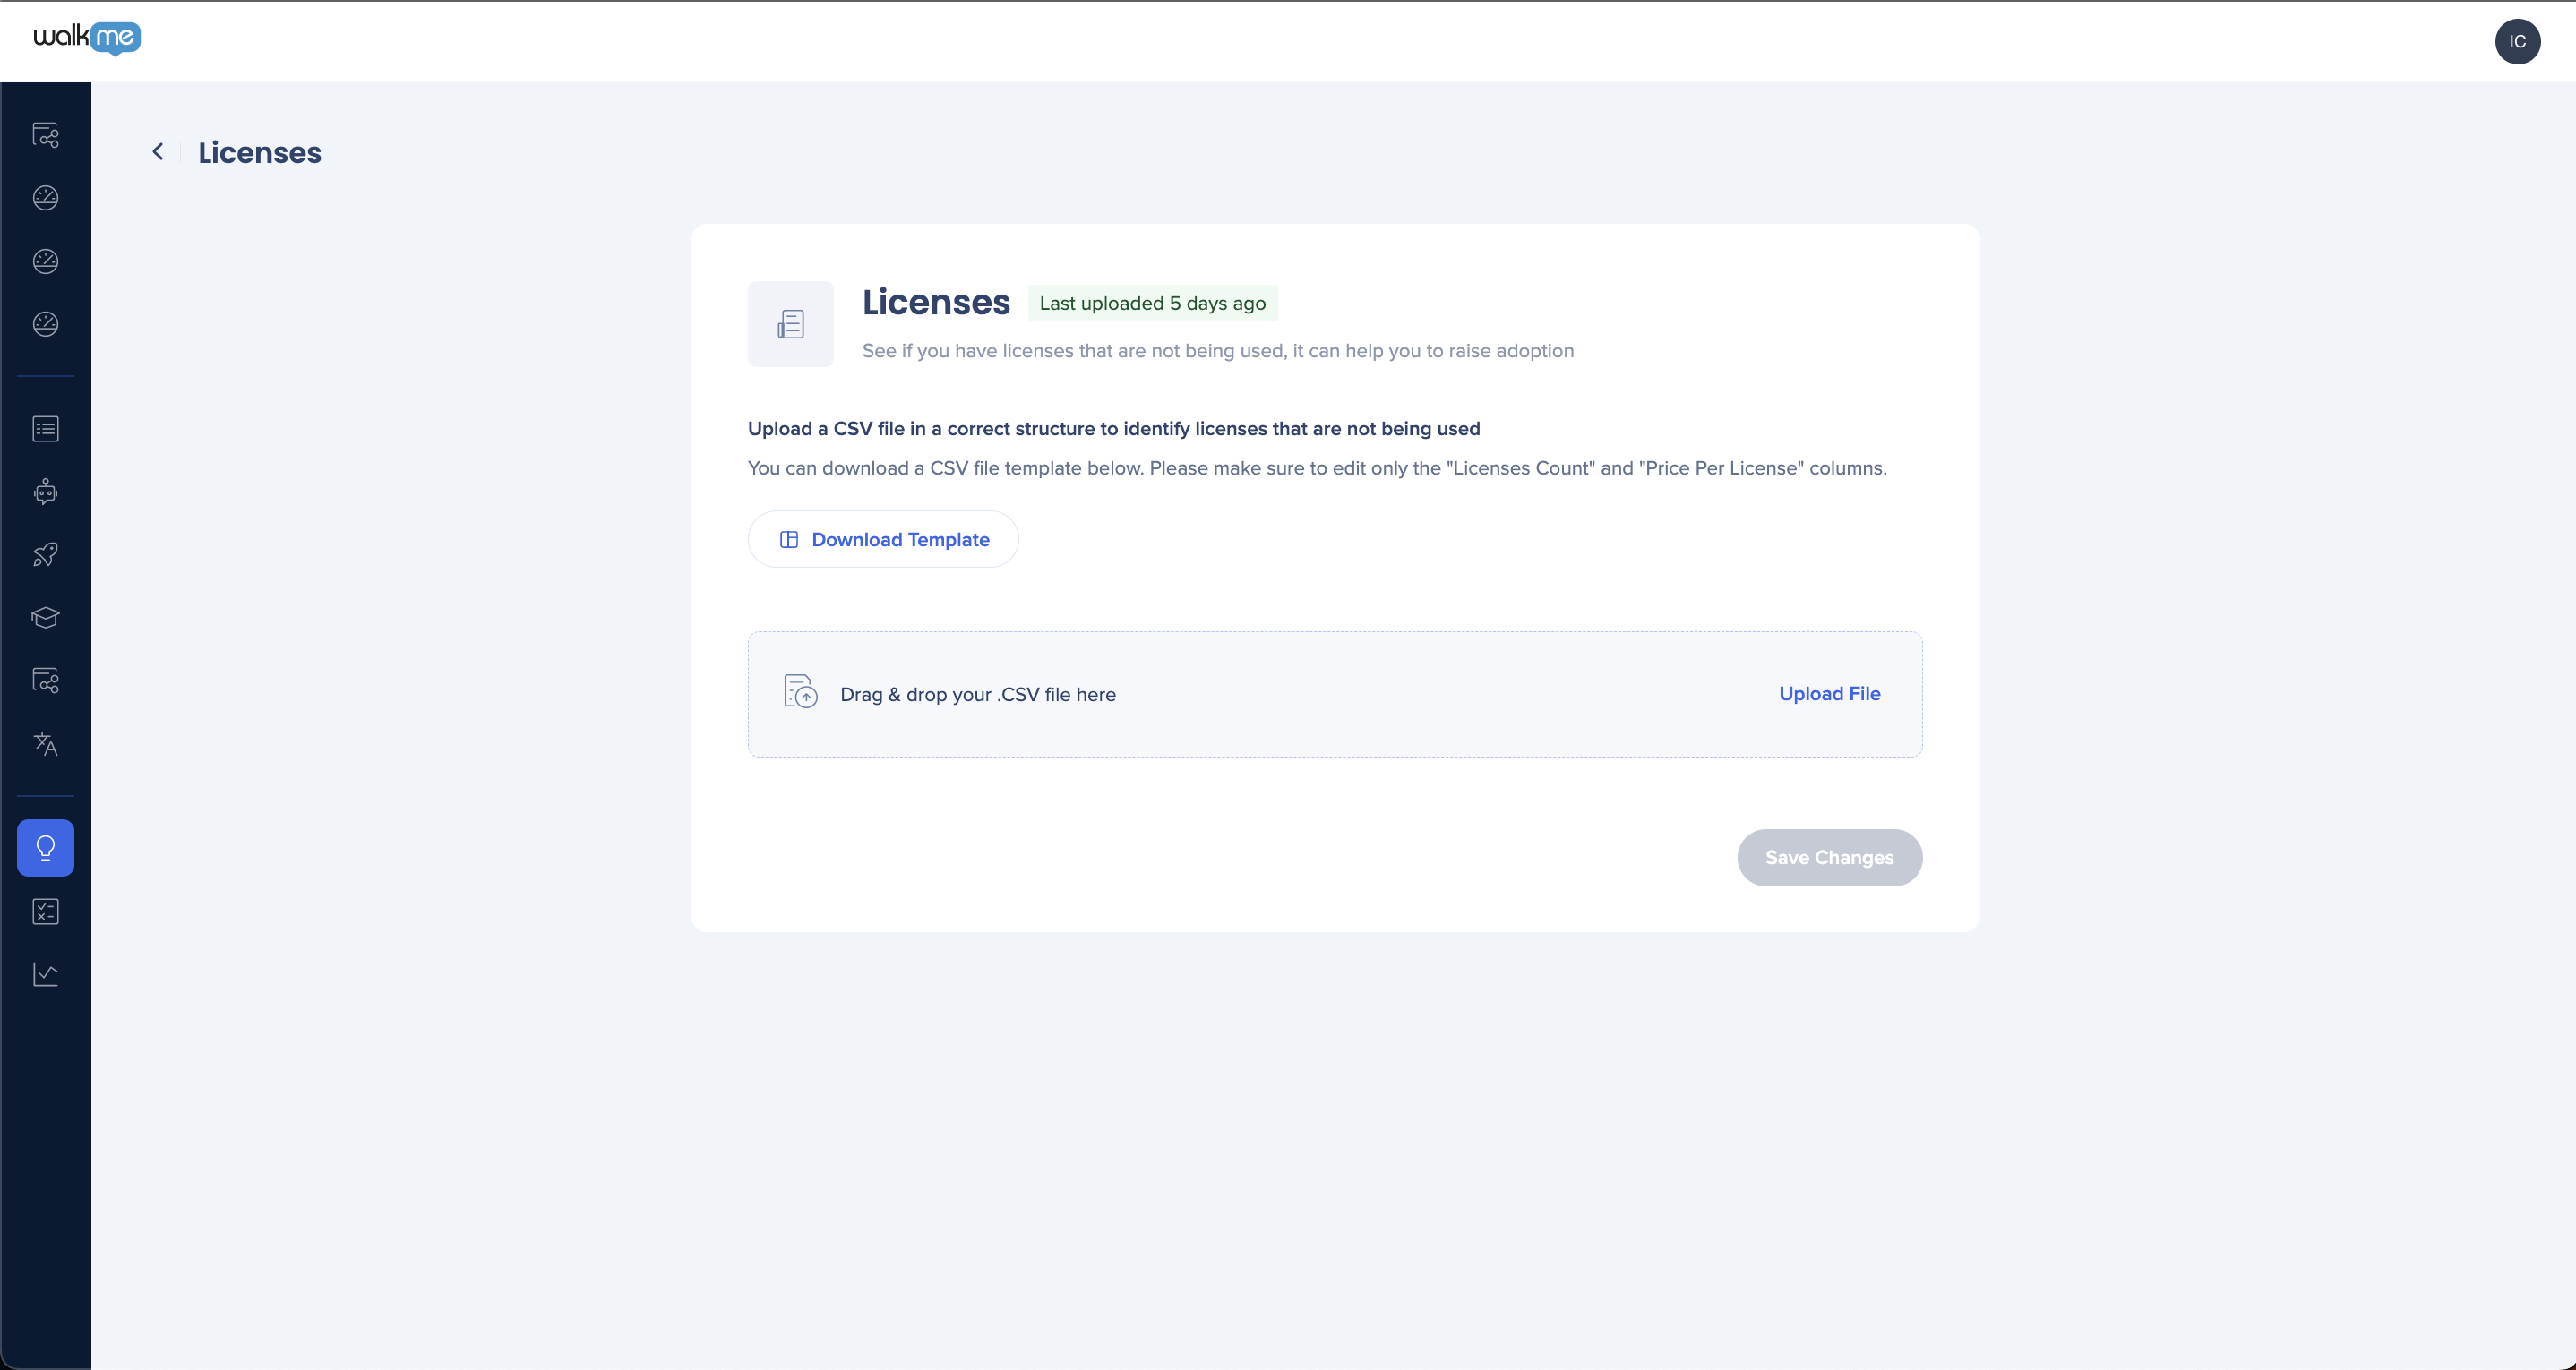
To get the full experience of the Licenses Dashboard, upload a CSV with license information for each app. This populates the dashboard automatically and gives you deeper insight into your software expenses.
To upload a CSV:
- Open the Discovery app and go to Settings
- Select Integrations, then Manual Integrations, then Licenses
- Download the template and upload a CSV file with the app ID, app name, number of licenses, and cost per license
You don't need to upload a CSV to use the Licenses Dashboard. You can also update values directly in the All Apps table.
Note
Each new upload overrides the previous CSV. To add information rather than replace it, update the existing CSV first, then re-upload it.
Supported Apps and License Types
Most license management tools track logins rather than actual behavior and usage patterns. Discovery gives you that added scope, letting you see not just how many users access an app, but how often and for how long. This becomes critical when it's time to manage licenses, whether you're cutting them or reassigning them.
The License Optimization Dashboard supports all apps for license analysis. WalkMe automatically identifies most apps when you download the CSV template. If an app isn't identified, it won't appear in the dashboard even if it's in your CSV. In this case, open a Support ticket, and WalkMe will add the app to the app manager for future analysis.
If an app has multiple license types, such as edit, view, or admin permissions, the WalkMe team will work with you to configure these rules.
Technical properties WalkMe can track to differentiate license types:
- URLs: A user with a specific license type can access a unique URL that other license types can't
- Example, ServiceNow: Agents visit URLs containing "/workspace/agent"
- Buttons: A user with a specific license type can select a unique button that other license types can't, for example create, export, or edit
- Example, ServiceNow: Approvers interact with "Approve" buttons
There are several ways to add license type rules for an app:
- WalkMe can offer a screen-share to review your setup together, recommended if you're not technical and want to learn how to inspect the page and check HTML values
- You can investigate on your own, offline
- You can share access to apps with various license type permissions so WalkMe can review them offline
- You can share lists of users by license type so WalkMe can review their analytics for unique differences
Note
Desktop app license analysis isn't supported.