Brief Overview
WalkMe Discovery gives you full visibility into your company's tech stack and how your employees use it, so you can make data-driven decisions and execute your digital adoption strategy.
As the starting point for integrating WalkMe solutions across your platforms, Discovery's insights help you rationalize your tech portfolio and get more from your software investments, whether you're cutting costs or improving adoption.
This guide breaks down each part of Discovery to help you get started.
WalkMe Discovery
Access
Access Discovery in the console:
- Open the WalkMe Console
- Go to the Analytics category
- Select Discovery
How It Works
Use Discovery to see how each application in your tech stack is used, based on user activity, department, category, and licenses.
Once you access Discovery, you can reach the following pages:
- Apps: High-level visibility into user engagement for each application in your tech stack
- Licenses: Aggregated license data to help you optimize cost or find efficiency savings
- Users: How individual employees engage with your tech stack
- Departments: An overview of how your tech stack is spread across departments
- Settings: Configure data collection and add integrations
Apps Page
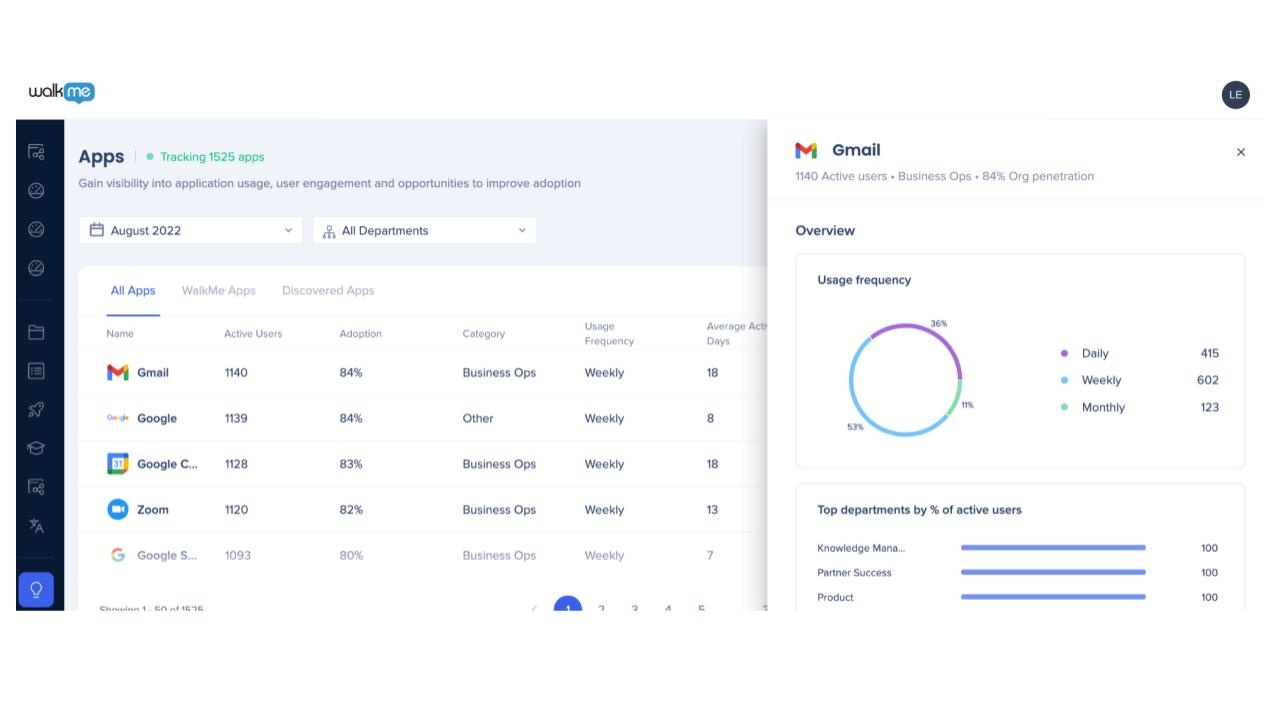
The Apps page gives you a full view of each app's performance, including active users, organization usage, frequency of use, and weekly time spent. Select an app to see a detailed usage breakdown.
WalkMe Discovery: Apps Dashboard
Licenses Dashboard
Identify inefficiencies and cost-saving opportunities in your software spending with the Licenses Optimization Dashboard, whether that means cutting costs on specific apps, consolidating tools across teams, or reallocating licenses instead of buying more.
Compare the license data you provide against actual usage to spot inefficiencies instantly and optimize how you spend on software.
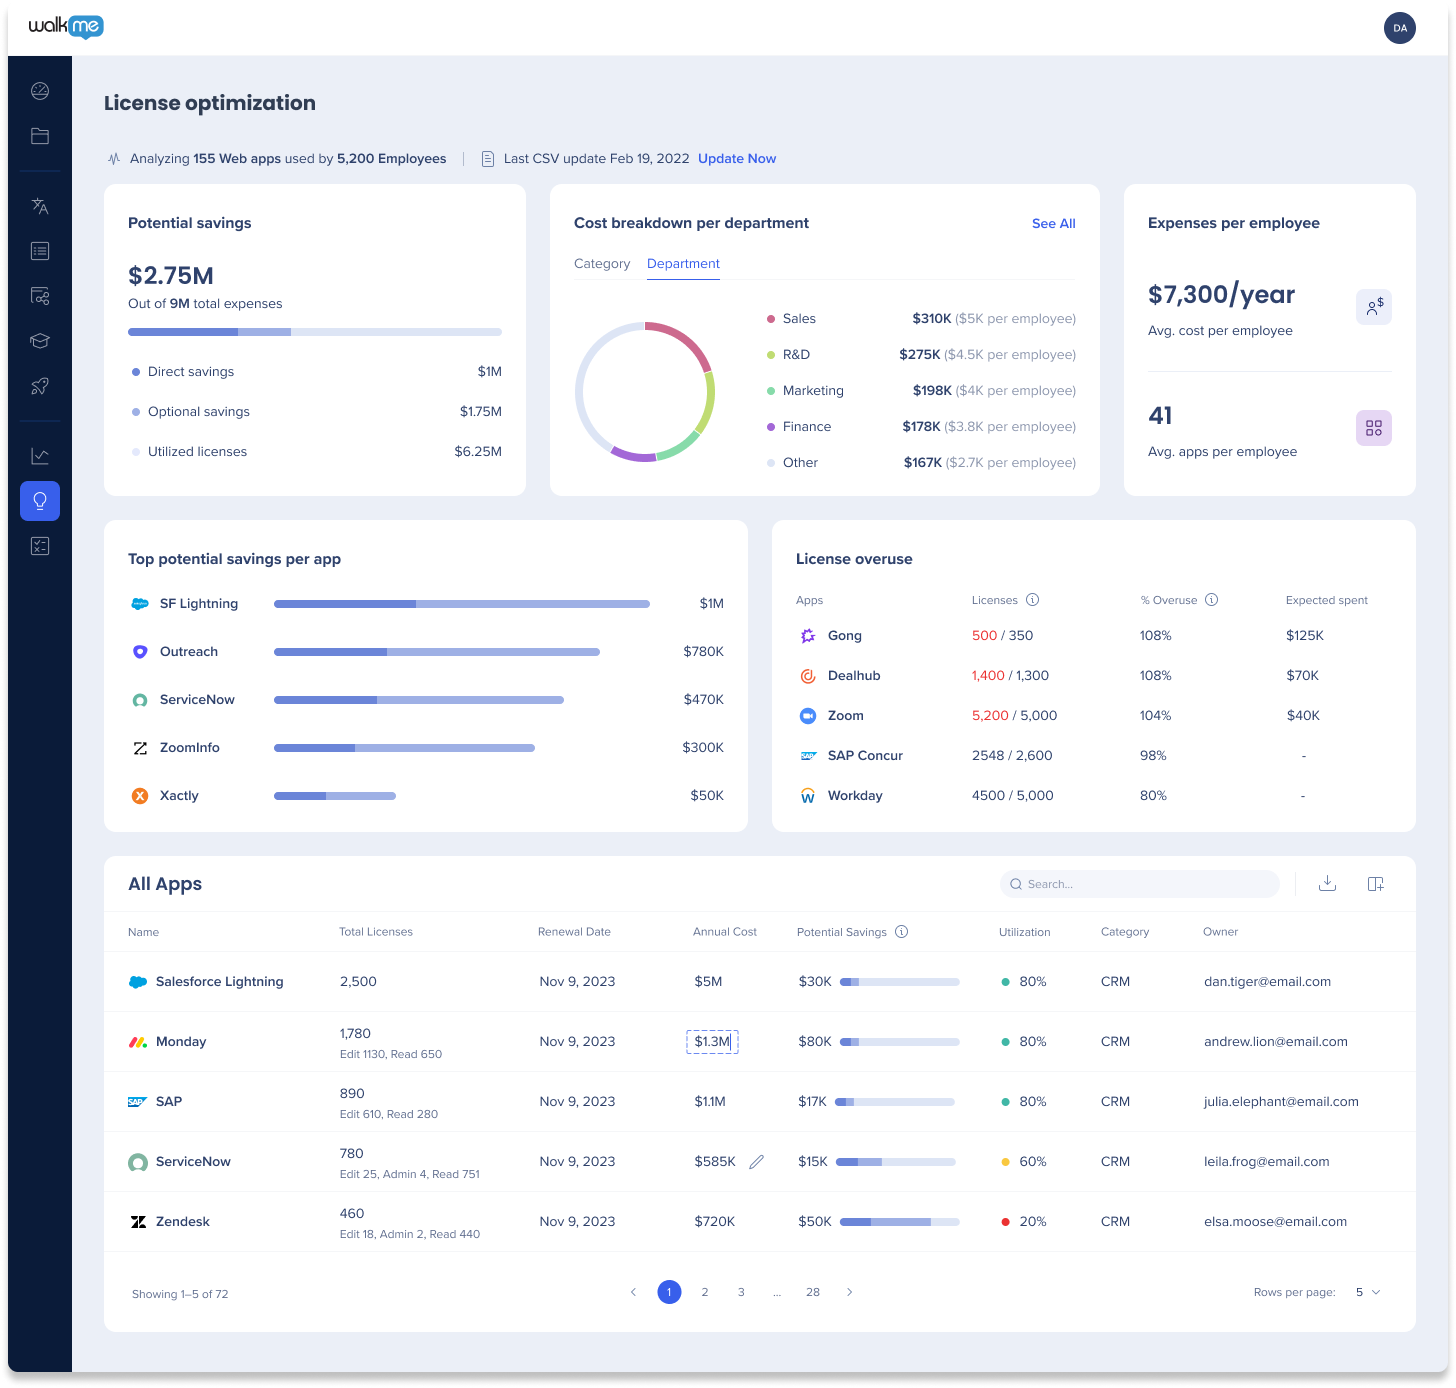
From the licenses dashboard, you can see:
- Total potential savings: Unused and underutilized licenses, based on users who aren't using the software effectively, plus the added cost of higher-access licenses users don't need, for example admin access when only view access is required
- Cost breakdown by department: A quick overview of each department's spend
- Cost per employee: Total cost of software licenses per user
- Apps with the most potential savings: The top 5 apps with the highest potential savings
- All apps table: Every app Discovery identified, broken down by licenses and costs
WalkMe Discovery: Licenses Optimization Dashboard
Users Page
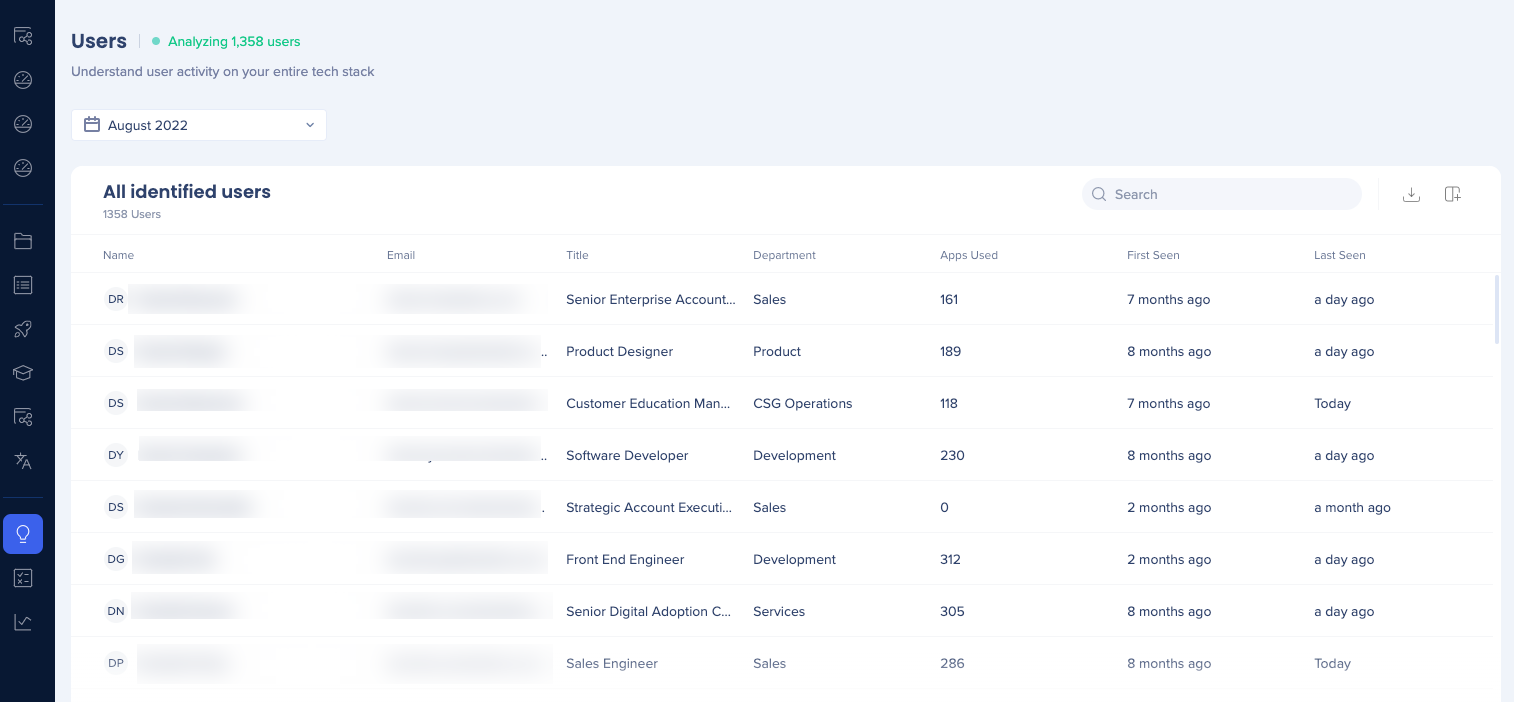
The Users page shows user activity across your tech stack, including name, email, job title, department, and the number of unique applications each user uses. Select the number of apps used for a specific user to see their detailed usage patterns.
WalkMe Discovery: Users
Departments Page
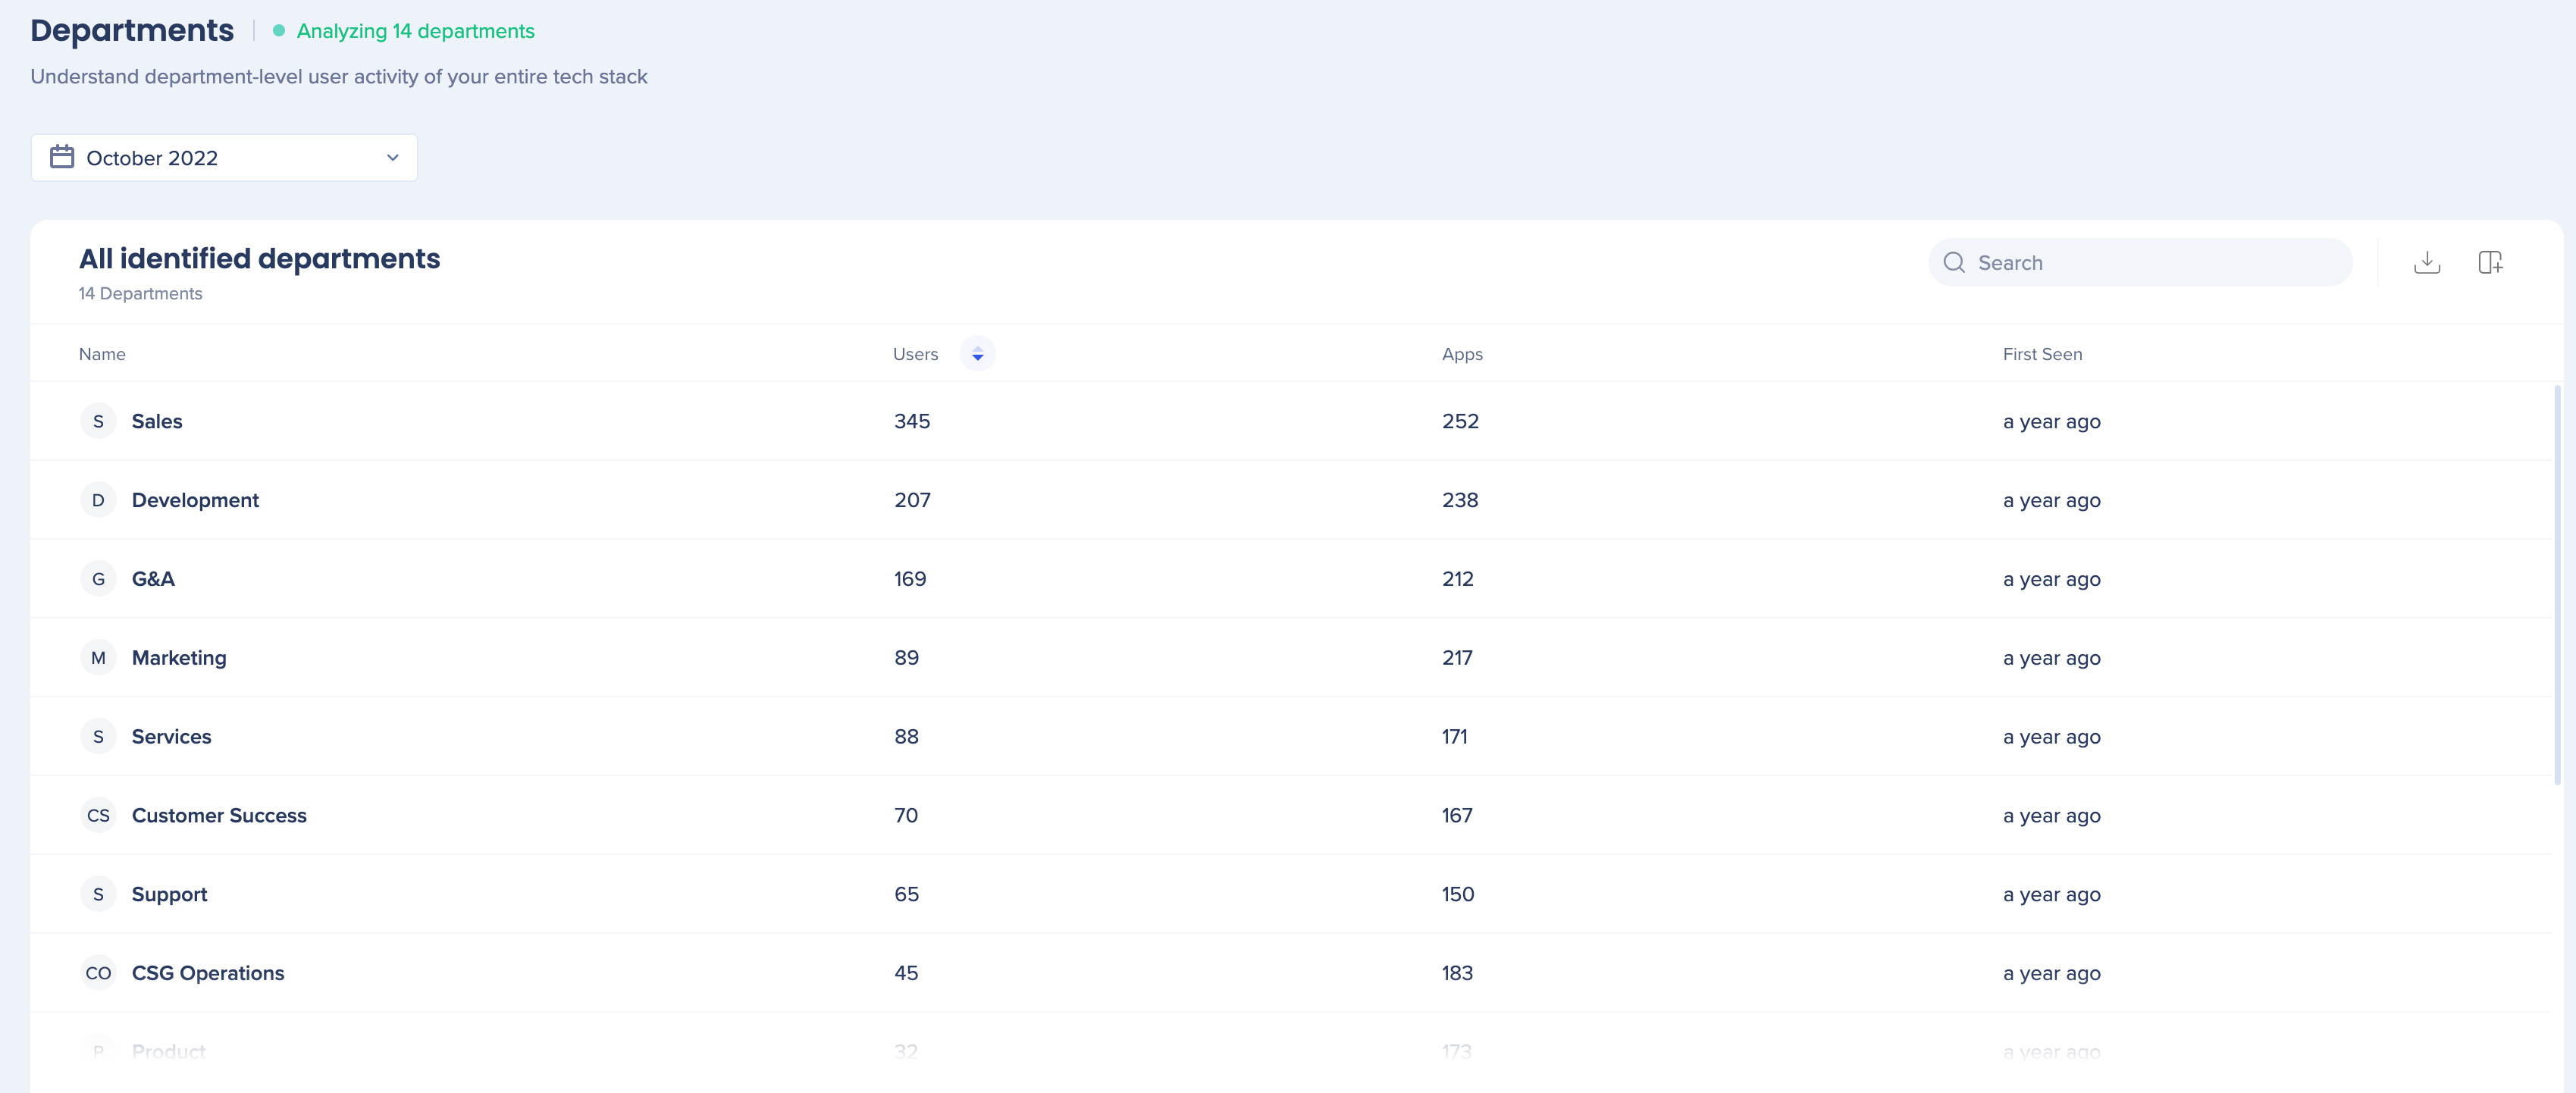
The Departments page shows application usage within each department, including department names, number of users, number of unique applications used, and each department's earliest recorded activity.
WalkMe Discovery: Departments
Settings
The Settings page lets you add integrations and configure data collection for your Discovery dashboards. Integrations serve as Discovery's data source and improve data accuracy:
- The WalkMe Extension identifies users and their activity
- The Licenses integration is where you upload a CSV with app IDs, app names, license counts, and license costs, which is then combined with Extension data and displayed in the Licenses Optimization Dashboard
You can also configure:
- Users and Departments data collection: Identified users have their details collected and displayed, which requires IDP or an employee list CSV upload. Hashed users have their activity collected and displayed without user details. Departments also require IDP or a CSV upload for detail collection
- Block list: Exclude data collection for specific apps
- Hide list: Remove apps from the dashboard
- Org usage threshold: Set a minimum usage percentage for apps to appear in the dashboard
- Data source priority: Choose whether IDP or CSV takes priority as your data source
WalkMe Discovery: Settings Page