Brief Overview
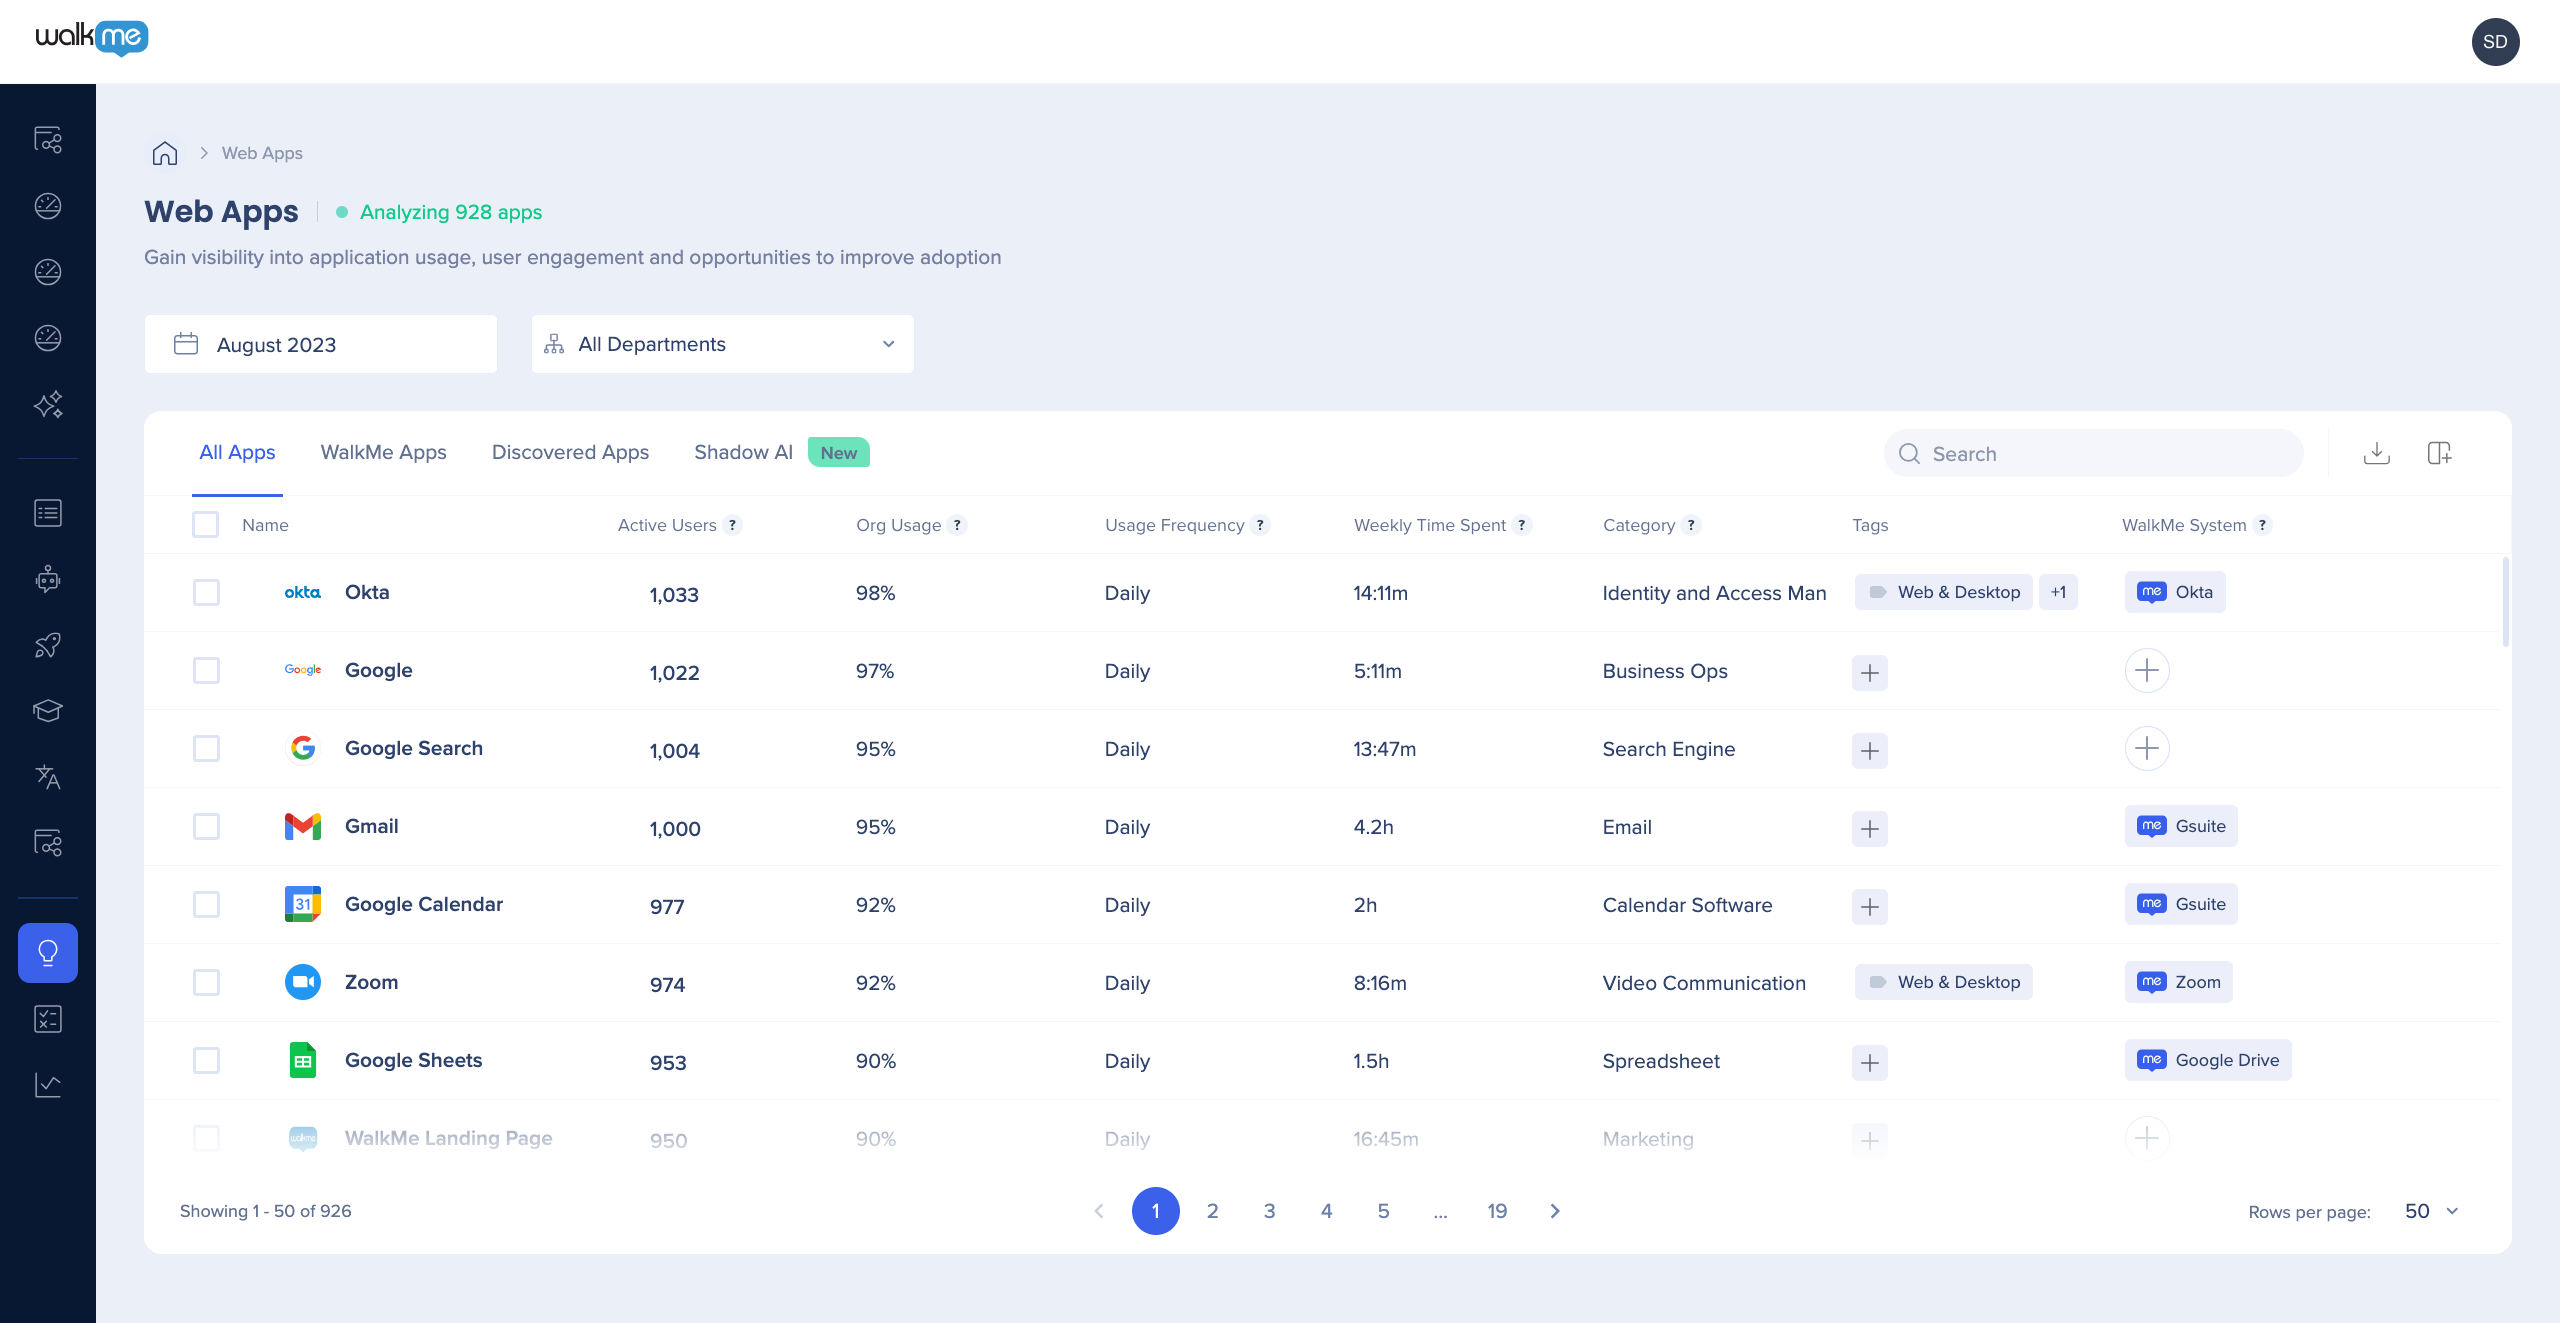
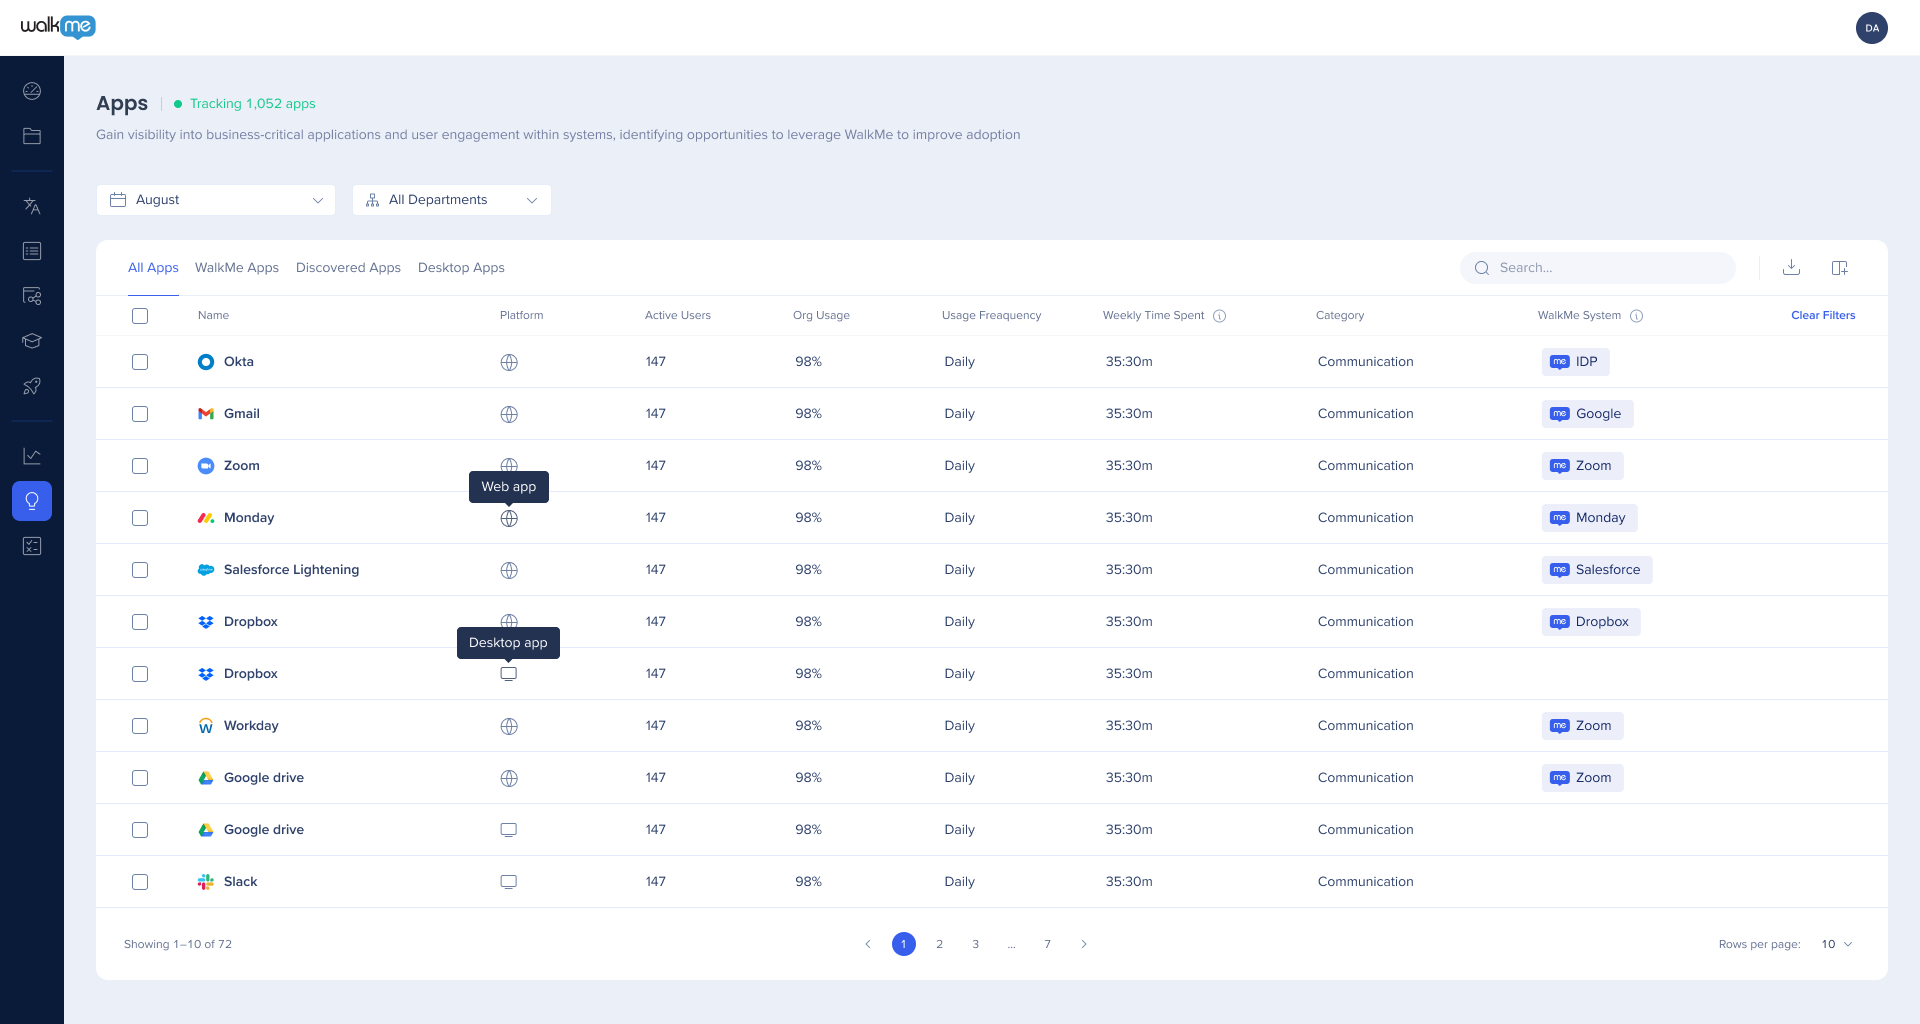
The WalkMe Discovery Apps Dashboard gives you a full view of each app's performance, including active users, organization usage, frequency of use, and weekly time spent. It also shows each app's category and whether a WalkMe system exists for it. Select an app to see a detailed usage breakdown.
WalkMe Discovery
How It Works
The Apps Dashboard centers on a table listing every application used across your organization, with key usage metrics in each column:
- Name: Application display name
- Unrecognized apps display their domain instead
- Active Users: Unique users who used the app during the selected date range
- Org Usage: Percentage of the organization using the app
- Active users divided by all users identified in the organization
- Usage Frequency: How often most users use the app during the date range
- Calculated as active days divided by total days
- Daily: over 0.4
- Weekly: 0.14–0.4
- Monthly: under 0.14
- Average Active Days: Average days an active user uses the app in the date range
- Weekly Time Spent: Average minutes or hours per week an active user spends in the app
- Category: Application category
- Unknown categories display as "Other"
- Tags: Labels you create and add to an app for organization
- WalkMe System: Shows whether a WalkMe system exists for an app
- Select the plus sign to create one
Switch tabs for a different view:
- WalkMe Apps: Apps with a WalkMe system
- Discovered Apps: Apps without one
Discovery auto-populates icons, categories, and descriptions for known apps. You can edit this manually for unknown or homegrown apps.
Actions and filters
From the dashboard, search apps by name and export data to CSV or XLSX. You can also sort, filter, and manage columns, view all active users for an app, and edit app attributes using the pencil icon on hover. Select anywhere on an app row to open the side panel for more details.
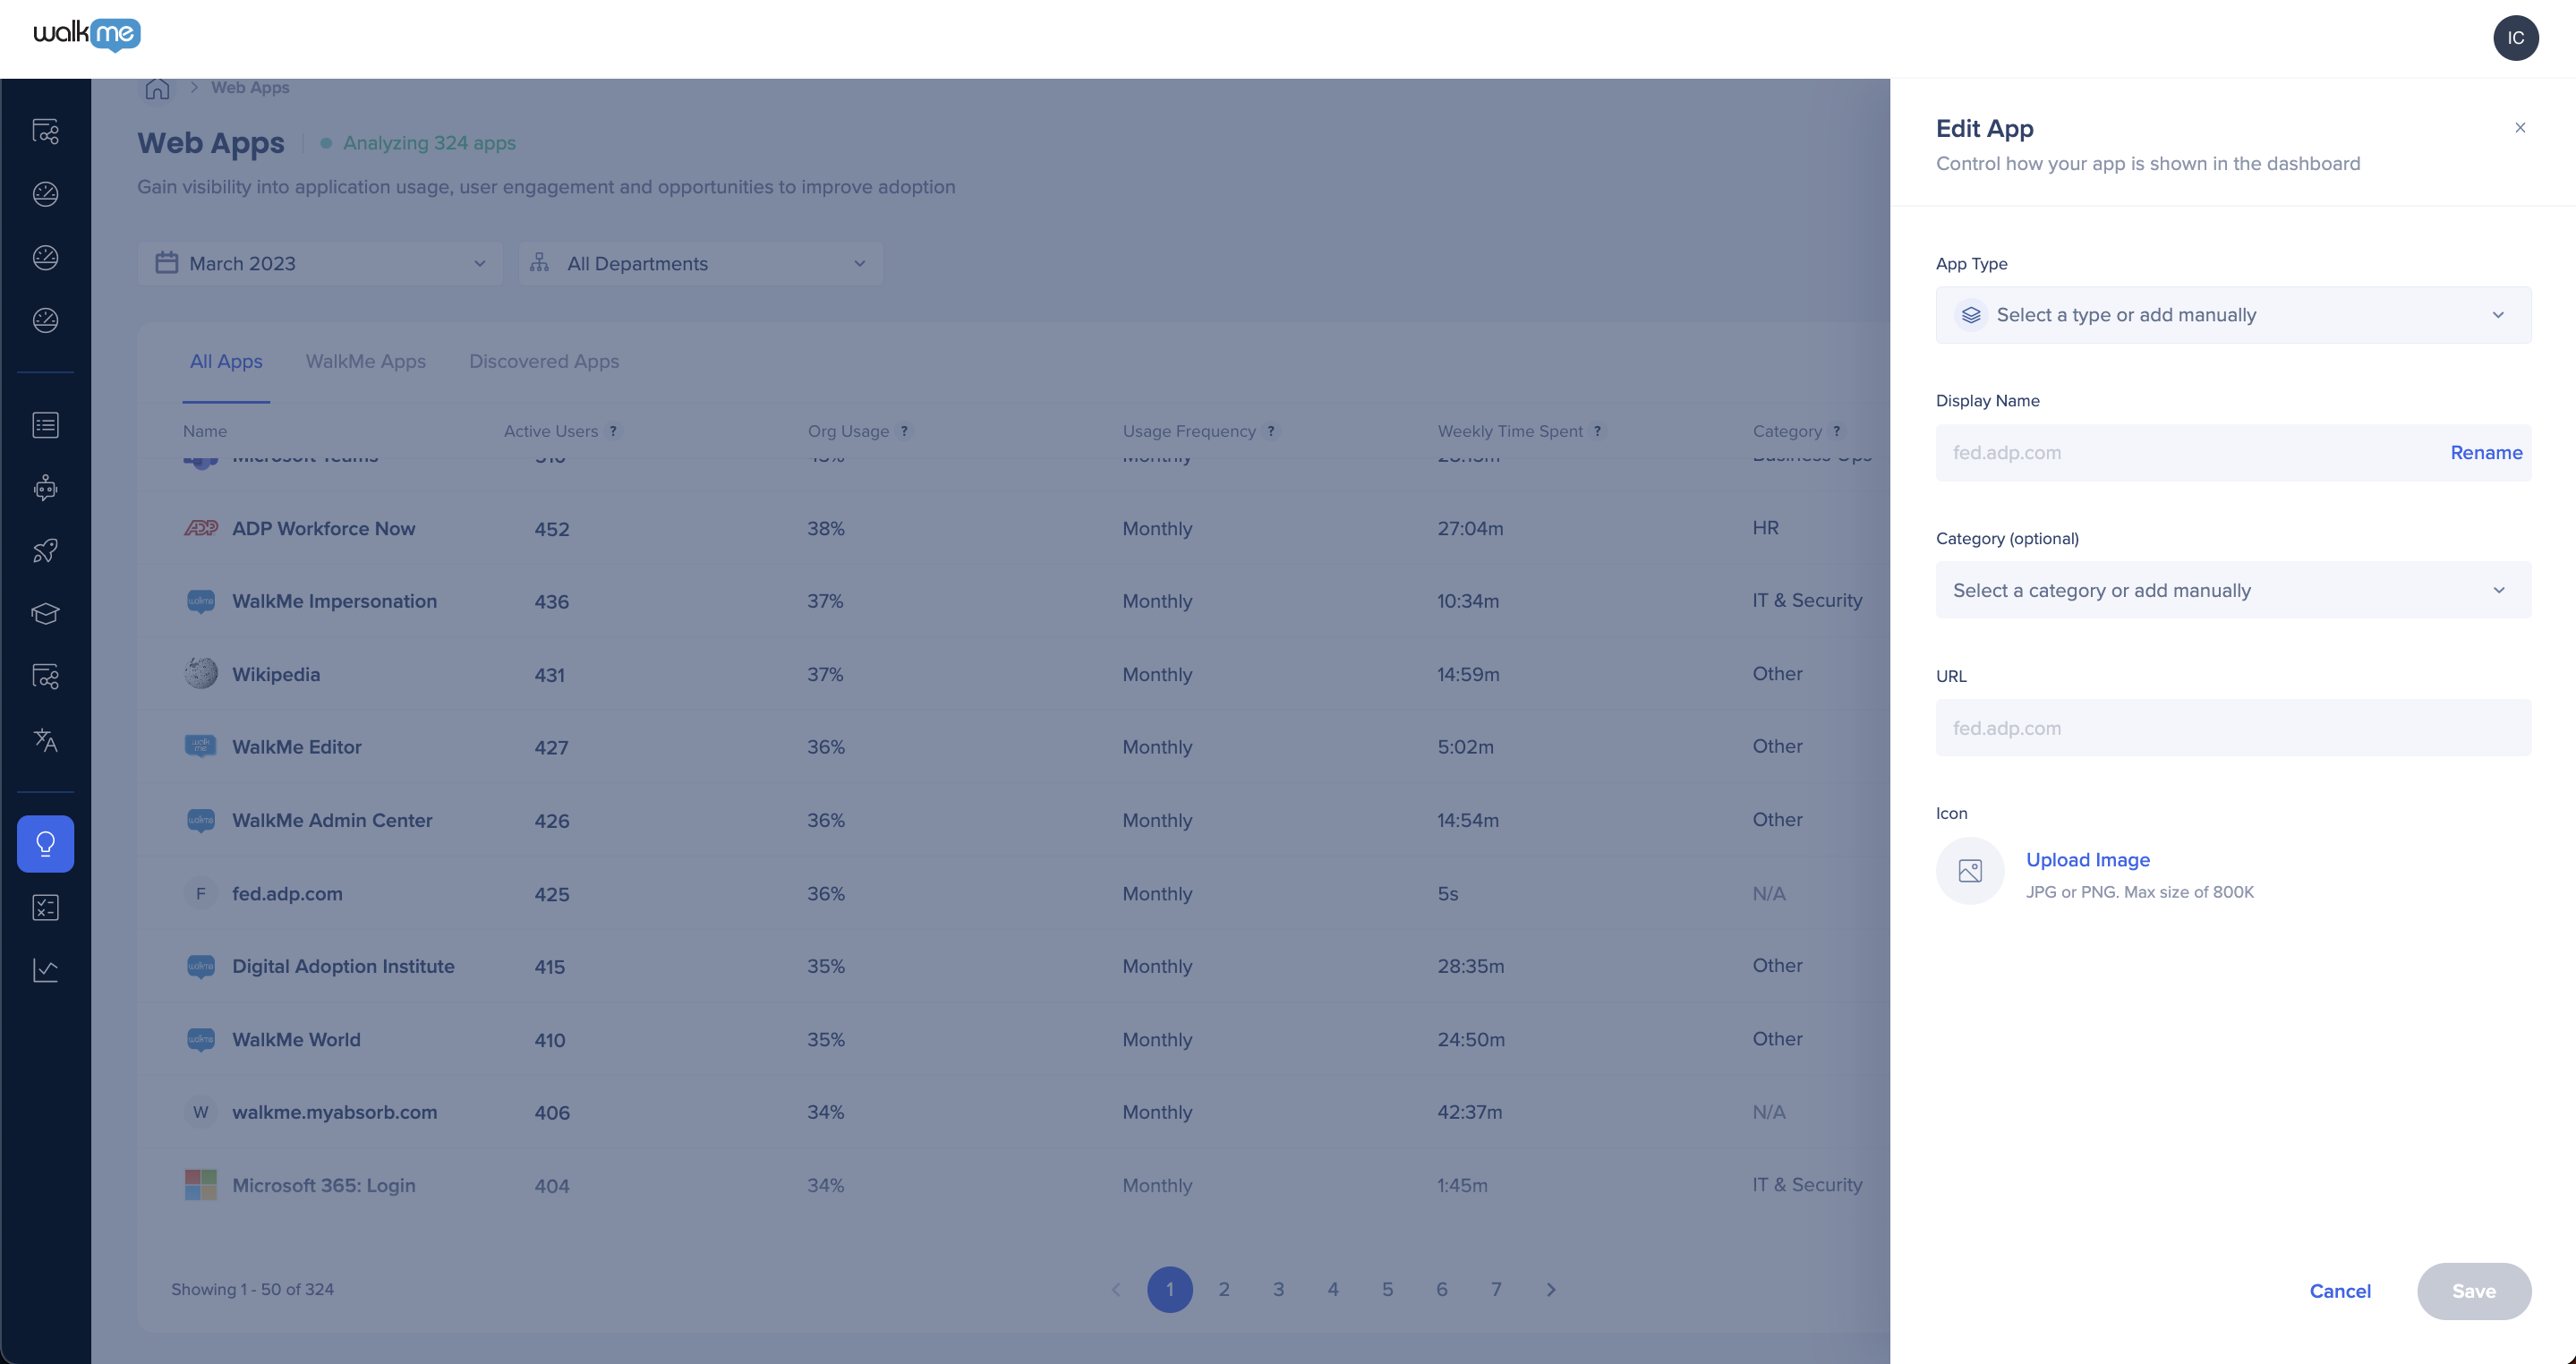
You can also manage apps in your tech stack by hiding, blocking, grouping, or tagging them.
Hover over an app row and select the options menu to access:
- Edit app
- Hide app
- Add to blocklist
Edit: Update the app's display name, category, URL, or icon
Hide: Select Hide App to remove an app from the dashboard
- Hidden apps still collect data
- Manage hidden apps from the Display tab in Discovery Settings
Block: Select Add to Blocklist to block an app from the dashboard
- Blocked apps stop collecting data
- Manage blocked apps from the Display tab in Discovery Settings
- (Optional) Add a reason for blocking; edit it any time from the blocklist in Settings
Group: Select apps, then select Group to organize them together
Use cases:
- Group unidentified apps under the same WalkMe system
- Group related apps from the same vendor, for example Microsoft or Adobe
- Group apps with similar functionality
Grouping creates a parent row that combines data and metrics from each grouped app, recalculated within 24 hours. Each app keeps its own row, and you can edit the parent row's name, icon, and category. To remove an app from a group, ungroup all apps first, then regroup the ones you want.
Custom Apps lets you define apps using a URL rule or set of URL rules.
WalkMe Discovery: Custom Apps
Expanded Apps View
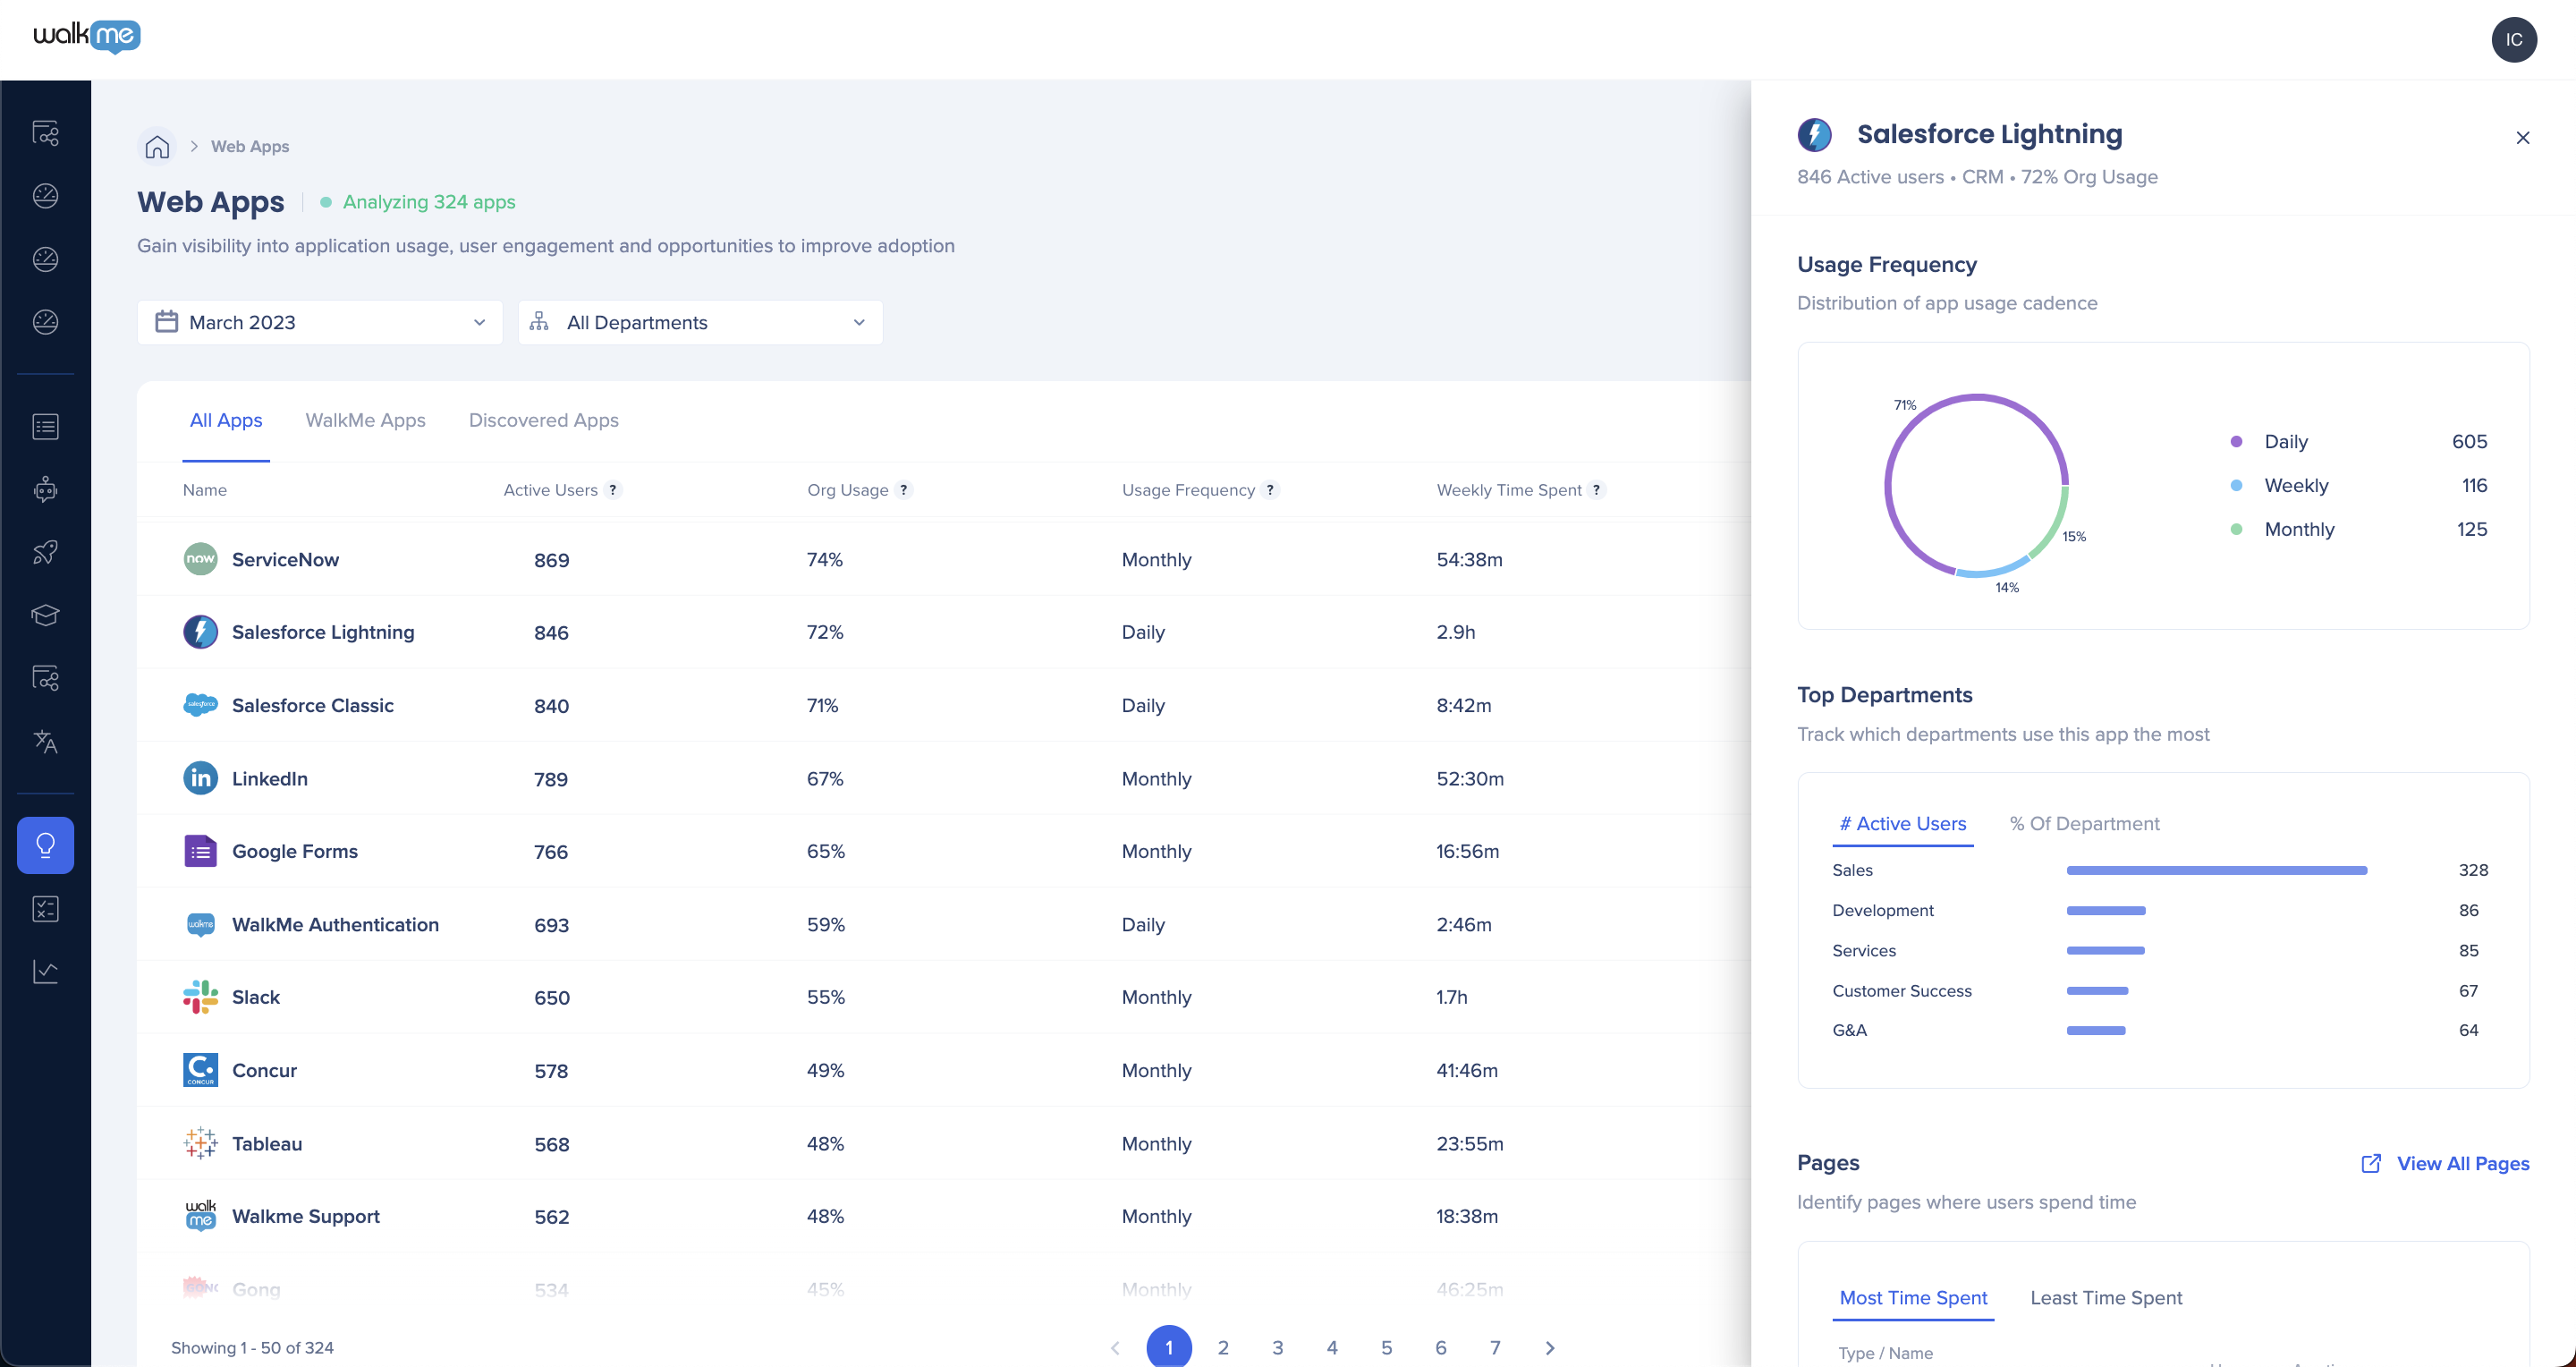
Select an app to expand the side panel and see detailed usage data, including usage frequency, department breakdown, pages, related DAP projects, tracked user actions, and form analysis.
Usage frequency
Percentage breakdown of how often users use the app during the date range, calculated as active days divided by total days:
- Daily: over 0.4
- Weekly: 0.14–0.4
- Monthly: under 0.14
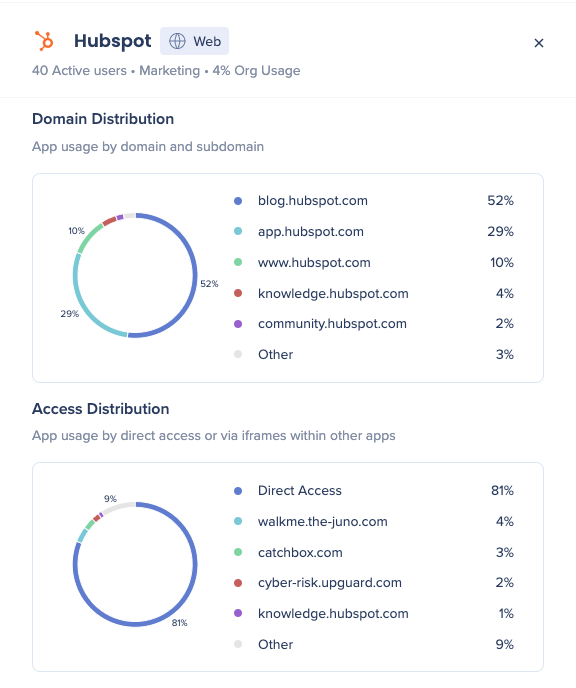
Domain distribution
Shows the top 5 domains or subdomains by user activity. You can create custom apps based on this data.
Access distribution
Shows apps accessed via an iframe within this app.
- Data collection starts once the iframe gains focus and stops when the user leaves it, switches tabs, or selects the outer frame
- Time is tracked simultaneously for the outer app and the iframe
Department breakdown
Shows the top 5 departments using the app, based on:
- Number of active users
- Percentage of the department's active users out of all department users
Pages
Shows the 5 pages with the most and least time spent by users in the date range:
- Available only for apps with predefined pages, such as Salesforce
- Select View All Pages to see metrics for every page: page name, URL, active users, average time per user, and visits
DAP projects
Shows up to 3 active projects related to this system. Select Go To Digital Adoption Projects to explore them.
Tracked user actions
Shows the 5 most recent tracked events with 7-day metrics, a range that isn't adjustable: users, number of interactions, and trend. Select Go to Tracked Events to manage them.
Shows the top 3 most used forms with views and active time spent. Select Go to UI Intelligence to view all forms.
- Available only for UII-supported applications
WalkMe features utilization
Shows a score breakdown of WalkMe feature usage by category:
- Automation: Auto-Step click and autofill steps used in published Smart Walk-Thrus
- Content: Use of Auto Play, Goals, Keywords, Launchers, ShoutOuts, SmartTips, and Start Points
- 0 points for none, 15 for 1–6, 30 for all 7
- Measurement: At least one tracked event in use
- Identification: UUID configured
- Integrations: Integration set up in Insights
Hover over the score to see category weights and breakdowns.
Pre-built solution templates
Shows the most common solution accelerators for the app type, for example Salesforce Lightning. Select Go to Solution Accelerators or a listed option to open it in the editor.
Desktop Apps
Discovery gives visibility into desktop app use through the desktop menu:
- See which desktop apps your employees use
- Analyze active users, usage frequency, and time spent per app
- Group usage across web and desktop versions of the same app
Prerequisites
- Discovery enabled
- WalkMe Menu for Desktop enabled
Limitations
- Discovery doesn't support system creation
- Discovery doesn't support license analysis
- Discovery doesn't support Shadow AI
The desktop menu client must be active for Discovery to display desktop app usage.