Brief Overview
Communication Center Analytics provides valuable insights into notification performance and user engagement, including metrics such as:
- How many recipients were targeted
- How many received the notification
- How many viewed the notification
- How many clicked on the buttons
These analytics cover both desktop and mobile menu views, helping you optimize communication strategies and enhance user interactions.
Get to Know
Upon entering the Communication Center, you'll see a panel on the side that displays analytics for all of your notifications. You can get further insights into each notification by clicking on it.
Let's take a look at what kind of analytics the ComCenter provides.
Communications Overview
ComCenter Analytics provides valuable insights on your notifications' performance, including total notifications published, active audiences, recipients, engagement rates, received rates, and viewed rates. The analytics also distinguish between Legacy and Electron Workstation sessions for comprehensive reporting.
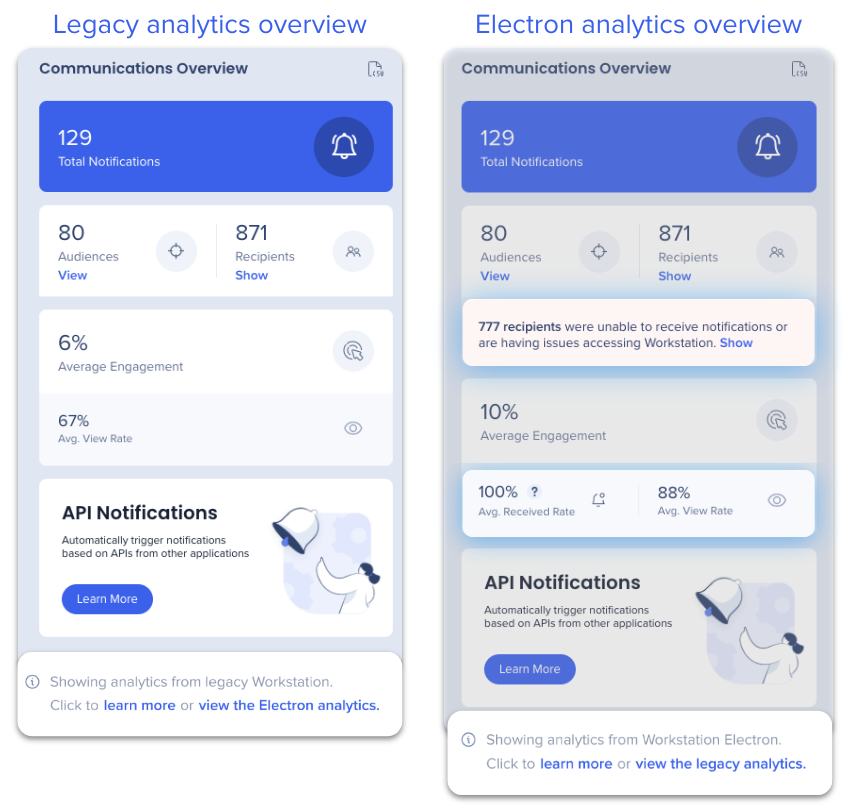
Electron analytics is the default view, but you can toggle between the two.
- Total Notifications: Number of active, scheduled, and completed notifications that have been sent or scheduled to be sent, excludes archives and drafts
- Audiences: Total number of active audiences. Refreshed live
- Recipients: Total number of individuals who have been sent a notification (including those that are in an audience). Refreshed on page open
- View recipients who are not receiving notifications: All potential menu participants. Refreshed on page open
- Inactive users are not included
- See Recipients Activity section for more detail
- Average Engagement: Percentage of unique users who clicked an action button in a notification versus the total number of users who viewed the notifications. Refreshed in real-time, but may not appear immediately
- See Notification Insights section for more detail
- Avg. Received Rate: . Refreshed in real-time, but may not appear immediately
- See Notification Insights section for more detail
- Avg. Viewed Rate: Percentage of employees that have viewed the notification versus the number that received the notification but not viewed
- See Notification Insights section for more detail
Additional Terms
- Start date: Date the notification became active (either sent or scheduled to start that day)
- Completed notifications: Notifications that have reached their end date or have been marked as done
Legacy Analytics Behavior
Notification analytics for the Legacy Workstation, both the overview and individual notification, are available in Insights only. The Insights report will show sessions for both the Legacy Workstation and Electron Menu. To filter the Insights reports to only show users sessions on Legacy Workstation:
- Add a filter condition of "operation system version -> is not -> ELECTRON"
Analytics for Individual Notifications
View individual notification analytics by clicking on the notification.
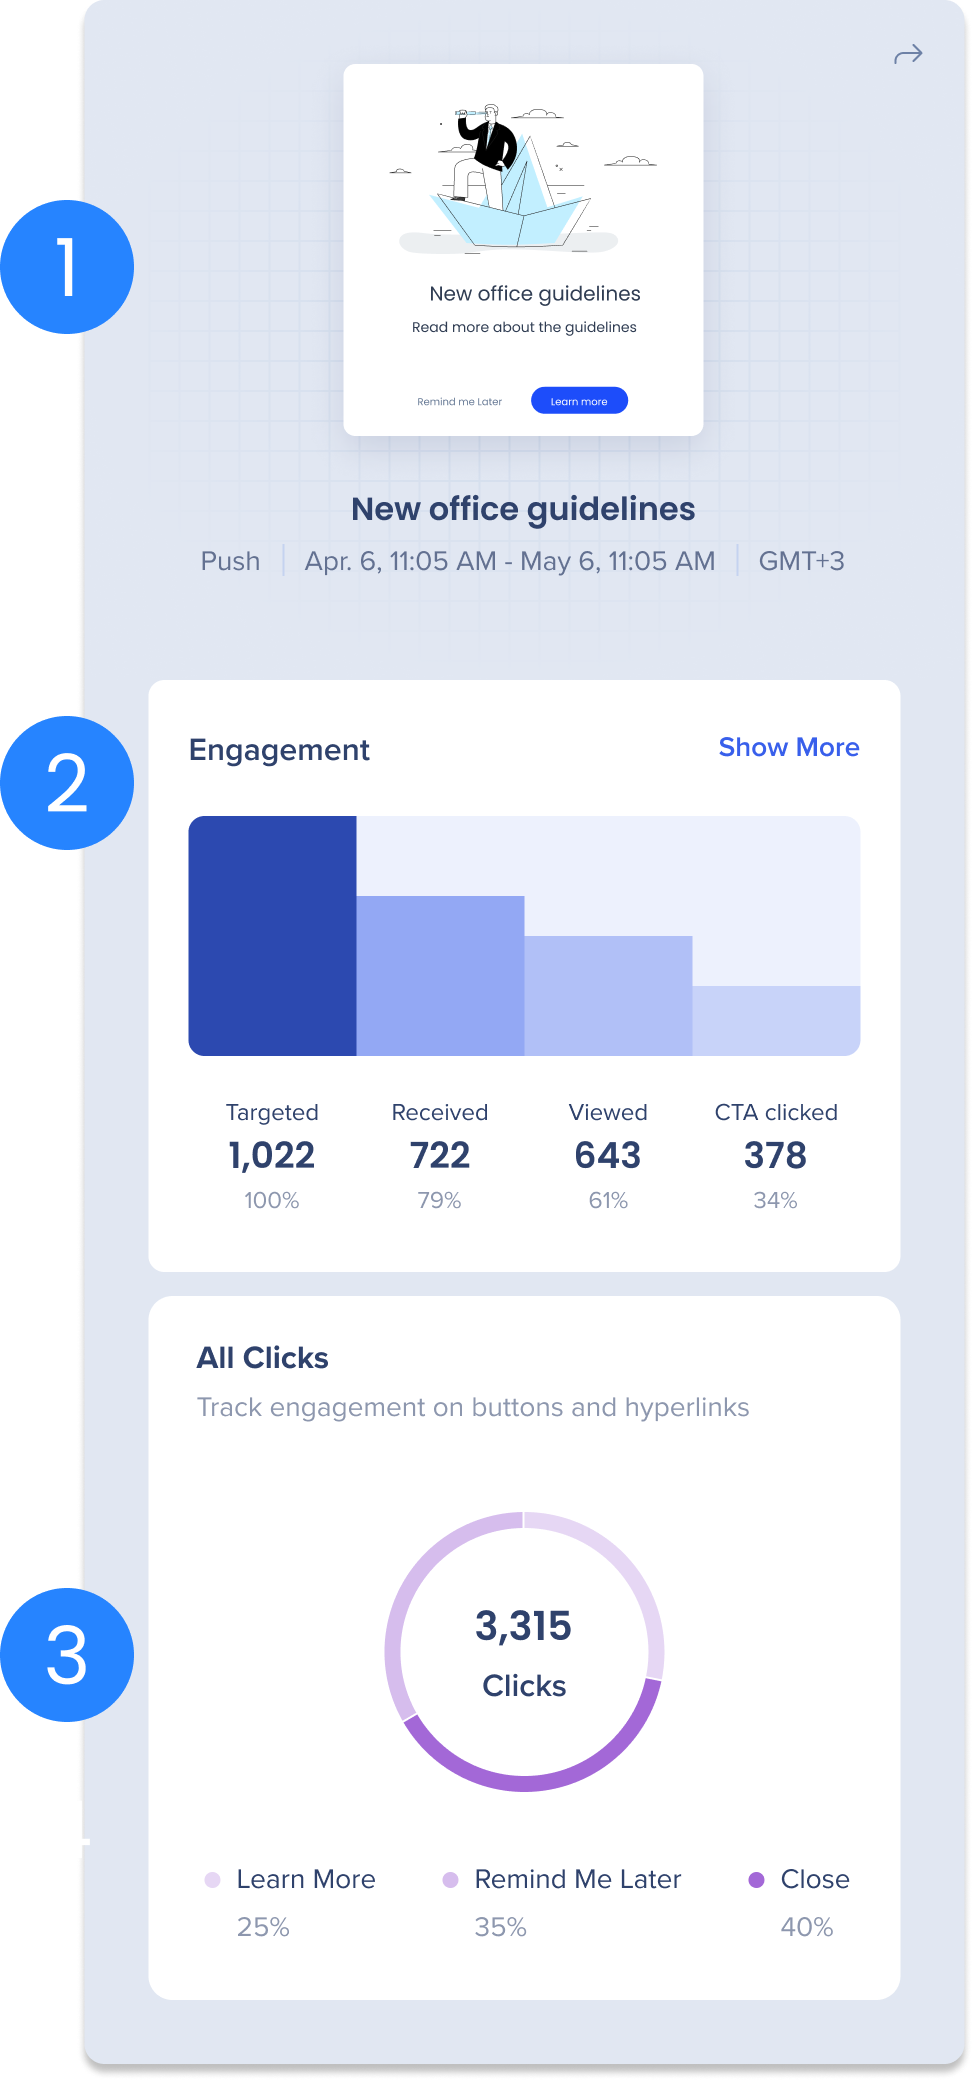
(1) Preview the notification
See a preview of the notification including the type of notification, the date range and time it was sent
(2) Engagement
The bar graph provides insights into the performance of notifications, including the number of targeted recipients, recipients who received the notification, those who viewed the notification, and those who clicked on the main call to action button.
Hover over one of the bars to see a tooltip with an explanation of each metric and views for Desktop and Mobile.
Read more about each engagement analytic by expanding the dropdown.
Targeted: Number of eligible recipients during the notification's life cycle
Learn more about targeted recipients...
A recipient is targeted if they are an active the desktop and mobile menu user that is listed in the selected audience or as an individual recipient. The targeted recipients number changes based on if new users are added to the audience, or if a user becomes active during a notification's lifetime.
- See Recipients Activity section for more details on who is considered an active user.
Received: Number of recipients the notification was delivered to
Learn more about received...
A notification is considered 'Received' if the recipient logged into the desktop and mobile menu while the notification was live.
For example, if a notification is scheduled to be live for 7 days, as long as the recipient logins before the end of day 7, they'll receive it. The notification will be in the Notification page. If, however, they log into the desktop and mobile menu after the notification's timeline ended (day 8), they won't receive it and the notification will no longer be accessible in the Notification page.
Viewed: Number of recipients who viewed the full notification
Learn more about viewed...
A notification is considered 'Viewed' if the recipient viewed the full notification, which can happen if they: (a) Saw the notification popup on their desktop when it was initially sent (b) Opened the notification from the Notification page in the desktop and mobile menu. Hover over the Viewed column to see Mobile vs Desktop engagement: 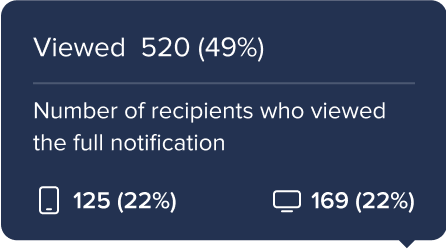
CTA Clicked: Number of recipients who clicked on the main call to action button
Engagement Show more button
Learn more about the Show more button....
Click the Show more to open a popup that lists the top 50 recipients with the highest number of clicks on this notification, how many times they viewed the notification, and how many times they clicked the call to action. Search for any recipient in the search bar to see their engagement, even if they aren't in the top 50.
Click export CSV to download the engagement of all recipients of the notification.
(3) All Clicks
Pie chart breaking down the total number of clicks on each button or hyperlink in the notification.
- Only buttons with the following actions are included in the calculation:
- Remind Me Next Time
- Remind Me Next Day
- Close
- Open Menu (not available on Mobile)
- In-line hyperlinks (shows URL as item label)
If there are connectivity issues...
On rare occasions, we might have a click event without a view event. This is normally due to a internet connection issue that caused the view event to be missed.
Why is the targeted number the same on both legacy and electron?
Click here to learn more about the differences between the analytics....
The received, viewed & click metrics are based on events triggered by recipients who engaged with the notification. The numbers are different when you switch between the two analytics based on if the recipient engagement occurred on the legacy or electron version.
The Targeted number is the number of active (and targeted) recipients at the time of publishing the notification, regardless of which menu version they are using. ComCenter supports showing active users from both legacy and electron version, that number is the same on both legacy and new analytics modes and encompass users from all supported versions.
If you see events for that content coming from Electron menu, but know they have fewer users with the new Electron version of WS than whats reported, then that might indicate an issue.
Recipients Activity
You can view the recipients activity for any Audience (including All Recipients).
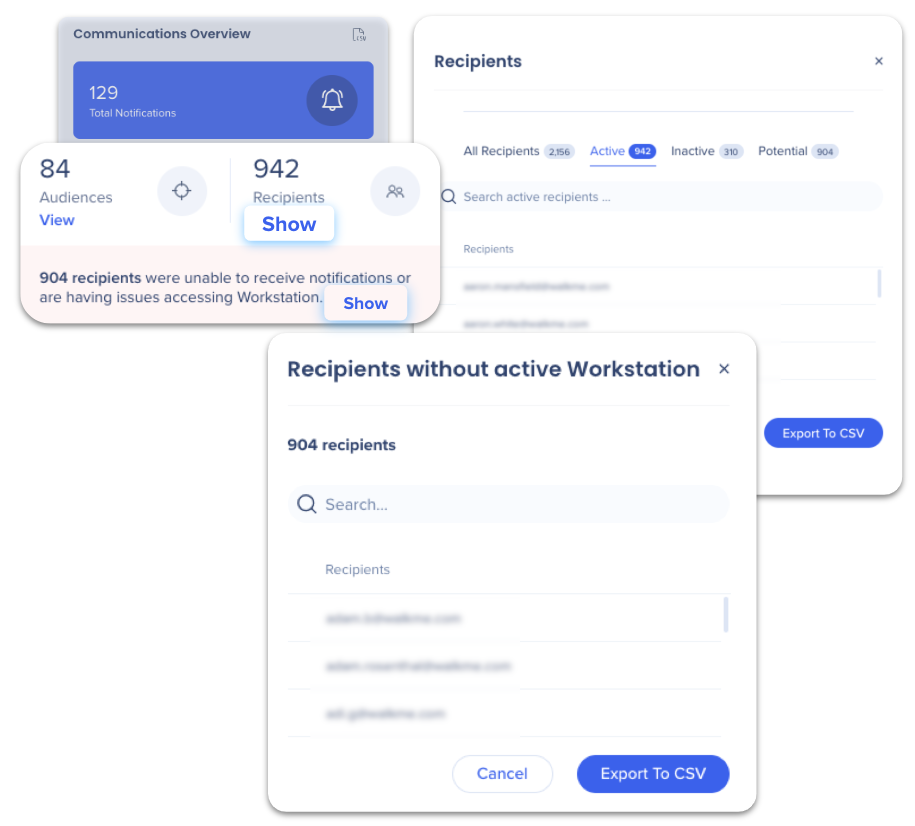
From the ComCenter Overview:
- Go to the analytics panel to the right
- a. Under Recipients click Show to view all recipient activity
b. Next to the recipients who were unable to receive notifications, click Show to view a list of recipients without an active menu
What are the definitions?
-
- Inactive: Last WS activity was more than 30 days ago, but less than 180 days
- Potential: No WS activity detected, or last session was over 180 days ago
- This is also the recipients without active desktop and mobile menu
Click here to learn more about potential vs inactive users...
Potential vs. Inactive users: An inactive user is any user that was active, but last time they loaded or logged into the desktop and mobile menu was more 30 days ago and less than 180 days. After 180 days, the inactive user becomes a potential tab.
Users that have never logged into the desktop and mobile menu, but their identifier is known to us from sources external to the IDP (for example, integration center CSV upload), are considered potential users.
Export to CSV
- Export will pull the list of recipients from the selected tab
- Export will include:
- ID (email)
- status (active, inactive, potential)
- last active - date + time
How to Export Analytics to CSV
From the Notifications page → Communications Overview:
- Click export to CSV icon
- Fill out the form:
a. Select the date range of the data you'd like to export
b. Type emails of users who will receive the data
c. Add a note that will be included in the email
- Click Export CSV & Send.
Click to see which data will be included in the CSV...
Data that will be included in the CSV:
- Notification ID
- Notification title
- External title
- Creator
- Created date
- Last modified
- Publish date
- Type
- Status
- Received
- Viewed
- Clicked
- Engagement rate
Audience export limitation
Only up to 10,000 recipients can be exported. Customers are requested to reach out to their CSM for larger reports.
Frequently Asked Questions
Question: Why do the numbers differ between the dashboard and the CSV report?
Answer: The dashboard and the Engagement CSV report can show different numbers because they count views over different time ranges and, for some notification types, count a view at a different moment.
How a view is counted:
-
For Push notifications, the native OS banner appearing does not count as a view. A view is counted only when the notification opens on screen — after a user selects the OS banner or opens the notification from their notifications list
-
For Popup notifications, a view is counted when the notification opens on screen, either automatically or when a user opens it from their notifications list
Time range: By default, the analytics in the right side panel show the last 90 days, while the Engagement CSV report counts from the notification's creation date — so the two can differ for older notifications. To align the panel with the CSV report, the single-notification-analytics-since-creation feature can be turned on in BackOffice so the panel also counts from creation date. This is an enabled feature — to turn it on, reach out to your WalkMe contact.
Question: Why do popup notifications have a higher received rate than viewed rate, even though they appear on the screen (unlike push notifications)?
Answer: There are several reasons why the number of notifications received might be higher than the number viewed in this case:
-
Snooze mode: If notifications are snoozed, they may not be viewed immediately and can accumulate, leading to a higher received count.
-
After the end time: Notifications received after their scheduled end time might not pop up and, as a result, are not viewed.
-
Overlapping notifications: When multiple notifications arrive simultaneously, some may not be viewed because another notification is already displayed on the screen.
-
System or app settings: Certain settings may prevent notifications from being displayed as pop-ups, even if they have been received
-
Network delays: Temporary network delays can cause notifications to be marked as received but not displayed promptly for viewing.
Technical Notes
- Data analytics will only show data from the previous 12 months