Brief Overview
Account-level analytics allows for organization-wide visibility in WalkMe Insights, enabling you to analyze engagement, adoption, and performance not just at the system level, but across entire accounts.
Account-level analytics lets you:
- View aggregate metrics across all systems within an account
- Filter and compare performance by Account Name
- Access a tab dedicated to Account Overview with headline metrics and activity trends
Enablement
You can enable account-level analytics from the Analytics Settings page in the Admin Center.
Analytics Settings
How It Works
Account-level Filter
The Account Name property is now available as a filter across Insights Console dashboards and reports.
- Location: Available in filters for System Overview, Apps dashboards, Account Overview, Active Users, Events, Custom Dashboards, Flow Analytics, and Reports
- How it works: The account filter groups users by their email domain or custom values. This lets you analyze data at the account level instead of just individual users
Data Filtering
Accounts Overview Tab
The Account Overview tab helps you quickly identify which customer accounts are most active, and which ones may need more attention. By showing you trends in account activity, top engaged accounts, and how usage is distributed, it enables you to focus your efforts where they'll have the most impact—whether that's following up with high-value customers or re-engaging low-activity accounts.
Access
- Go to the WalkMe Console
- Select Insights from the left navbar
- Select the Systems Overview page from the left navbar
- Under the Monitored Systems widget, choose a system
- Select the Accounts Overview tab
Headline metrics
Displays account counts broken down by time granularity.
- Average daily accounts (ADA): Average number of unique accounts active per day
Calculation: Total unique accounts / number of days in the selected period
- Average weekly accounts (AWA): Average number of unique accounts active per week
Calculation: Total unique accounts / [(number of days in selected period / 7) rounded up]
- Average monthly accounts (AMA): Average number of unique accounts active per month
Calculation: Total unique accounts / [(days in selected period / 30) rounded up]
- Total unique accounts (TUA): Total number of unique accounts with who were active in the selected period
Note
AWA and AMA show no data if the date range is shorter than 1 week/month.
Top active accounts
View a bar graph of the top 10 accounts with the most active users for this system.
- The bar graph shows the total number of unique users for your most active
accountID's in the selected period
- Bars are ranked and clickable
- Hover over a bar for details on that
accountID
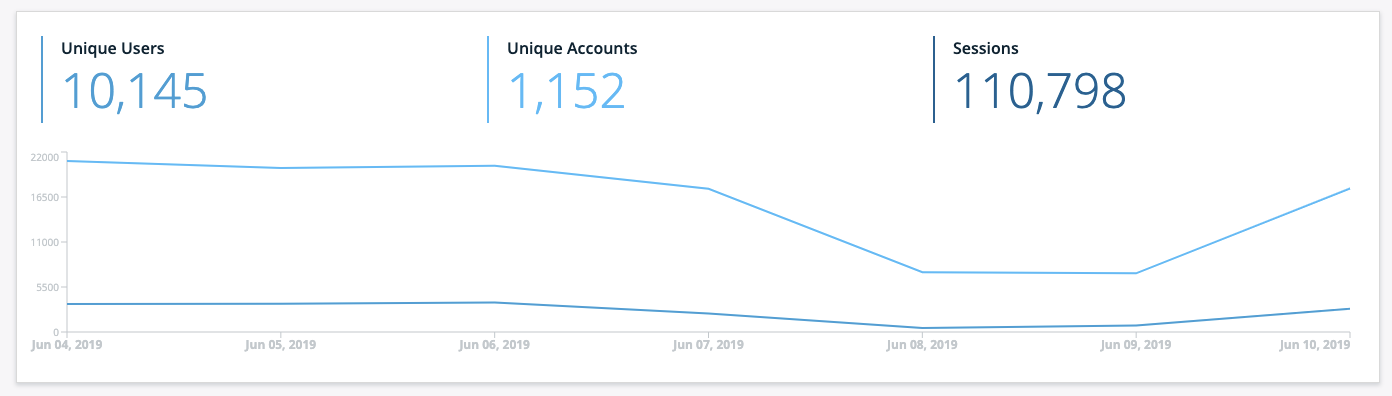
Accounts over time
Track the number of active accounts (unique account IDs) using the site per day over the selected time period.
- The line graph shows the total number of unique
accountID values with at least one active user on each day
- Hover over a date or the accounts number in the line graph to see the exact number of accounts for that time
Active Users Tab
The Active Users tab includes an Account column, adding organizational context to user data and providing a clearer view of engagement trends across accounts.
- Account names can be identified from the user's email domain (for example, @walkme.com) or from a custom value defined by your organization
Insights Active Users Tab
Events Page
The Events page supports account-level data analysis, including the following metrics:
- Accounts Interacted (% of Filtered Accounts): Percentage of unique accounts that interacted with an event
- Calculation: (Unique accounts that interacted / Total filtered accounts) × 100
- Average Interactions per Account: Average number of event interactions per unique account
- Calculation: Total interactions / Unique accounts
Insights Events Page
Reports Page
The User account analytics report is supported in the Reports page of Insights Console.
- User Account List Report: Includes fields such as User Account Name, Total Account Users, First Seen, Last Seen, and Total Account Sessions
- Saved filters including Account Name are supported for both exports and subscriptions
About Reports
Flow Analytics
Flow Analytics supports the Account Name property, letting you visualize user journeys and conversion paths at the account level.
Use cases:
- Segment flows by Account Name
- Compare completion rates between different accounts
- Analyze which departments or client accounts face higher drop-offs
Supported in:
Flow Analytics
Custom Dashboards
You can add account-level filters and widgets to your custom dashboards, combining metrics from multiple systems for a unified view.
Custom Dashboards
Differences Between Insights Classic and Console
| Feature |
Insights Classic |
Insights Console |
| Filters |
Account Name filter available per dashboard |
Same |
| System Overview |
Separate view for accounts |
Account Overview tab with widgets |
| Events |
Columns for Account interacted and Avg. interactions per account |
Same |
| Custom Dashboards |
Not available |
Supported with Account Name filter and widgets |
| Flow/Funnels |
Not available |
Supported through Flow Analytics |
| Reports |
Report name: Accounts List |
Same report metrics but with different name: User Account List Report |
Insights Classic Account-Level Analytics
Supported Methods
Email
- The user identifier is set in the Editor and the assigned value is a standard email
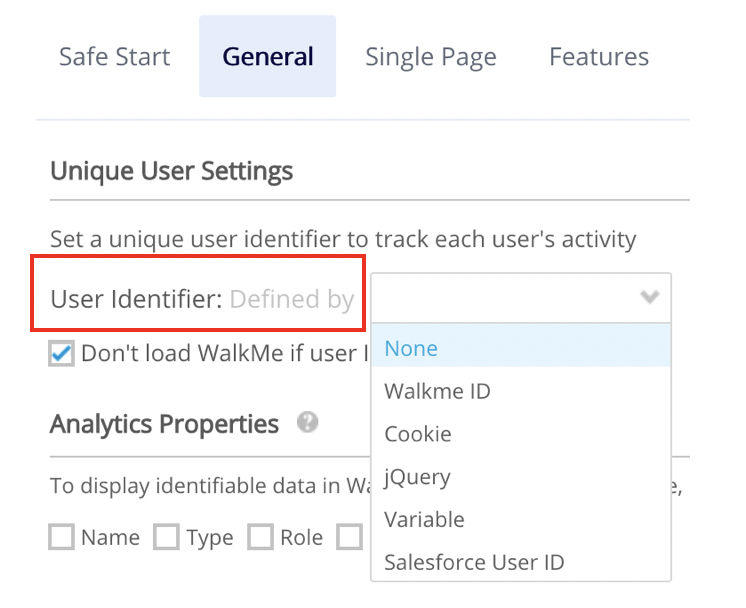
API property
- Supports any JavaScript variable that's accessible via the Window object
- Results will group based on the assigned value (meaning the assigned value should hold the account name and not the email)
- An example of an API parameter that indicates or specifies an account could be something like "account_id" or "account_key"
Activating this Feature in Classic
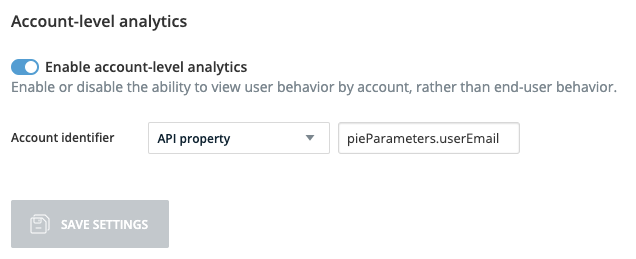
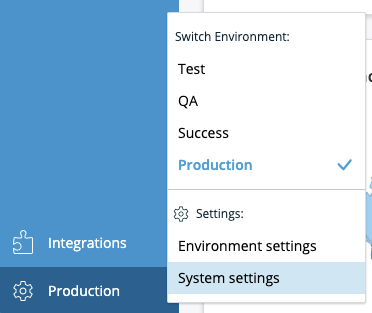
- Open Insights at insights.walkme.com and go to: Production → System settings→ Account level analytics
 Toggle on Enable account-level analytics
- Select the desired Account identifier from the dropdown (Email or API property) and set the value
- Click Save
- Perform a settings publish