Try Flow Analytics
Flow Analytics in the console expands upon Insights Classics Funnels capability. It allows you to define and visualize cross-app user journeys for deeper inspection, revealing the most and least effective paths users take to complete tasks.
Learn more about Flow Analytics here.
Brief Overview
Insights Classic Funnels help you understand your end-user's path to successfully completing your WalkMe Goals.
A Funnel is a pre-defined group of events that a user moves through on your website. Funnels are made up of individual Tracked Events arranged in sequential order.
Funnel analysis is an effective way to measure conversions on specific user behaviors, as well as to identify dropping points in a process or flow. Users complete a step in the Funnel if they complete the Tracked Event defined for that step of the Funnel. While users can take other actions between two Funnel steps, they will still move through the Funnel if they complete the Funnel steps in their pre-defined order.
There are two possible Funnel views to choose from, relating to Funnel Completion:
- Single Session, the default view, which you can use when you want to see whether a user completed all the steps of the Funnel, in their defined chronological order, within a single session to be considered as having completed the Funnel.
- Total Sessions, which you can use when you want to see whether a user completed all the steps of the Funnel, in their defined chronological order, even if the steps occurred in multiple sessions to be considered as having completed the Funnel.
Insights collects Funnel Completion Rates (the percentage of users that enter a Funnel and complete all of its steps from first to last in sequence) and also collects users' drop-off rates at each step of the Funnel. You can view these statistics on the Insights Funnels Page:

If Session Playback is enabled on your account, you may further investigate drop-off points by viewing realistic re-creations of your users' sessions with Session Playback.
- Note: Playbacks are only available for Session Session view.
Use Cases
Funnel use cases include the following:
- Better understand why some users complete a process while others don't.
- Identify the user-type based saved filters that are most and least likely to complete a particular sequential process by comparing Funnel completion between different saved filters.
- Pro-Tip: By default, Funnels are calculated for all users. You must create saved filters (and can do so wherever there is a filter drop-down menu in Insights) to be able to filter Funnels and compare saved filters.
- Identify confusing areas in a process and optimize its flow to create a better user experience.
- Observe Funnel results before creating your WalkMe solution; use this knowledge to create more targeted, accurate, and effective guidance.
- Observe Funnel results after creating your WalkMe solution; compare to the before results to determine the effectiveness of your WalkMe solution.
-
Funnels Page Breakdown

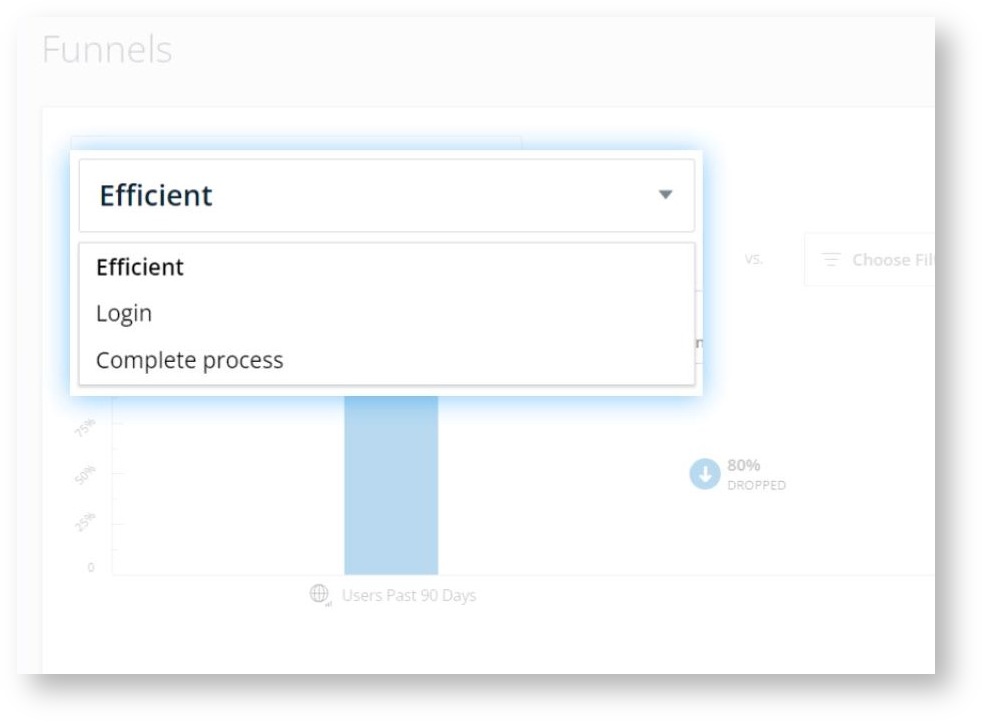
- Funnels Dropdown Menu
- Select from all of your existing Funnels
- The data from the Funnel you select (filtered by any Saved Filter you select below) will populate the Funnel report
- Funnel Completion Window
- Single Session - Use the Single Session view to measure funnel completion that occurred within a single session
- Use case: A customer wants to view the purchase completion process on an E-commerce website, to measure how much time it took from the first step until the last step, in a single session.
- Total Sessions - Use the Total Sessions view to measure funnel completion per user, even if the funnel was completed by the user within one or more sessions
- Use case: A customer wants to view the purchase completion process on an E-commerce website, to measure how much time it took from the first step until the last step, regardless of the number of sessions it took the user to complete the process.

- Action Buttons
- + NEW FUNNEL Button
- Favorite Views Icon
- Click the Star icon to save all the page settings and filters that you have as a favorite view to quickly view it again in the future
- Unclick the icon to remove the favorite view
- EDIT FUNNEL Button
- Click here to edit or delete the Funnel you selected in the Funnel dropdown menu
- Funnel Export
- To further drill down into the numbers behind the funnel, use the Funnel export button.
- If selected, the list will be sent via email or available on the Recent Reports page.
- Single Session:
- The export will provide a detailed list of all end-users and the session where they attempted the funnel process.
- For each end-user and session, you will see the last step that was reached in the funnel, the funnel start time, and the funnel duration (the time it took for the end-user to reach their last step in the session).
- Total Sessions:
- The export will provide a detailed list of all end-users and the number of sessions where they attempted the funnel process.
- For each end-user, you will see the number of sessions where they attempted the funnel process, the last step that was reached in the funnel, the funnel start time, and the funnel duration (the average time it took the end-user to reach their last step within all their sessions, including inactivity time between steps).
- Filters and Date Pickers
- Filters —The filter drop-down contains every saved filter you've previously defined. The data shown on every report on this page relates to the chosen filter
- Date Picker — Likewise, the data shown on every report in this page relates to the chosen date range
- You can compare two saved filters here by selecting a filter on each side of the "vs." text
- Pro-Tip: You can compare different saved filters over the same time period, or the same saved filter over different time periods.

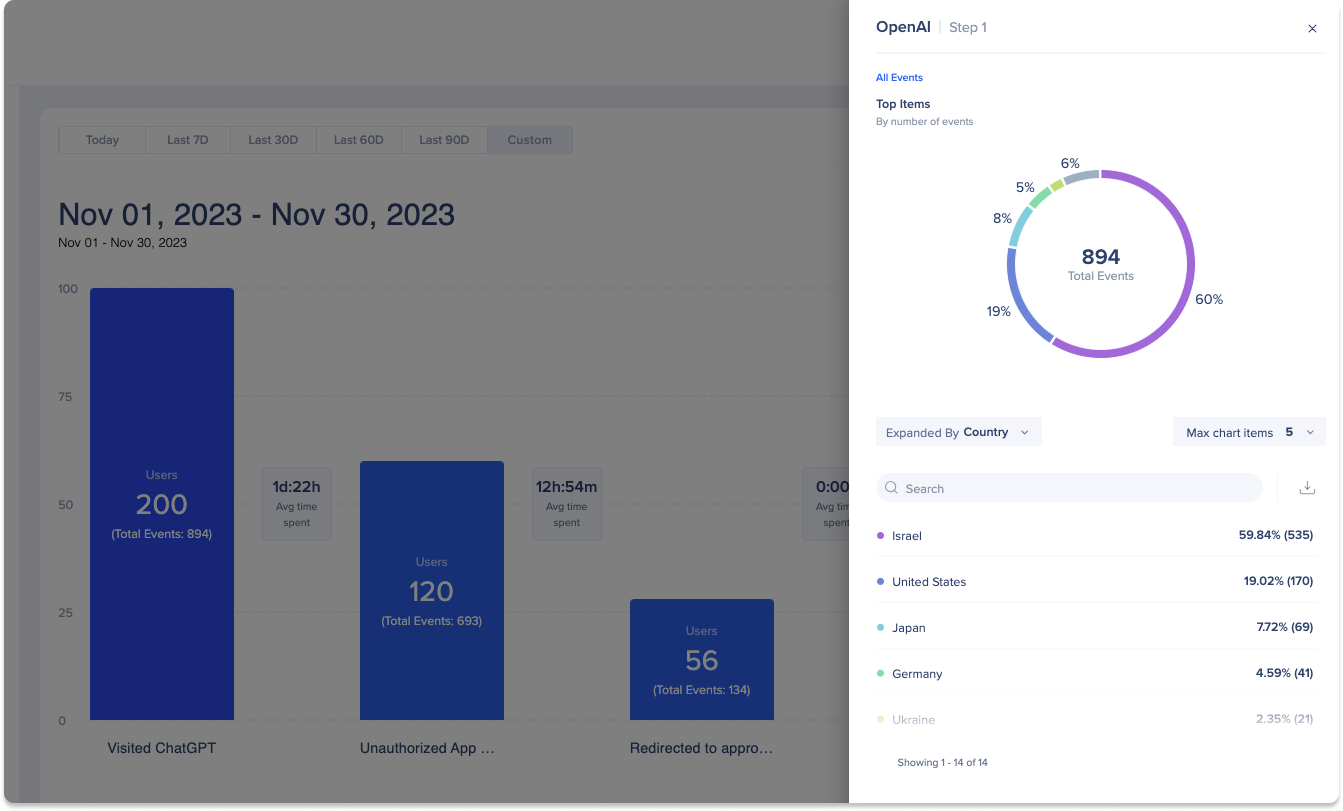
- Funnel Bars
- Each bar represents individual steps in the Funnel, and shows the percentage of users that completed the previous step who also completed this step
- If you hover over a blue bar, a tooltip will be displayed, with detailed information - the number of users that completed this step and the average time elapsed between this and the previous step
- Single Session -
- Average completion time elapsed between two steps calculation method: Time between the first occurrence of step A and the first occurrence of step B (only if it occurred in a single session).
- If you click on a blue bar while in Single Session view, you will see all Session Playbacks where users completed the blue bar's step and all previous steps in the Funnel
- Total Sessions -
- Average completion time elapsed between two steps calculation method - Time between the first occurrence of step A in session 1 and the first occurrence of step B (either in the same session or in session 2) including the inactivity time between steps
- Clock icon - an icon that indicates a relatively long step in the funnel, meaning: this is the longest step in the funnel + it is at least 50% longer than the average step duration in that funnel:

- Dropped icon
- Shows the percentage of users that completed all previous steps in the Funnel but did not complete the next step
- If you click on a DROPPED icon, you will see all sessions in which users completed all previous Funnel steps but did not complete the next step
- Completion Rate
- Shows the number and percentage of users who completed all steps in the Funnel
- Single Session
- Average completion time calculation method - Time between the first occurrence of step A and the first occurrence of step B + Time between the first occurrence of step B and the first occurrence of step C, continuing until the last step in a single session.
- Total Sessions
- Average completion time calculation method - Time between the first occurrence of step A and the first occurrence of step B + Time between the first occurrence of step B and the first occurrence of step C, continuing until the last step, either in a single session or across multiple sessions. Calculation includes inactivity time between steps.
- Average number of sessions it took users to complete the funnel (only includes users who completed funnel)
- Calculation method - Total number of sessions of users who completed the funnel / total number of funnel completions

Note
For best performance results, funnels are limited to 5 steps! For analyzing more steps we recommend to break the funnel into 2. It is a
Comparing Funnel Filters

- Select your Funnel from the dropdown
- Choose a Funnel filter on the left side of the "VS" and a Funnel filter on the right side to compare to
- The results of the comparison will populate the graph
- You can compare different filters along the same date range (for example, to compare the behavior of user segments from different countries), or the same filters along a different date range (for example, to analyze the efficacy of a new WalkMe solution for users from the same country)
Examples of Funnel Processes
Some common processes you may choose to collect using Funnels include the following:
- An onboarding process (Enter email address → Create password → Set preferences → Registration complete)
- Conversion tracking of a purchase flow (View item → Add to cart → Checkout → Enter payment information → Purchase complete)
- Completion of a task (Visit reports page → Search for report → Run report → View report results → Export report)
- Campaign effectiveness (View a campaign message → Click message action → Visit campaign page → Registration complete)
- Funnels data updates daily at 9:00AM (UTC).
- Funnels generated before this time will not include full data from the day before.
DXA Targeted Data Collection Level
- If you have DXA Targeted Data Collection level activated, then your screens will differ slightly
- Due to full data not being collected until Tracked Events are defined, previewing data before a Tracked Event was defined is not possible
- No collected sample data will be available to preview
- If a Tracked Event was created during or after the selected date range, a warning message will appear to alert users that they may not see full data for this time range
- The relevant Tracked Event will have a warning icon next to it indicating the date it was created
- Learn more about Insights Digital Experience Analytics (DXA) Level
- Learn more about Tracked Events
Note
WalkMe tracks unique users rather than all events. This means that if a user triggers an event multiple times in a session, it will only be counted once.
Tracked Events and Funnels Community Webinar


